-
Paper Information
- Paper Submission
-
Journal Information
- About This Journal
- Editorial Board
- Current Issue
- Archive
- Author Guidelines
- Contact Us
Geosciences
p-ISSN: 2163-1697 e-ISSN: 2163-1719
2017; 7(4): 117-128
doi:10.5923/j.geo.20170704.02

Preliminary Ground and Surface Water Resources Trace Elements Concentration, Toxicity and Statistical Evaluation in Part of Yobe State, North Eastern Nigeria
 Abstract
 Reference
 Full-Text PDF
 Full-text HTML
Kwaya M. Y.1, Hamidu H.1, Kachalla M.2, Abdullahi I. M.1
1Department of Geology, Faculty of Sciences Usmanu Danfodiyo University, Sokoto, Nigeria
2African Development Bank-Assisted Rural Water Supply and Sanitation, Yobe State Sub-programme, Damaturu, Nigeria
Correspondence to: Hamidu H., Department of Geology, Faculty of Sciences Usmanu Danfodiyo University, Sokoto, Nigeria.
| Email: |  |
Copyright © 2017 Scientific & Academic Publishing. All Rights Reserved.
This work is licensed under the Creative Commons Attribution International License (CC BY).
http://creativecommons.org/licenses/by/4.0/

Nine Selected Local governments areas from the northern and southern parts of Yobe State in the semi-arid region of North-East Nigeria were investigated statistically for the presence of trace elements in 121 water samples from both surface and groundwater sources. Iron, Chromium, Copper, Manganese and Zinc of detectable concentration have concentration ranges of 0.01-9.0 mg/l, 0.01-0.90 mg/l, 0.02- 4.8 mg/l, 0.001- 4.7 mg/l and 0.01- 11.10 mg/l respectively, with averages of 1.64 mg/l, 0.084 mg/l, 1.15 mg/l, 0.20 mg/l, and 0.93 mg/l respectively. The concentrations of trace elements in the water sources are of the order Fe > Cr > Cu > Mn > Zn, detectable trace elements in the water samples in the area that exceeded WHO/NIS lower limit are Fe 60%, Cr 37%, Cu 16%, Mn 4% and Zn 7%. Calculated pollution index for the trace elements in this study revealed Fe, Cr and Cu to have significant degree of pollution in the analysed water samples. Possible sources of trace elements in the analysed water are natural originating from the rock and soil in the area with which the water was in contact and anthropogenic human activities which comprises of disposals of waste, agricultural application of chemicals, sewages from homes and others. Statistical evaluation of results revealed a weak positive correlation between Cr and Fe, Zn and Cr with values of .037 and .049 respectively which point to similarities in their Hydrochemical properties. PCA differentiates eight groups, while Cluster analysis using Dendrogram have given three clusters with the sources of analysed parameters in water coming from natural and anthropogenic sources.
Keywords: Trace elements, Toxicity, Pollution index, Ground and surface water, Principal component analysis, Yobe state, Nigeria
Cite this paper: Kwaya M. Y., Hamidu H., Kachalla M., Abdullahi I. M., Preliminary Ground and Surface Water Resources Trace Elements Concentration, Toxicity and Statistical Evaluation in Part of Yobe State, North Eastern Nigeria, Geosciences, Vol. 7 No. 4, 2017, pp. 117-128. doi: 10.5923/j.geo.20170704.02.
Article Outline
1. Introduction
- Trace elements constitute less than 0.5 % of the Earth’s crust weight, with 79 naturally occurring elements contributing to this percentage among which are the noble gases [1]. [1] Also pointed out that trace elements definition in the earth sciences is not precise and depend on the concentration of an element in a given phase. The quantitative and qualitative determination of contaminants and the predictions of their possible sources are vital in the attempt of tackling contamination problems in ground and surface water [2]. As their name implies, trace elements occur in small concentration in natural water, their presence can be from natural or anthropogenic sources through natural processes like dissolution and dispersion of naturally occurring minerals in rocks that contain trace elements, and through artificially induced human interaction and activities on the earth surface like mining, industrial release effluent, indiscriminate disposal of household waste, agricultural application of fertilizer, chemicals and animals by products. [3] Stated that mediated reactions which affect the quality of groundwater are dissolution, hydrolysis, precipitation, adsorption, ion- exchange, and oxidation/reduction and biochemical reactions.At lower concentration some of these trace elements are required in the body as micronutrient; Zinc, Manganese, Cupper and Iron are utilized in the body in metabolic activities. Iron specifically assists in the formation of protein haemoglobin, low iron in the body can affect immune system, in young children this can affect mental development which can lead to irritability and concentration disorder. But abnormal higher concentration of trace elements in the body is toxic in human which can lead to malfunctioning of organs and illness. [4] discovered that the concentration of trace elements in groundwater at Obajana and its environs are in the order of Fe > Mn > Zn > Cu > Pb > Cd, with no sample having abnormal heavy metal concentration, in a study conducted by [5] shows that there is a significant degree of pollution contributed by Iron, Nickel and Pb in the drinking water and groundwater resources of Ota with trace element concentration occurring in the following order Fe > Cu > Zn > Ni > Pb > Mn. [6] pointed that leaching of trace metals into the soil and water bodies added to the already existing background value, he further showed that among the analysed Trace elements Fe is the most essentially needed in the human body while Mn, Cr, Zn are require as minor for human growth, he also attested that trace elements are added to water through mining, mineral processing, urbanization and industrialization. [7] discovered that high concentration of fluoride, major and trace elements were observed in areas outcropped by basement complex rocks and younger granites suites. The important of water resources to man and all form of living things is very vital to their survivals, the negligible 2.5 % of fresh water in the subsurface is under threat from both anthropogenic and natural sources, it is in view of this that this study was intended so as to revealed the pollution status of this limited and precious resources in the area of study as regard trace elements concentration. Some of the objectives of this study among others is to assess the concentration level of trace elements in both ground and surface water sources in the area, the relationship between the different elements analysed, the pollution index and toxicity level in water and also the possible anthropogenic and natural sources of contamination in water of the studied local government areas of concern.
2. Materials and Methods
2.1. The Study Area
- Yobe State is located within the semi-arid region of northeastern Nigeria, with the following coordinate: Latitudes 10° 55′ and 13° 40′ and Longitudes 9° 45′ and 12° 29′ Figure 2. There are two distinct seasons, a short wet season of four months which is between June and October, with temporal and spatial distribution of low rainfall of about 1000 mm at the southern part of the state to less than 500 mm at extreme northern part of the state, while the long dry season which normally lasts for seven months is characterized by dry and hot climatic conditions with an annual average temperature of about 32°C. Mean annual evaporation is 1600 mm. Vegetation is typical of Sudan type with sparsely distributed short trees and shrubs, soil type is the vertisols which is heavy and dark, with land elevation ranging between 100 to 300 m above sea level.
2.2. Geology and Hydrogeology of the Study Area
- The area of study falls within the Nigerian sector of the Chad Basin. The origin of the Chad Basin is generally attributed to the rift System that develops in the early Cretaceous when the African and South American lithospheric plates separated and the Atlantic opened. The Cretaceous Rift System of West and Central Africa extends for over 4,000km from Nigeria northwards into Niger and Libya and eastwards through southern Chad into Sudan and Kenya, [8]. Fig.1
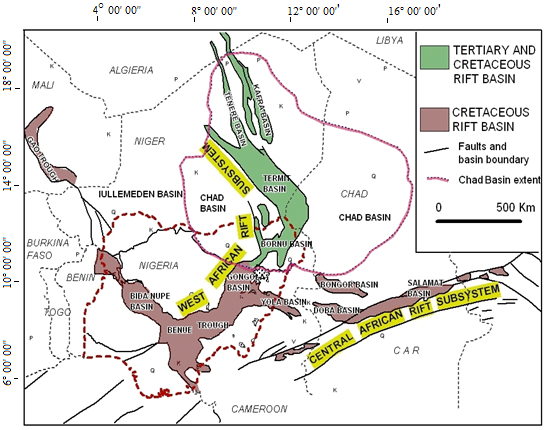 | Figure 1. Location of Nigeria and Chad/Bornu Basin within regional geological map with rifts of West and Central African Rift System. (After Genik, 1992) |
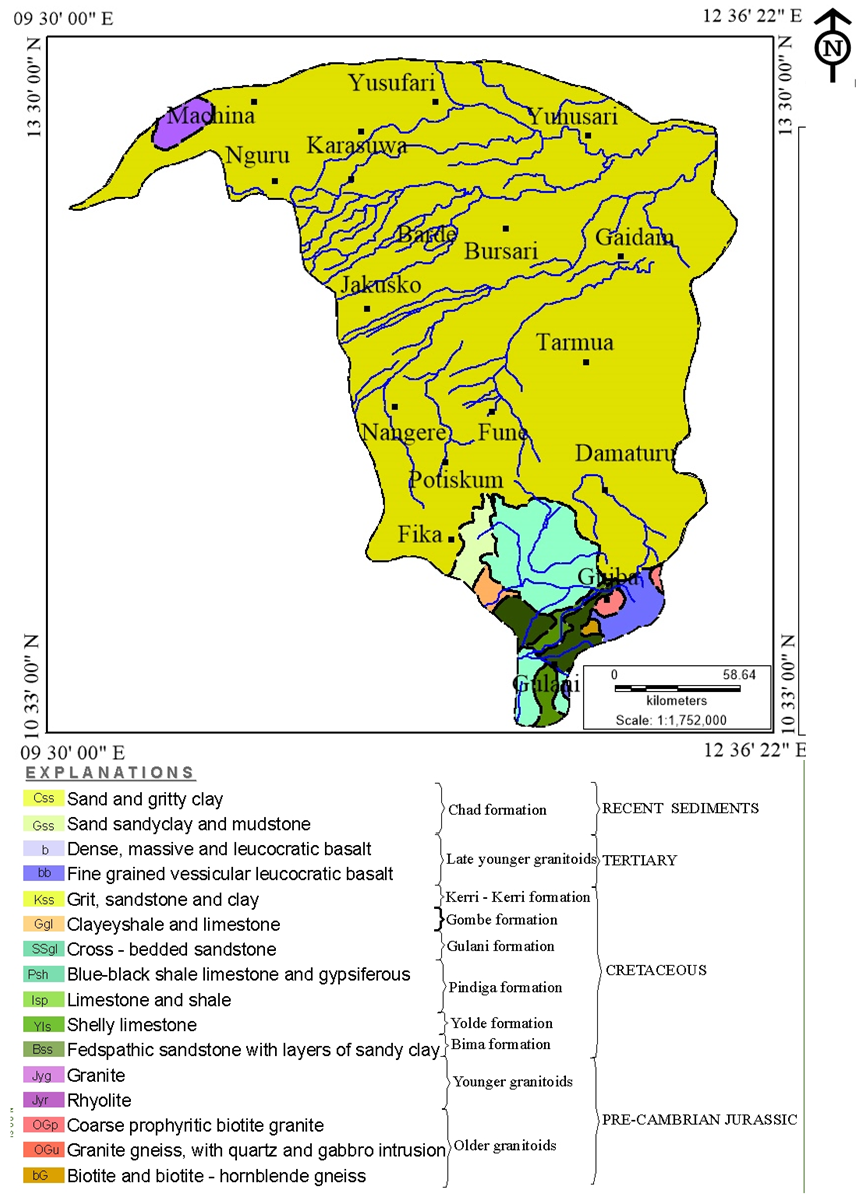 | Figure 2. Geologic Map of Yobe State: Adopted and modified from Geologic and Mineral resources of Yobe (Nigerian geological agency 2006) |
2.3. Water Sampling, Preparation and Statistical Evaluation of Analysed Data
- A total of 121 water samples from 9 local government areas of Yobe state comprising of Damaturu, Fika, Barde, Bursari, Nangere, Gulani, Karasuwa, Nguru and Potiskum were analysed for the presence of trace elements. Water samples were collected in 1 litre polythene bottles during sampling, the containers were rinsed using the water to be analysed at each sampling location. Few drops of Conc. HNO3 was added to the sampled water, prior to this the physical properties of TDS, Electrical conductivity (EC), Ph and Temperature were measured in-situ in the field using a 2 in 1 conductivity and TDS meter and a Ph and temperature meters respectively. Samples collected were immediately transported to the laboratory after been ice park to minimize any reaction that may occur before the commencement of the analysis. The samples were then taken to the Yobe state ministry of water resource water quality control laboratory unit Damaturu were the water samples were analysed for the presence of trace elements notably Fe, Cr, Cu, Mn and Zn using spectrophotometer 7100 model.Water samples were filtered and prepared for analysis. The result of the analysis was further subjected to multivariate statistical techniques to investigate deeply the relationship between the various trace metals in the water samples. Because of its ability to organise large geochemical data-sets into meaningful information, Geostatistical techniques was used to evaluate the physical parameters and trace elements concentrations in the water samples analysed. In this study two statistical Software packages an IMB SPSS 22 version for windows and a Minitab 16 were used, these were used to evaluate the descriptive statistics and correlation of the physicochemical characteristics of the water and the Principal components analysis (PCA) and Hierarchical cluster analysis (HCA) respectively. The factor analysis FA has the advantages of sorting Hydrochemical processes, relationship between analysed data in groundwater; it can also simplify qualitative description of a system through the determination of the minimum variables necessary to reduced various attributes of the data, [14-17]. The PCA has the ability to transforms all element concentrations into several principal components, this express some common properties of the elements on the basis of their similarities without losing any information of the original data, [18]. Hierarchical cluster analysis was used to classify the large data-set of this study into clusters which are smaller groups on the basis of their similarities, Euclidean, [19], it was also used to split sample data into small number of groups with similar hydro-geochemical properties, [20].
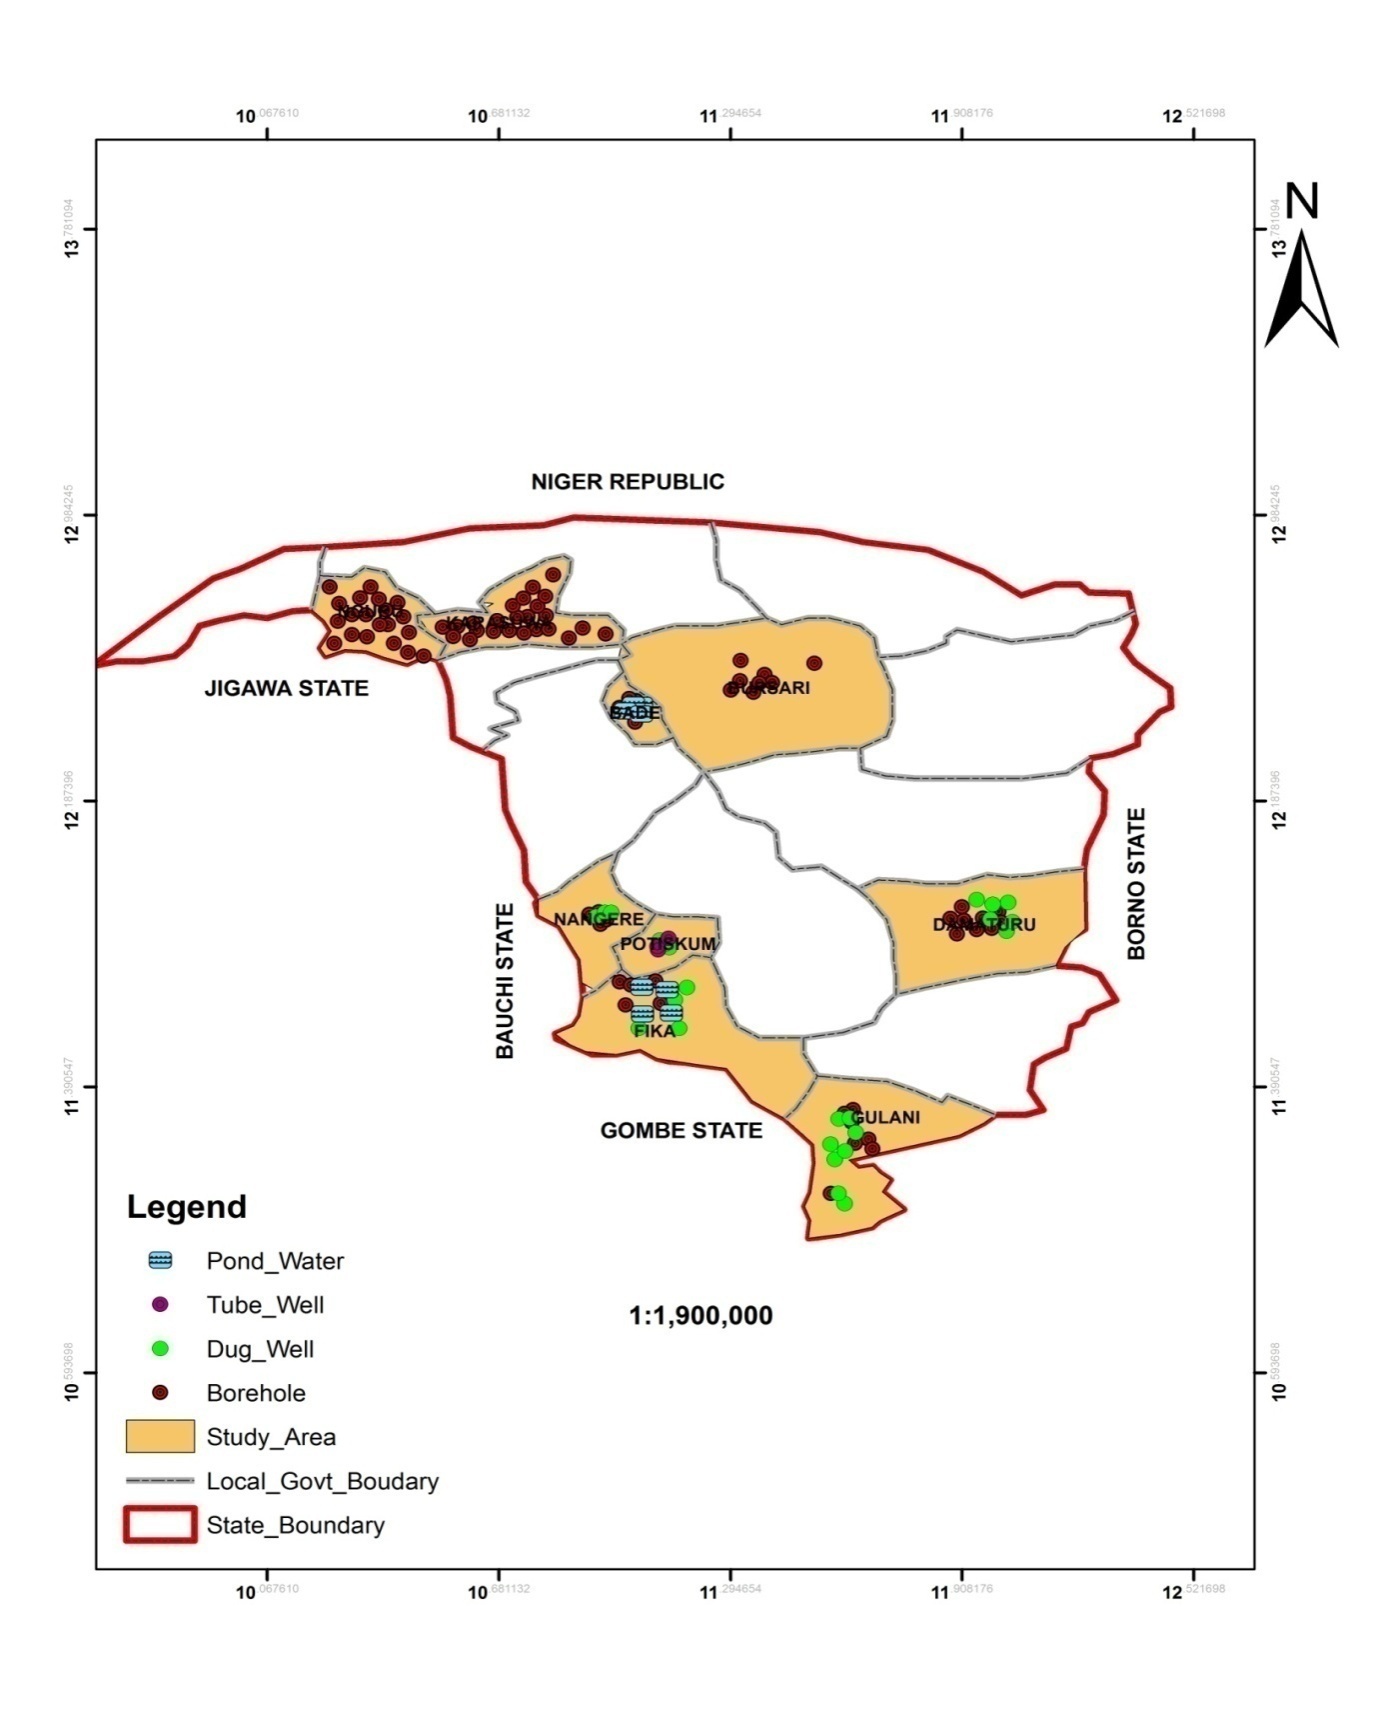 | Figure 3. Location Map of Study area showing Water sampling points |
3. Results
- The summary of results of the analysed Water samples is presented in tables 1 and 2.
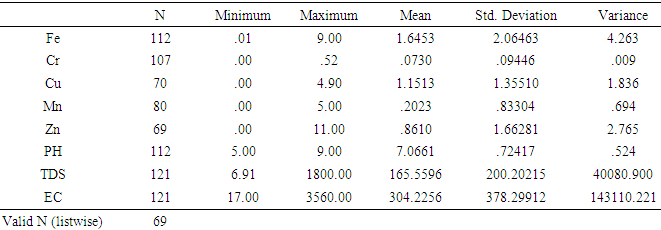
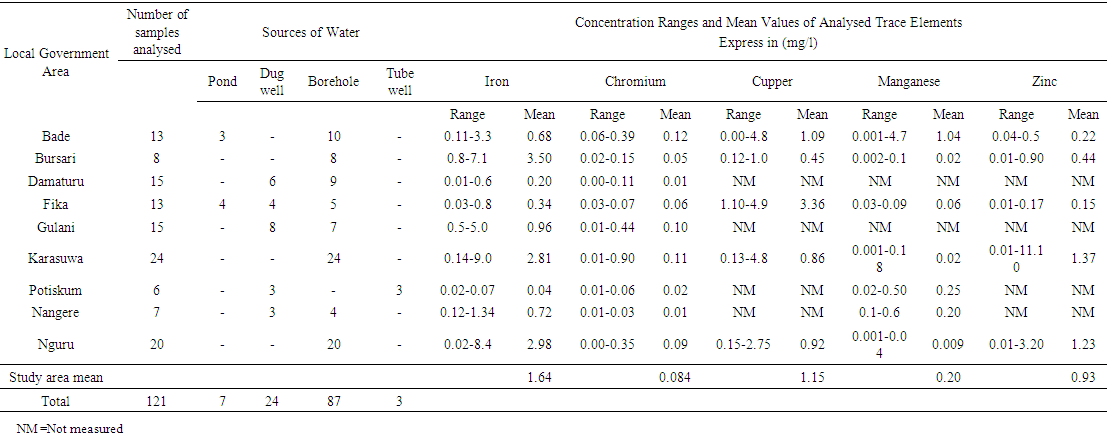 | Table 1. Summary of Trace elements Concentration in different water sources in the Study area |
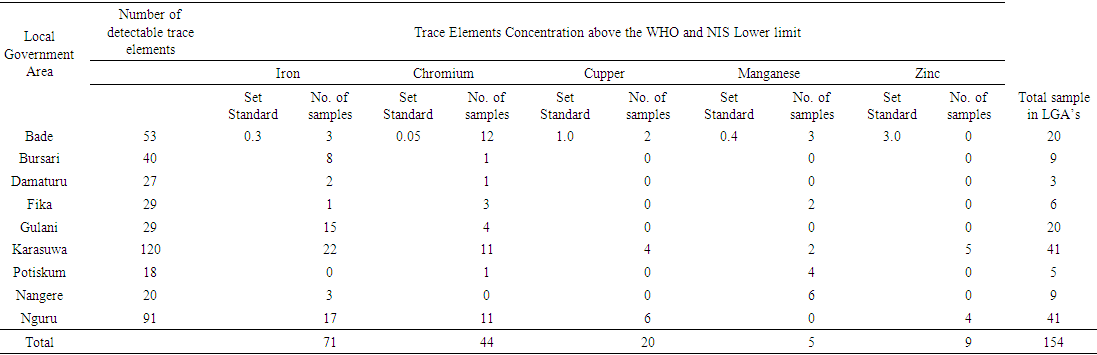 | Table 2. Summary of trace elements with concentrations above the WHO/NIS Standard in local government areas of the study |
4. Discussions
- Total Iron Out of the 121 sampled water analysed, 112 samples representing 92.5% have detectable concentration of Fe that ranges from 0.01 to 9.00 mg/l with an average value of 1.64 mg/l, out of this 73 samples constituting 60% of the analysed samples have concentration above the minimum standard value of 0.3 mg/l, while 34 samples representing 28% have concentrations bellow the lower standard value, only 5 of the anlysed samples have iron concentration of exactly 0.3 mg/l. Based on the different sources of water analysed in the area, 1.91 mg/l iron concentration was the highest recorded for the surface water sources (Ponds), while for the Dug wells, Tube wells and Boreholes (groundwater sources) highest values recorded were 2.0 mg/l, 0.04 mg/l and 9.0 mg/l respectively.Chromium totalChromium was detected in 107 samples representing 88% of the samples analysed. The chromium concentration ranged between 0.01 and 0.90 mg/l with a mean value of 0,084. From the results interpreted 45 samples 37% have their concentration above the minimum standard value of 0.05 mg/l while 59 samples have concentrations that are less than 0.05 mg/l. highest concentration of Cr recorded in Pond water is 0.39 mg/l and highest concentrations of 0.03 mg/l, 0.11 mg/l, and 0.90 mg/l were respectively obtained from the tube wells, dug wells and borehole water sources.Copper Only 70 water samples that represents 57% of the analysed water in this study contained detectable cupper with a concentration that range from 0.02 to 4.80 mg/l with an average 1.15 mg/l. 20 samples which is 16% of the total analysed samples have concentrations that are above the allowable limit of 1.0 mg/l and 41 samples 33% with detectable Cu have their concentration below the WHO/NIS standard value of 1.0 mg/l with only 2 samples having concentration of exactly 1.0 mg/l. The analysis revealed the highest concentration of cupper of 4.90 mg/l was from borehole water while the highest a value of 4.1 mg/l from analysed dug well water.ManganeseManganese was detected in 75 water samples representing 61% and has a range of 0.001-4.7 mg/l with an average of 0.20 mg/l, only 5 samples exceeded the minimum standard of 0.4 mg/l. of WHO and 4 samples have concentration above the [21] (NIS 2007) Nigeria standard.ZincDetectable Zn concentration ranges between 0.01 and 11.1 mg/l and were recorded in only 57 samples this figure constitute 47% of the whole samples analysed with a recorded mean value of 0.93 mg/l. Only 9 samples recorded has concentrations that are above the standard minimum limit of 3.0 mg/l while the remaining 60 samples 49% have concentrations that are below the set minimum value of 3.0 mg/l.
4.1. Toxicity and Health Issues
- Trace elements are considered noxious pollutant in both Health and environmental sciences; they are capable of causing illness because of their toxic nature. Iron is considered to be harmless to certain levels; high concentration of iron in drinking water gives a poor and astringent taste, makes it unattractive, and stains plumbing fixtures and clothing as well as equipments [22]. [23, 22] noted that aesthetic problem of iron includes among others taste, odour, colour, corrosion, foaming and staining properties. Harmful effects of ingesting water with high concentration of iron which when accumulated for a long time in human can cause gene mutation, and haemachromatosis which is due to iron overload, this if persisted can lead to heart disease, liver problems and diabetes, also haemorrhagic necrosis and sloughing of areas of mucosa in the stomach have been reported [23, 24]. High concentration of Manganese in the basal ganglia of the brain can cause irreversible neurological syndrome known as manganism that is similar to Parkinson’s disease, high doses can lead to DNA and chromosome aberrations, large margin can affect fertility in mammals and are toxic to the fetus and embryo. The most important risk of excess manganese intake is the damage it can cause to the central nervous system, Neurological impairment [23, 25]. Manganese concentration level as low as ≤ 1.0 mg/m3 can affect the functioning of some motor neurons [24].Chromium especially Cr+6 is known to be Carcinogenic, high concentration of Cr+3 can cause damage to DNA. Acute toxicity of Chromium is within the concentration range of 1.5 and 3.3 mg/kg, similarly the oxidation power of Cr +6 can damage kidney, liver and blood cells, Lung cancer. Other severe acute effects of high dose ingestion in humans are gastrointestinal disorder, haemorrhage diathesis and convulsion with cardiovascular shock which can lead to death [26].[27] Showed that high quantity of Cu ingested into the body can cause among others the following diseases: gastrointestinal bleeding, haematuria, intravascular haemolysis, methaemoglobinaemia, hepatocelluler, acute renal failure and oliguria.Zinc can have harmful effects in human when excess quantity are ingested into the body system, these includes; vomiting, nausea, stomach cramps, diarrhea, bleeding and abdominal cramps, [28]. Water containing Zinc above 3 mg/l can have aesthetic issues and tends to be opalescent develops greasy film when boiled and has an undesirable astringent taste, acute toxic effects of inhaled zinc will includes pulmonary distress, fever, chills and gastroenteritis, [29].It is evidently clear from above that trace metal when taken into the body in excessive dose have health implication, from the result of this study the concentrations of the five trace elements analysed in water from the area is of the order Fe > Cr > Mn > Cu > Zn. Trace elements analysed in the water samples with concentrations that are above the lower limit set by WHO, with the elements having the following order Fe > Cr > Cu > Zn > Mn. Water samples with elevated concentrations of these trace elements are capable of causing different types of ailments in humans if ingested in high dose for a long period of time because of their toxicity at such high concentrations.
4.2. Pollution Index (P.I)
- This give the ratio of concentration of individual trace element against the baseline standard and it give information on the relative pollution that is contributed by individual sample, with 1.0 being set as the critical value. Values greater than 1.0 indicate significant degree of pollution while value less than 1.0 will mean no pollution, [5, 30]. Computed P.I values for the individual trace element in the area of study revealed that Fe, Cr, Cu Zn and Mn have P.I values of 5.4, 1.68, 1.15, 0.93, and 0.5 respectively, indicating that the first three trace elements have pollution index values that are above 1.0 revealing them to have significant degree of pollution in the water sources, only the values for Zinc and Manganese shows no pollution statues with P.I values of less than 1.0.
4.3. Statistical Treatment of Results
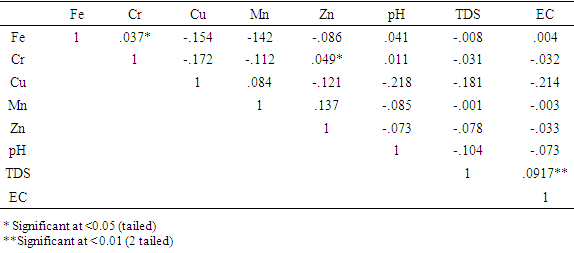
- [31] Pointed out that multivariate statistical techniques have the advantage of simplifying and organizing large set of data by data reduction and interpretation of variables. For this study the principal component analysis (PCA) techniques was used for data reduction and deciphering patterns among large data set, these are Eigenvectors of variance- covariance or correlation matrix of the original data matrix. Hierarchical cluster was used to find the true groups of data, it is the most widely applied techniques in the earth sciences, further levels of similarities at which observations are merged and used to construct a Dendrogram. In Clustering objects that are similar are grouped into the same class, [32]. As is normally the case in hydrochemistry, [33] showed that inspection of correlation matrix is useful because it can point out relationship between variables that can show the participation of the individual chemical parameter with several influence factors.Pearson correlation was employed to correlate between the trace elements that were analysed. Correlation between the eight variables PH, TDS, EC, Fe, Cr, Cu, Mn and Zn is shown in table 4, only chromium and zinc have significant values of r = .037 and r = .049 which are both less than 0.05, in other word there is a good correlation between chromium and iron and between zinc and chromium this shows that these trace elements have similarities in their Hydrochemical properties within the study area, other values are more than < 0.05 or have negative values which are both not significant. Only one value is significant at less than 0.01 with a value of r = .917 which represents the relationship between TDS and EC which confirmed the close relationship and dependency of these measured physical parameters in analysed water samples in this study.
|
|
4.4. Principal Component Analysis (PCA)
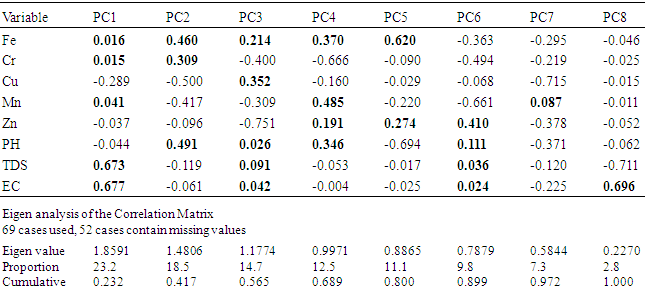
- The total variance of the variables analysed and their rotation components matrix are contained in table 5. This consist of Eight principal components groups with a total variance of 99.9% with PC1 taking up 23.2% of this total and is made up variables like Fe, Cr, Mn, TDS and EC which are all positively loaded with TDS and EC predominating, with trace elements weakly positively loaded. PC2 loading contributed 18.5% the total variance with positive contribution made by Fe, Cr and PH possible sources of these elements are Geogenic derived from weathering of rocks and under aerobic reducing condition. PC3 component made up 14.7% which has positive contribution from Cu, Fe, PH, TDS and EC. Cu is the dominant variable with the possible sources of these elements in this group been from natural sources from rock weathering and also anthropogenic sources which refuse leaching, sewages. 12.6% has positive loading for Fe, Mn, Zn and PH in PC4 these variables reflect natural sources for the elemental component under reducing condition. For PC5 Fe and Zn have positive loading that contributes just 11.1%, this contain the highest loading for Fe in these components. In PC 6 only Zn has positive contribution among the trace elements with possible Geogenic source from weathering of rock and enrichment under oxidation/ reduction situation, a possible contribution from surface anthropogenic sources, with only 9.8% of the total variance contributed by this component. In PC 7 manganese is the only parameter with a positive and contributed only 7.3% of the variance while PC 8 has no any positive loading from any of the analysed trace elements there for not significant. According to [34] a positive value in PCA means the presence of that parameter in water will have effect on the water and a negative loading indicates no effect from such a parameter.
|
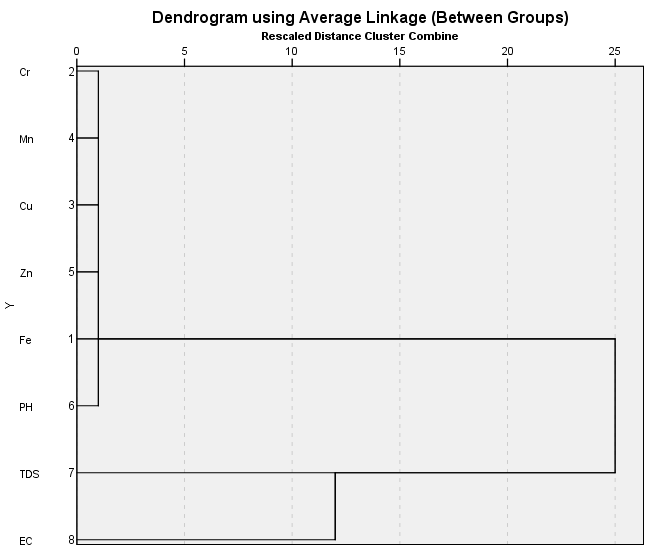 | Figure 4. Dendrogram of trace elements and physical parameters of analysed water |
4.5. Genesis of Trace Elements in Water Sources
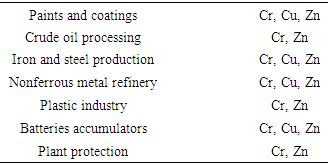
- [35] Point out that the quality of groundwater in natural system is as a result of many environmental factors such as climate, geology, biochemistry, composition of atmospheric precipitation and nature of hydrology, he further pointed out that the source of most dissolved ions in natural water is the mineral assemblages in the rocks near the land surface. In its natural condition groundwater is generally good with respect to its portability and use in agriculture and industry, but deep aquifers located adjacent to surface water bodies or in low permeable rocks characterized by slow movement of groundwater and long contact time gives rise to groundwater of poor quality which is often not suitable to different uses [36].[37] reported that trace elements are generally present in small concentration in natural system, their occurrence in ground and surface water can be due to natural sources such as dissolution of natural occurring minerals containing trace elements in the soil zone or the aquifer materials or human activities such as mining fuels smelting or ores and improper disposal of industrial waste. However secondary dispersion of elements from bedrock in the surface environment occurs as a result of physical and chemical weathering which is promoted by atmospheric oxygen and water, [1], these researchers further pointed out that the fate of trace elements in solution depends on the behavior of aqueous species and consequently trace element can either get leached from weathered materials into surface or subsurface water or be precipitated from solution as hydroxides, oxyhydroxides carbonates, sulfates phosphates etc.High concentration of iron in water can be from dissolution of laterate and ferriginous sandstone [38], hematite, magnetites and iron pyrite as well as corroded pipes and plumbing fixtures also add iron to drinking water. [22] gives four types of iron in water, Ferrous iron which is Fe (II) which appear colourless and clear in water formed under reducing condition with low Oxygen content normally associated with deep wells or aquifers if water is allowed to stand for some time rusty particles settle down at the bottom. Ferric iron three formed under oxidizing condition gives water reddish colouration due to exposure of water to atmospheric oxygen given rise to reddish brown to black rusty sediments that are insoluble. Iron bacteria this occur as gelatinous and slimy substances which appears as brown red or white appearance, it is nonpathogenic and occur in both surface and groundwater, and plumbing fixtures. Organic iron on the other hand combined with different organic materials to form complex organic compounds and occur in shallow wells and surface water as yellow or brown colouration.Geogenic sources of Chromium are ultramafic rocks and Sepentanites of Opiolites where it occurs up to a concentration of 60,000 mg/l [39] and the also discovered that manganese mineral birnessie oxidized and assist in the release of Cr (III) into solution since chromium is resistant to weathering, digenesis and low grade metamorphic reactions. Manganese usually occurs alongside iron and is widely distributed in soil, sedimentary rocks and water, [40]. Manganese occurs naturally in surface and groundwater in an oxygen depleted environment [41] it can be leached from overlying soils and minerals in underlying rocks. Oxidation and dissolution of rocks of gabbroic composition gives trace elements like Cu, Zn, Li, Cd, V and Mn while weathered granitic rock will release Cu, Ba, Rb, Pb and As, [42]. Copper are released into groundwater by copper bearing ores cuprite, melakite and azurite. Based on [24] dissolution is favoured under oxidizing situation while its precipitation is archived under reducing environment.[1] Give the anthropogenic sources of Zn, Cr, and Cu in water to be mining, smelting and industrial processing of Ores and metals, coal combustion, chemical industry table give the summary of these trace metals and their anthropogenic sources in the environments and water sources. However the area is not industrialized as such the most probable sources trace elements in water are natural from the soil and rocks and anthropogenic sources like mining, leaching of refuse materials, agricultural activities like application of fertilizer, pesticides and chemicals, suckaways, buried petrol tanks, sewages and a lot of other human activities.
|
5. Conclusions
- In this study trace elements with elevated concentrations above the WHO/NIS standard were detected in the water sources, the general trend in concentration of the elements is Fe > Cr > Cu > Zn > Mn. Correlation between these trace metals revealed a good correlation between chromium and iron and between zinc and chromium. Two major sources of the elements are natural and anthropogenic, with Fe, Cr and Cu having high pollution and toxicity index. Multivariate PCA and Cluster analysis revealed a weak relationship between the trace elements in the water which can be due to distribution of the analysed water samples in the study area as well as lack of consistency in the measurement of analysed parameters in water samples. From the result of this preliminary investigation it is recommended however that more elaborate extensive research work is recommended to cover the entire state and determination of all parameters in the water sample should be carried out to have a more representative results through the use of higher sensitive instruments to further analysed and interpret the presence and concentration of trace toxic elements in the water sources of the state entirely.
ACKNOWLEGEMENTS
- We wish to thank the Yobe State African Development Bank sub-programme, Damaturu for financing the analysis and staff of the ministry of water resources water quality control laboratory Damaturu.