S. Sarkar, D. Shanker
Department of Earthquake Engineering, Indian Institute of Technology Roorkee, Roorkee, India
Correspondence to: D. Shanker, Department of Earthquake Engineering, Indian Institute of Technology Roorkee, Roorkee, India.
| Email: |  |
Copyright © 2017 Scientific & Academic Publishing. All Rights Reserved.
This work is licensed under the Creative Commons Attribution International License (CC BY).
http://creativecommons.org/licenses/by/4.0/

Abstract
The National Capital Region (NCR) of India is situated on top of some active faults with moderate level of seismicity which makes it an earthquake prone city. Further the dense population and large number of engineering structures in the area, make it vulnerable to earthquake hazard. It is very imperative to design the buildings and other engineering structures in this region only after assessing the seismic hazard so that loss of life and property damage may reduce. For this, earthquake catalogue is prepared using different available earthquake reporting agencies for National Capital Region (NCR) region and then Probabilistic Seismic Hazard Assessment is carried out for NCR region using the CRISIS2007 software. Hazard maps are prepared for structures of different time period for both, fixed intensity and fixed return periods. Seismic Hazard Curves and Uniform Hazard Response Spectra are also prepared for various sites in and around the considered region, which will be helpful for earthquake resistant design, risk targeted design and fragility analysis of structures at these sites.
Keywords:
Probabilistic seismic hazard analysis, Attenuation relationships, Seismic hazard curves, The National Capital Region (NCR)
Cite this paper: S. Sarkar, D. Shanker, Estimation of Seismic Hazard Using PSHA in and around National Capital Region (NCR) of India, Geosciences, Vol. 7 No. 4, 2017, pp. 109-116. doi: 10.5923/j.geo.20170704.01.
1. Introduction
Earthquake is one of the most complex phenomena which we are facing since the beginning of our civilization. Even now it is nearly impossible to predict an earthquake accurately. The much hype around this natural disaster is due to uncountable loss of lives and demolition of structures it has caused. Several statistical and probabilistic models are being developed to estimate the size, time and location of upcoming earthquakes. However, engineers do not care much about the magnitude of an earthquake, which is basically the amount of energy released at the focus, but the ground motion parameters (GMPs) like intensity, peak ground acceleration (PGA), spectral acceleration etc., also now as the hazard parameters. The response of a building, bridge, dam or any other engineering structure to an earthquake depends directly on these ground motion parameters. Several ground motion parameter equations or attenuation relationships are developed by seismologists to estimate the ground motions for a region or site based on several factors like hypo-central distance, site condition, seismicity of the nearby sources etc. Generally, Seismic hazard assessment is carried out for estimating the ground motion exceedance rate in a particular time period. Traditionally, two basic types of seismic hazard assessments methodologies are followed: deterministic seismic hazard assessment (DSHA) and probabilistic seismic hazard assessment (PSHA). DSHA is a highly conservative method and is used for the design of structures which can cause severe hazard on collapse like dams, nuclear power plants etc. DSHA is mainly based on a single worst case scenario ground motion consideration. Whereas, PSHA incorporates all types of uncertainties associated with the earthquake location, occurrence, magnitude etc. and is considered economical and less conservative model. PSHA results are widely used for designing any type of structures. In this investigation probabilistic seismic hazard assessment has been carried out for the National Capital Region (NCR) of India. NCR is one of the most densely populated and highly industrialized regions in India. As per IS 1893 (Part: 1) : 2002, most part of NCR including capital region of New Delhi falls under zone IV in the seismic zoning map of India and rest parts in zone III, which makes it important for such types of studies due to its vulnerability to major earthquakes.
2. Study Area
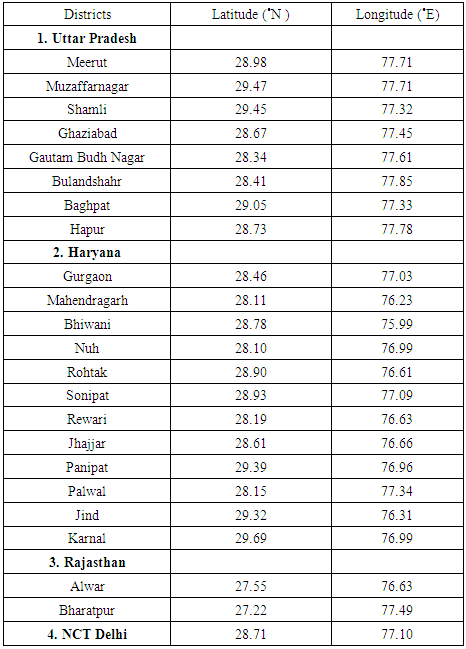
The area of study (Fig. 1) comprises of three states Uttar Pradesh, Haryana, Rajasthan and National Capital Territory (NCT) Delhi (Table 1) consists of 23 districts with a total area of around 58332 square km. The area is bounded by Karnal in the north, Bhiwani In the west, Bharatpur in the South and Bulandshahr in the east.Table 1. Districts of NCR
 |
| |
|
3. Seismotectonic Features of NCR
The NCR is surrounded by many major lineaments, thrusts and faults. Out of which some are alive (active) and some are not. An active source or fault is one which has shown some movement or seismic activity in the past 10000 years. Active faults are more likely responsible to cause the next earthquake in the surrounding region. The NCT Delhi microzonation report published by Indian Meteorological Department in 2014 and a document published by SHARMA and WASON (2004) are utilized as base reference to distinguish and plot the major active sources in the area of study. Finally seven major seismic faults were identified out of which six have been modelled as line source, and one as area source are taken as input parameters for analysis in CRISIS2007. These seismic faults are Great Boundary Fault (GBF), Moradabad Fault, Mathura Fault, Sohna Fault, Delhi-Haridwar Ridge, Mahendragarh-Dehradun Fault (MDF) and the Frontal Folded Zone. Only the Frontal Folded Zone in the Himalayan region is modelled as an area source. Despite being away from the NCR region, the Frontal Folded zone has been considered, because the tremors/major earthquakes caused by this zone are frequently influence the NCR seismic activities, causing structural damage and strong shaking. The locations of the considered active faults are shown in Fig. 1.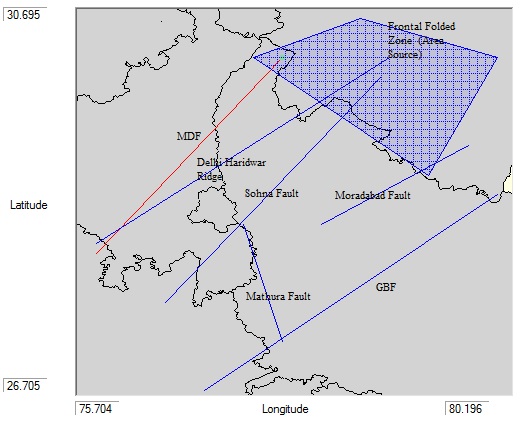 | Figure 1. Seismotectonic map of NCR (containing only the active sources which are used for modeling in CRISIS2007) |
4. Earthquake Catalogue
The very first step to carry out a seismic hazard analysis of any region is to make suitable earthquake catalogue for that region. An earthquake catalogue gives us information about historical and recent earthquake magnitude, focus (focal depth) and time. Earthquake data for the study area has been extracted from several agencies like United State Geological Survey (USGS), International Seismological Center (ISC), India Meteorological Department (IMD) New Delhi and also several publications like IYENGAR et al., 1999. 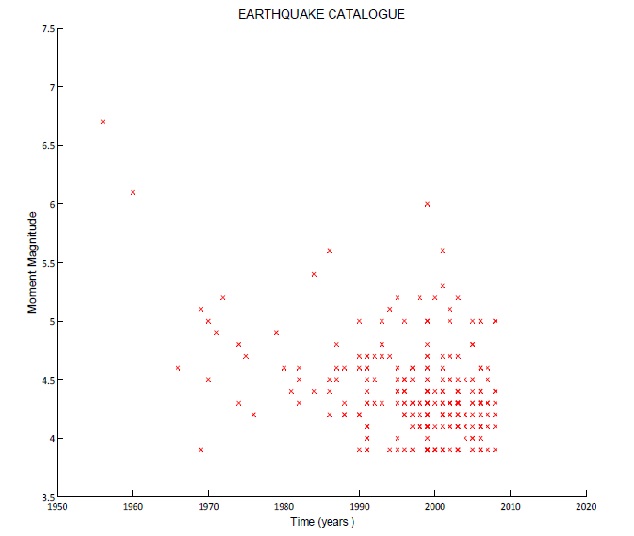 | Figure 2. Plot illustrating the moment magnitude of earthquake occurred during 1955-2010 in NCR includes main shock, foreshock and aftershock |
While forming the catalogue it is very important that it should be homogeneous i.e. all the magnitude values taken from various sources have the same scale. If the data consists of different magnitude scale, then they are converted to same scale using conversion relationships. This process is known as homogenization of an earthquake catalogue. In this study, I have considered the moment magnitude scale for all computations.
4.1. Catalogue Declustering
The earthquake catalogue that is shown in Fig. 2 contains foreshocks and aftershocks along with the main events. Now for seismic hazard analysis only main events are to be considered for any analysis. Hence the foreshocks and aftershocks are to be removed from the catalogue in order to carry any further analysis. Declustering has been done in space and time domain by using the algorithm of REASENBERG (1985); GARDNER and KNOPOFF (1974). Initially the catalogue consisted of 245 events for the time period 1955-2010. But after declustering the number of events has reduced to 139 and these events are plotted and shown in (Fig 3). There were 42 foreshocks and 64 aftershocks. 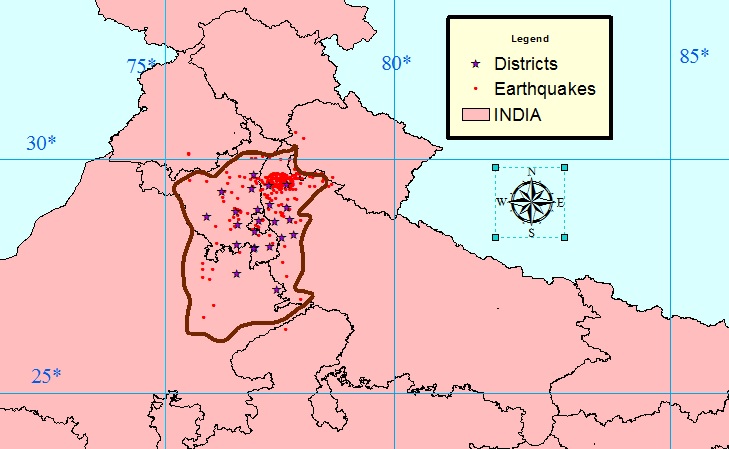 | Figure 3. Seismicity of NCR (1950-2008) after declustering |
4.2. Completeness of Catalogue
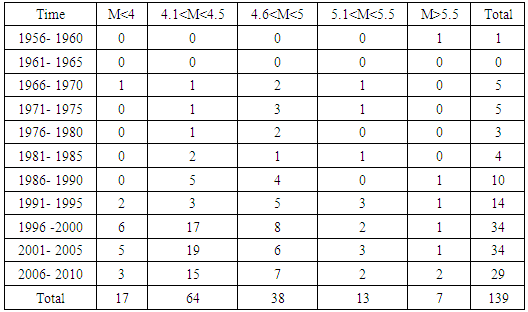
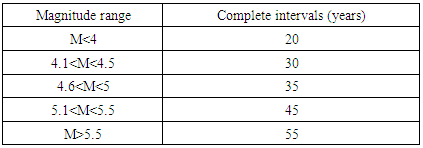
Due to lack of proper instruments and networking in earlier times, many earthquakes data were not recorded. If the degree of incompleteness is very high then the analysis carried out will not give accurate results. Hence it is important to know the degree of completeness of an earthquake catalogue before doing any further analysis. The most famous method to check the completeness of an earthquake catalogue is method described by STEPP (1972). For the considered region the whole dataset were divided into five groups: M<4, 4.15 for the time period 1955-2010 i.e. 55 years. We have calculated the average number of events each year in each magnitude group formed above, and then the standard deviation of the mean rate (λ) are calculated for considered sample length. According to Stepp, the deviation of λ form the tangent (1/√T) gives the degree of completeness. Figure 4 and Tables 2 & 3 described the results of data treatment for the completeness. Table 2. Number of reported earthquakes in different magnitude ranges in 5 year time period (for completeness analysis)
 |
| |
|
Table 3. Completeness of earthquake catalogue
 |
| |
|
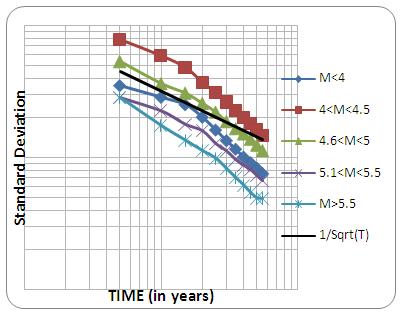 | Figure 4. Variation of standard deviation of different magnitude range against time interval and the tangent line 1/√T |
5. Seismic Hazard Parameters of NCR
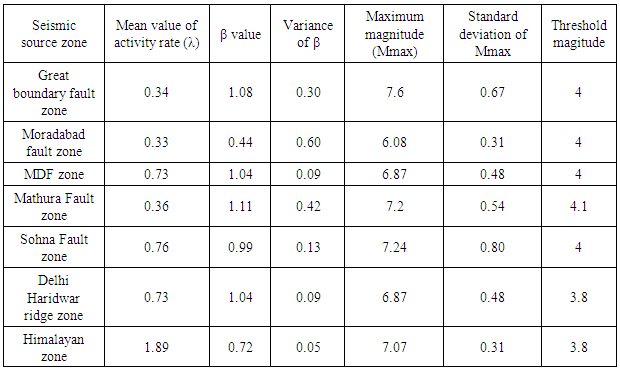
Maximum magnitude (Mmax), earthquake activity rate (λ) and the b-value (or the β-value) from the Gutenberg-Richter relationship are the three major seismic hazard parameters which are used to define the seismicity of an area or a source governing the earthquake scenario of given region. The most common frequency–magnitude distribution proposed by GUTENBERG and RICHTER (1954).Poisson’s distribution. This relationship is helpful only if the catalogue we are dealing with has 100% completeness and contains each and every earthquake data for a very large period of time. But this is not possible in actual practice. Hence after several efforts a method was established to deal with the incomplete data files by incorporating magnitude heterogeneity, utilizing the extreme and complete set of catalogue of various threshold magnitudes. Maximum likelihood estimation of the seismic hazard parameters by KIJKO and SELLEVOLL (1989) is commonly used. However, this method could not tell uncertainty in magnitude. KIJKO and SELLEVOLL (1992) again formulated a methodology incorporating the uncertainty of magnitude and a computer program was developed to calculate the hazard parameters. This methodology is widely accepted and used to find the seismic hazard parameters for many regions. In recent years, new approach is presented by MUSSON (2003) which estimates all the three hazard parameters (λ, β and Mmax) simultaneously using Monte-Carlo simulation. This method assumes Poisson’s model for earthquake occurrence and selects a set of values for the triplet (three hazard parameter) randomly and uses them to make a new synthetic earthquake catalogue using Monte –Carlo simulation. This synthetic catalogue is then compared with the originally prepared catalogue for that region. This is an iterative method, goes on until the synthetic catalogue matches with the original catalogue.The seismicity of the Delhi region has been reported several times before, but only limited publications and reports. The Delhi microzonation report by Indian Meteorological Department (2016) has divided NCT Delhi into 4 seismic zones based on the presence of active faults and earthquake occurrences, while several other publications have divided the NCR region into 5 and 6 zones. In this study we have utilized some of the estimates as given in Table 4 (SHARMA and WASON; 2004). Table 4. Seismic hazard parameters for NCR
 |
| |
|
6. Attenuation Relationships
When engineers talk about earthquakes and hazards related to it, they don’t mean the earthquake magnitude in Richter scale as it merely describes the amount of energy released at the focus but, the value of intensity, spectral acceleration or peak ground acceleration which actually causes the destruction. Hence it is very important to compute the ground motion while doing probabilistic seismic hazard analysis. However, in most of the cases strong ground motions data are not available or recorded. Several empirical equations were made to estimate the ground motions as a function of site conditions, magnitude source to site distance, tectonic features etc. These relationships which are used to compute the ground motion are known as ground motion prediction equation (GMPE).The sites characteristics of NCR can be classified into three major classes: class B, class C and class D. Class B is hard and firm rock where shear velocity ranges 760-1500m/s. Class C is dense soil and soft rock where shear velocity is 360-760m/s. And class D is soft soil with shear velocity 180-360m/s. As reported by Indian Meteorological Department, most of the NCR sites are of sandy soil mixed with clay and silt i.e. of class D.YOUNGS et al. (1997), ABRAHAMSON and SILVA (1997) and others are few important publications which deals with the attenuation relationships. In India, we do not have ground motion prediction equations for each and every sites but for few seismically active regions (IYENGAR and RAGHUKANTH; 2004) for Peninsular India, SHARMA (1998) for Himalayan region. But no GMPEs are available for NCR. In this study we have mainly used one built-in attenuation model from CRISIS2007, which is YOUNGS et al. (1997) for interface fault location and soft soil site condition.
7. PSHA Using CRISIS2007
Several computer softwares are available for probabilistic seismic hazard assessment like CRISIS2007, SEISRISK III, EQRM, FRISK88M, OpenSHA etc. In this study, the analysis is done using CRISIS2007 due to its flexibility and applicability. Firstly, the map of the study area (NCR) is prepared, along with the existing faults considered to be modelled for the analysis. In general, fault modelling is done as point source, line source or area source. In our case, out of seven faults, six are modelled as line source (Great boundary fault (GBF), Moradabad fault, Mahendragarh-Dehradun fault (MDF), Mathura fault, Sohna fault and Delhi-Haridwar ridge), and the Frontal Folded zone in the Himalaya has been modelled as an area source. The computed seismic hazard parameters for these sources/faults have been estimated and used as input parameters in CRISIS2007 built-in attenuation models assigned to each source/fault as per the site condition of NCR (i.e. soft soil/alluvium soil). Different Ranges of intensity measures (in this case PGA) have been assigned for different structural periods for which the software estimates the hazard values. In this software the intensity is measured in terms of ‘gal’ unit (1 gal = 0.01m/sec2; 981 gals = 1g or 1g = 9.81m/sec2).
8. Results
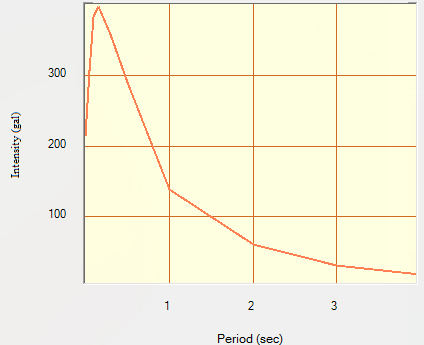
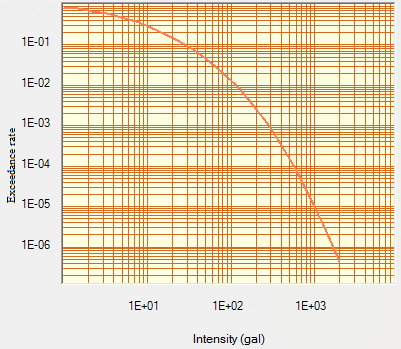
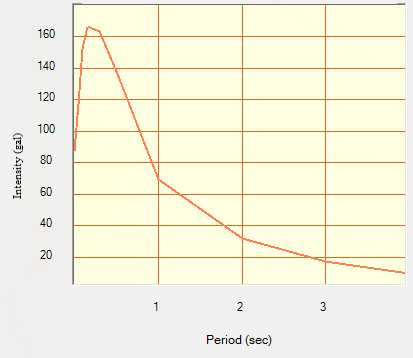
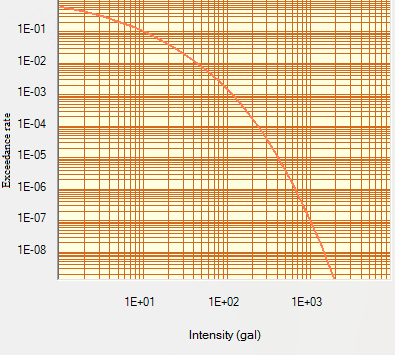
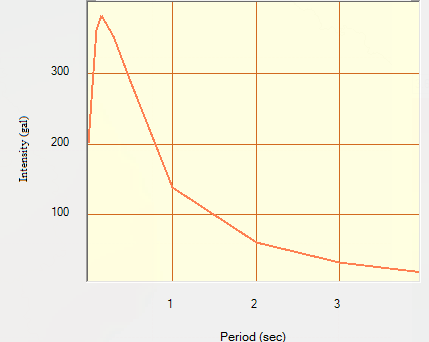
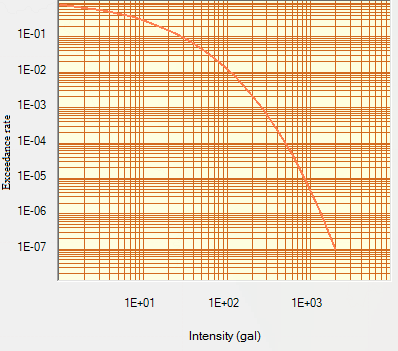
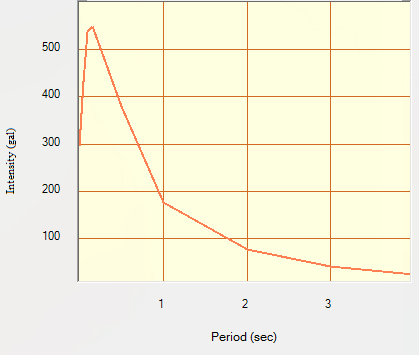
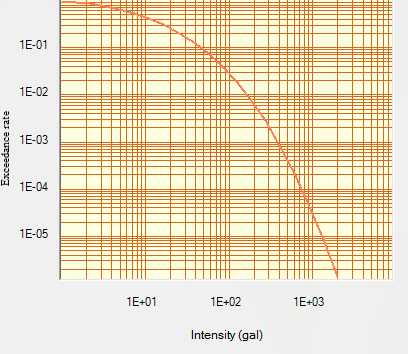
Results obtained from the analysis are presented in three hazard maps prepared in the forms:i) Seismic hazard map for NCR for fixed return periods (475 years for Design basis Earthquake (DBE) as shown in Fig 5 and 2475 years for Maximum Considered Earthquake (MCE) shown in Fig 6.ii) Uniform hazard spectra (UHS) at various sites for a particular return period of 475 years for DBE (Figs 7, 9, 11, 13 and 15). iii) Hazard curve i.e. exceedance rate for intensity/PGA for different sites (Figs 8, 10, 12, 14 and 16).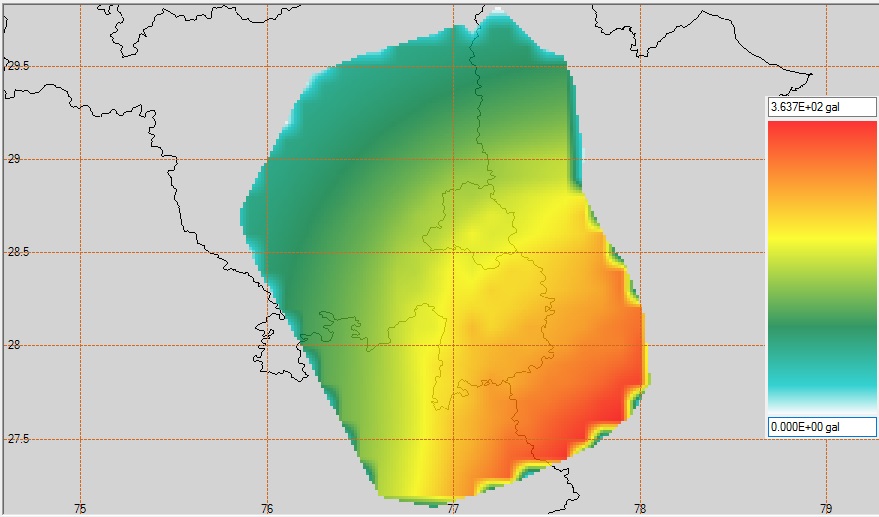 | Figure 5. Seismic hazard map for fixed return period of 475 years (Design Basis Earthquake) |
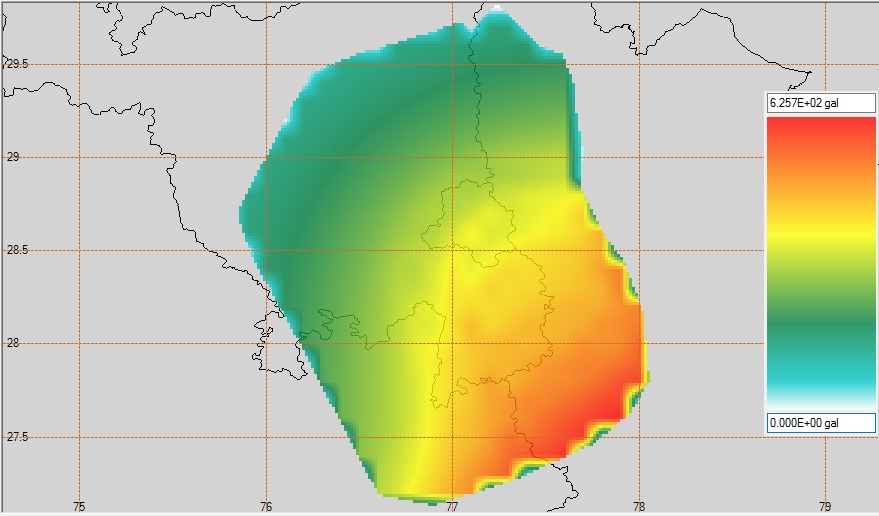 | Figure 6. Seismic hazard map for fixed return period of 2475 years (Maximum Considered Earthquake) |
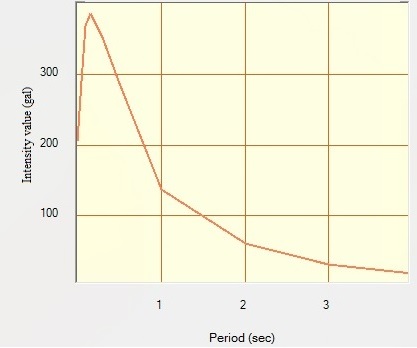 | Figure 7. UHS for return period 475 years at Connaught place, Delhi |
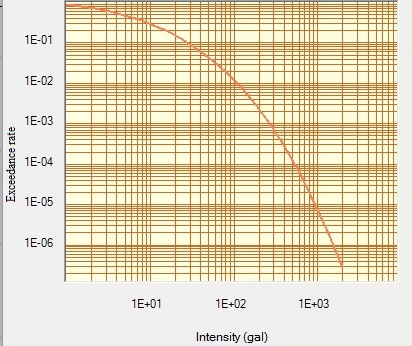 | Figure 8. Hazard curve for intensity at 0 sec at Connaught place, Delhi |
 | Figure 9. UHS for return period 475 years at Gurgaon |
 | Figure 10. Hazard curve for intensity at 0 sec at Gurgaon |
 | Figure 11. UHS for return period 475 years at Bhiwani |
 | Figure 12. Hazard curve for intensity at 0 sec at Bhiwani |
 | Figure 13. UHS for return period 475 years at Alwar |
 | Figure 14. Hazard curve for intensity at 0 sec at Alwar |
 | Figure 15. UHS for return period 475 years at Bulandshahr |
 | Figure 16. Hazard curve for intensity at 0 sec at Bulandshahr |
9. Conclusions
From the results of the seismic hazard maps (Figs 5 & 6) and seismic hazard curves (Figs 7-16) it is advocated that the eastern part of the National Capital Region (NCR) has the highest value of seismic hazard. However, the ground motion parameters (PGA and spectral acceleration) decrease from south eastern region to western region. Spectral accelerations have maximum values for period ranging between 0.1-0.3 sec. Hence while designing buildings or any engineering structure in the eastern zone which is the most vulnerable area, the designer should take care for the time period of the structure to minimize the damaging effect of earthquake. If the time periods of the structures match with the time periods of ground motion at that site, resonance will occur and structures will suffer maximum damage. Further, in construction industries, other design aspects like design lives of a structure are also be based on the rate of exceedance of PGA obtained for various sites. So, the Risk targeted design of structures can be utilized in this region where the range of earthquake moment magnitudes is 4 to 5. In this case, designer should do the fragility analysis of a structure based on the seismic hazard curves obtained from PSHA of that particular site. This design method will not only reduce the probability of hazard level but also proved economical.
ACKNOWLEDGEMENTS
This is a part of the M. Tech thesis work. First author is indebted to head, Department of Earthquake Engineering, Indian Institute of Technology Roorkee, Roorkee for providing excellent computational facilities. Financial support provided as studentship by MHRD during the completion of the thesis work is gratefully acknowledged.
References
| [1] | Abrahamson, N.A. and W.J. Silva, 1997, Empirical response spectral attenuation relations for shallow crustal earthquakes, Seismological Research Letters, 68(1), 94-127. |
| [2] | Gardner, J.K. and Knopoff, L., 1974, Is the sequence of earthquake in southern California, with aftershocks removed, Poissonian?, Bulletin of the Seismological Society of America, Vol. 64, no. 5, pp. 1363-1367. |
| [3] | Gutenberg, B. and Richter, C.F., 1954, Seismicity of the earth and the associated phenomena, Princeton University Press, New Jersey. |
| [4] | Indian Meteorological Department, 2016, A report on seismic hazard microzonation of NCT Delhi on 1:10000 scale, Ministry of Earth Sciences, Government of India pp 414. |
| [5] | Iyengar, R.N., 1999, Earthquakes in ancient India, Current Science, Vol 77, pp. 827-829. |
| [6] | Iyengar, R.N. and Raghukanth, 2004, Attenuation of strong ground motion in Peninsular India, S.T.G. (2004), Seismological Research Letters, Vol. 75, No. 4, pp. 530-540. |
| [7] | Kijko A. and Sellevoll M.A., 1989, Estimation of earthquake hazard parameters from incomplete data file. Part I. Utilization of extreme and complete catalogs with different threshold magnitudes. Bull. Seism. Soc. Am., 79, 645-654. |
| [8] | Kijko, A. and Sellevoll, M.A., 1992, Estimation of earthquake hazard parameters from incomplete data files, Part III Incorporation of magnitude heterogeneity, Bull. Seism. Soc. Am., 82, 120-134. |
| [9] | Musson, R. M. W. (2003), Fatalities in British earthquakes. Astronomy & Geophysics, 44: 1.14–1.16. doi:10.1046/j.1468-4004.2003.44114.x. |
| [10] | Reasenberg, P.A., 1985, Second-order moment of central California seismicity, 1969-1982, J. Geophys. Res. 90, 5479-5495. |
| [11] | Sharma, M.L. and Wason, H.R., 2004. Estimation of seismic hazard and seismic zonation at bed rock level for Delhi region, India, Paper no. 2046. |
| [12] | Sharma, M.L., 1998, Attenuation relationship for estimation of peak ground horizontal acceleration using data from strong motion arrays in India, Bull. Seis. Soc. Am., Vol. 88, No. 4 1063-1069. |
| [13] | Stepp, J.C., 1972, Analysis of completeness of the earthquake sample in the Puget Sound Area and its effect on statistical estimates of earthquake hazard, Proceedings of the International Conference on Microzonation, Settle, U.S.A., Vol. 2, pp. 897-910. |
| [14] | Youngs, R.R., Chion, S.J., Silva, W.J. and Humphrey, J.R., 1997, trong ground motion Attenuation Relationships for Subduction zone earthquakes, Seismological Research Letters, Vol. 68, No. 1, 58-73. |

 Abstract
 Reference
 Full-Text PDF
 Full-text HTML