-
Paper Information
- Paper Submission
-
Journal Information
- About This Journal
- Editorial Board
- Current Issue
- Archive
- Author Guidelines
- Contact Us
Geosciences
p-ISSN: 2163-1697 e-ISSN: 2163-1719
2017; 7(3): 95-107
doi:10.5923/j.geo.20170703.02

Re-evaluation of Sedimentary Thickness and Curie Point Depth (CPD) of Parts of Lower Benue Trough and Anambra Basin, Nigeria, Using Regional Magnetic Field Data
 Abstract
 Reference
 Full-Text PDF
 Full-text HTML
Bello R., Ofoha C. C., Wehiuzo N.
Department of Physics, University of Port Harcourt, Nigeria
Correspondence to: Bello R., Department of Physics, University of Port Harcourt, Nigeria.
| Email: |  |
Copyright © 2017 Scientific & Academic Publishing. All Rights Reserved.
This work is licensed under the Creative Commons Attribution International License (CC BY).
http://creativecommons.org/licenses/by/4.0/

Spectral depth analysis has proven to be a veritable tool in characterizing the basement morphology. In an attempt to estimate the sedimentary thickness and the Curie Point Depth (CPD), several researches have been carried out. This study therefore re-appraised the sedimentary thickness and the Curie Point Depth (CPD) of parts of lower Benue trough and Anambra basin using spectral analysis of a high resolution aeromagnetic data covering the study area. For effective data analysis, processing and interpretation, the WingLink, ArcGIS softwares were used for qualitative interpretation while the MS excel, Surfer 10 and Origin Pro 8 Geophysical software’s were used for quantitative interpretation. The data was processed and converted in a format usable by the WingLink visualization software with the aid of the ArcGIS. The digitization was done in grid of 1 km x 1 km spacing and values of the total magnetic intensity, TMI, X (latitude) and Y (longitude) were picked at the intersection of the grid nodes. Regional-residual separation was applied on the TMI map which gave rise to the regional and residual maps. The gridding of the residual into sixteen overlapping grids was undertaken and then Fast Fourier Transform (FFT) performed on each of the grids or windows. The FFT decomposed the anomalies into its energy and frequency components and thereafter Log of energy spectrum against frequency was plotted. A straight line which aided in determining the depth models is visually fitted into the high and low frequency component of the energy curve. This research identified and proposed three depth source models, Zt, Zc, Zb. The depth due to the deep seated anomalous sources or the centriod depth (Zc) varies from 7.7 km to 12.0 km. On the other hand, the depth due to the shallow bodies or due to the top boundary of magnetic sources ranges between 0.5 km m to 3.1 km while the corresponding CPD ranges from 14.9 km to 23.0 km. The true or average depths for each of the respective windows were calculated and this varies between 4.1 km and 6.1 km. Generally, a true depth of 5.7 km was ascertained within the study area. However, the depth value of 5.7 km suggests relative sedimentary thickness within the study area.
Keywords: Cenroid depth, FFT, True depth, CPD, HRAM, Basal depth, ArcGIS
Cite this paper: Bello R., Ofoha C. C., Wehiuzo N., Re-evaluation of Sedimentary Thickness and Curie Point Depth (CPD) of Parts of Lower Benue Trough and Anambra Basin, Nigeria, Using Regional Magnetic Field Data, Geosciences, Vol. 7 No. 3, 2017, pp. 95-107. doi: 10.5923/j.geo.20170703.02.
Article Outline
1. Introduction
- Aeromagnetic technique is one of the forms of magnetic survey in which a magnetometer is towed behind an aircraft. Other forms of magnetic survey include that performed on land called the land survey and that performed in the sea called the marine survey. The magnetometer records the anomalies found within the earth’s surface. However, these anomalies are mostly due to the local subsurface geology. The susceptibility is the primary measurement in magnetic survey per se. According to John and Emmanuel (2014), the total magnetic intensity (TMI) often shown on aeromagnetic maps is a measure of total magnetization of magnetic minerals in rocks. The two components of total magnetization are the induced and the remnant magnetizations, the vector sum of both gives total magnetization. The total magnetization of rocks is determined by not just the quantity and composition but also by the grain particles of the magnetic minerals and the processes that produced the remnant magnetization carried by the minerals.In determining the sedimentary thickness, aeromagnetic data has proven to be apt. Several researchers including Ugwu et. al., (2012), Oha et. al. (2016), Abdullahi et. al., (2014), Onyewuchi (2011), David and Marius (2013), Jatau and Nandom (2013), Onuba et. al., (2013), Opara et. al., (2015) have exploited aeromagnetic data to estimate the sedimentary thickness within the respective areas of their studies. Despite being used in delineating architectural framework of the earth’s subsurface geology, the aeromagnetic method, can be applied successfully in Curie Point Depth (CPD) of an area via spectral analysis. To determine the Curie Point Depths (CPD) which is known as the magnetized rock bottom depth, the aeromagnetic data need to be analyzed using spectral analysis. Ibrahim et. al., (2005) apparently stated that many authors like Connard et. al., (1983) and Tanaka et. al., (1999), used aeromagnetic studies to delineate the CPD of magnetic bodies by applying various techniques. The thermal framework of the crust can as well be investigated via aeromagnetic data using the CPD. Elleta and Udensi (2012), nevertheless, defined CPD as “the point in the crust of the earth having particles that produces obvious signatures in an anomalous aeromagnetic map. In other words, the further the depth, the material changes from a ferromagnetic material to a paramagnetic one. The study area is noted because of the presence of minerals. Onyewuchi (2011) pointed out that, generally, the lower Benue trough shares the same geological and structural evolution of the Benue trough. Benue trough is a northeast-southwest trending system. He further explained that the development of the area can be correlated with the separation of Africa from South America and that the Benue trough is based on lead-zinc mineralization, limestone deposits, coal deposits, coal deposits, pyroclastics, brine spring and brine lake. But recently, geologists and indeed geophysicists, proclaimed the fact that the Benue trough on the average is becoming more yielding in terms of hydrocarbon exploration. Based on this premise, there are reports that the federal government of Nigeria has directed the immediate exploration and utilization of the hydrocarbon viability of the lower Benue trough, hence the need to venture into this work. This research will therefore determine the average sedimentary thickness and the depth at which the causative magnetic sources within the study area lose their ferromagnetic properties.
1.1. Location and Geologic Settings of the Study Area
- The study area is located in Enugu state and parts of Anambra state, south-east Nigeria. The coordinates are Latitude 6°00’- 6°30’N and Longitude 7°00’- 7°30’E. The study area falls within the Lower Benue Trough and parts of Anambra basin. Umeanoh (2015) pointed out that the Benue Trough generally has been subdivided into three: the Upper Benue Trough at the NE Nigeria, the Middle Benue Trough and the Lower Benue Trough. The Lower Benue Trough has somewhat developed different tectonic history resulting in the formation of the Anambra Basin to the west and Abakaliki Anticlinorium to the east. The Anambra Basin remained a stable platform supplying sediments to the Abakaliki depression during a period of spasmodic phase of platform subsidence in the Turonian. Following the flextural inversion of the Abakaliki area during the Santonian uplift and folding, then the Anambra Basin was initiated. Four Cretaceous depositional cycles where recognized in the Lower Benue and each of these was associated with the transgression and regression of the sea (Murat, 1972). The opening of the Atlantic Ocean in the Middle Albian to Upper Albian gave rise to the transgression of the first sedimentary cycle. The Asu River group which consist predominantly sandstone and shale was deposited at this time. Between the Upper Cenomanian and Middle Turonian, the second sedimentary deposition of the Ezeaku Shale occurred. The third sedimentary circle occurred from Upper Turonian to the Lower Santonian leading to deposition of the Awgu Shale and Agbani Sandstone. The fourth and final depositional phase took place during the Campanian-Maastrichtian transgression. It was at this time that the Nkporo Shale, Owelli Sandstones, Afikpo Sandstone, Enugu Shale as well as the coal measures including the Mamu Formation, Ajali Sandstone and Nsukka Formation was deposited (Murat, 1972). Fig.1 shows the study area and the regional geology of the Lower Benue trough. The geological map (Fig 2) of the study was extracted from the regional geologic map and redigitized using the Arc GIS software for enhanced interpretation of the aeromagnetic map. Visually inspecting the map shows five main formations within the study area. These include: Nkporo Shale Formation, Mamu Formation, Ajali Formation, Nsukka Formation and Ameki Formation. The ages of the formations range from Maastrichtian to Campanian and to Eocene (Ameki formation).
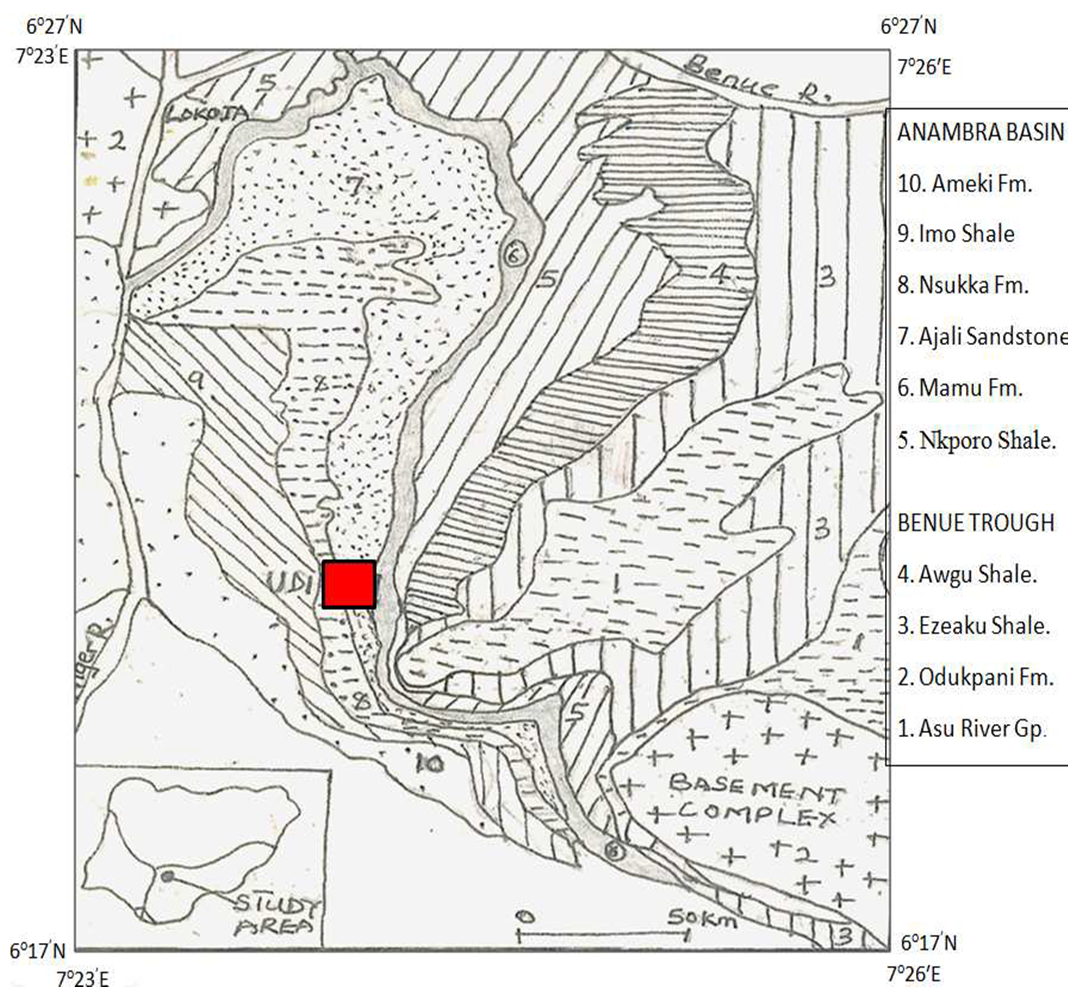 | Figure 1. Regional Geology of the Lower Benue Trough showing the study area |
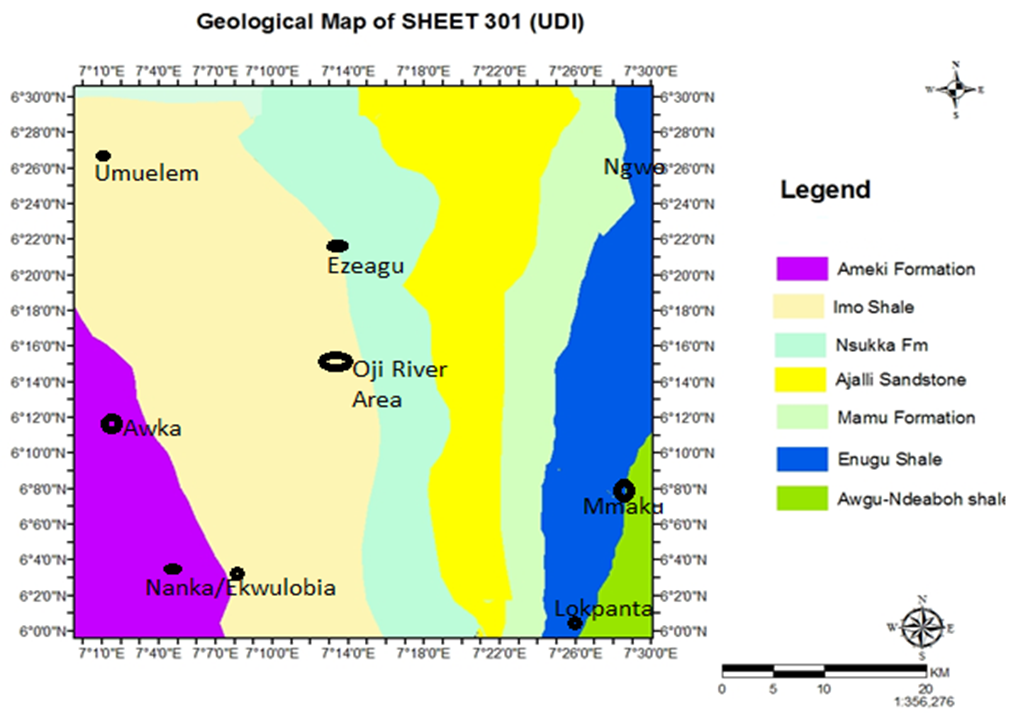 | Figure 2. Geological map of the study area |
2. Materials and Methods
- A digitized High Resolution Aeromagnetic (HRAM) data obtained by Fugro Airborn Service on behalf of the Nigerian Geological Survey Agency (NGSA) in 2009 was used for this study. The Total Magnetic Intensity (TMI) data with sheet number 301 was obtained in comma separated variable (CSV) format and in half degree sheet. A raster map (Fig 3) was produced from the aeromagnetic data obtained in CSV format. Survey parameters involving flight line spacing of 500 meters, 100 m terrain clearance, tie line spacing of 2 km and flight line direction of NE-SW were initiated while the data was obtained. The Arc GIS, Winglink, Sulfer 10, Ms Excel, Origin Pro 8 software’s were employed for the study. The Arc GIS software was used to convert the data in a format the WingLink can recognize. Thereafter the data imported into the WingLink software environment and the raster map produced. The raster map was transformed into its contour format (Fig 3 a). Upon the contour map, regional-residual separation was carried out. The separation gave rise to the residual and regional maps (Fig 3 b, Fig 3 c and Fig 3 d respectively). In order to estimate the sedimentary thickness, or the depth parameter, windowing of the contour map became vital. This was thus carried out with the aid of Ms Excel software via band pass filtering. This art created overlapping spectral windows or grids upon which Fast Fourier Transform (FFT) was performed. The FFT decomposed each of the windows into its energy and frequency components. As a result, the radial average energy (power) spectrum was plotted in Ms Excel using Excel chart wizard as Log of Energy (FFT magnitude) versus radial frequency in Rad/km. The various plots for each of the windows gave rise to the spectral energy curves or graphs shown below (Fig 3 e). Then a straight line is visually fit into the high and low frequency parts of the energy curve. The depth to basement or the sedimentary thickness is determined by dividing the negative slope of the low frequency parts of the energy curve by two (2), that is, the slope of the steepest energy curve was estimated for each of the graphs and thereafter the values obtained divided by two. These values represent the sedimentary thickness. Similarly, the slopes of each of the less steep energy curves determined and the values divided by two. Depth values estimated from the steepest energy curve is due to the low frequency components while the depth values associated with the less steep energy curve is due to the high frequency components. This process known as the spectral depth analysis continues until all the windows must have had their depth determined. Depth values at the center of each windows or grids were determined. The average values or the depth values at the center were obtained by summing the depth values due to the low and high frequency components and then dividing by two. In this research, the Curie Point Depths (CPD) were obtained by assuming depth values due to the low frequency components as the depth to centroid (Zc) while the depth values due to the high frequency components were taken to be the depth due to the top boundary of magnetic sources (Zt ). The ZC and ZT calculated then lead to the calculation of the basal depth Zb using equation 1 and this is assumed by Kasidi and Nur, (2012) and Okubo et al. (1985) as the CPD.
 | (1) |
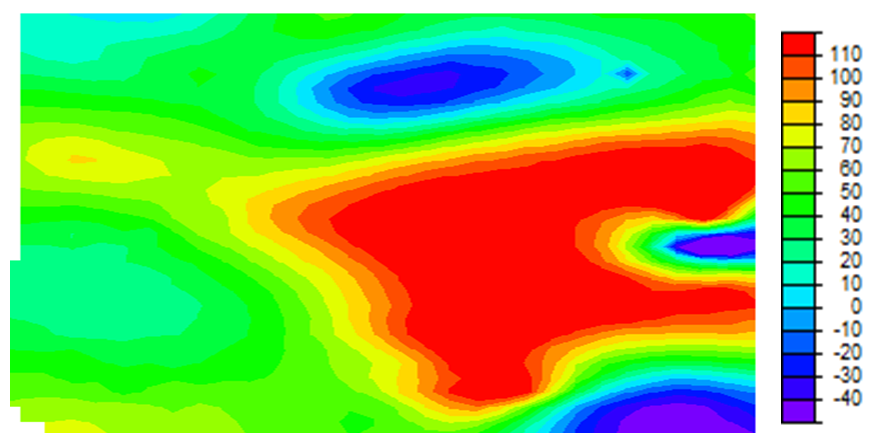 | Figure 3. Aeromagnetic raster map of the study area (nT) |
 | Figure 3a. Total magnetic intensity contour map of the study area (nT) |
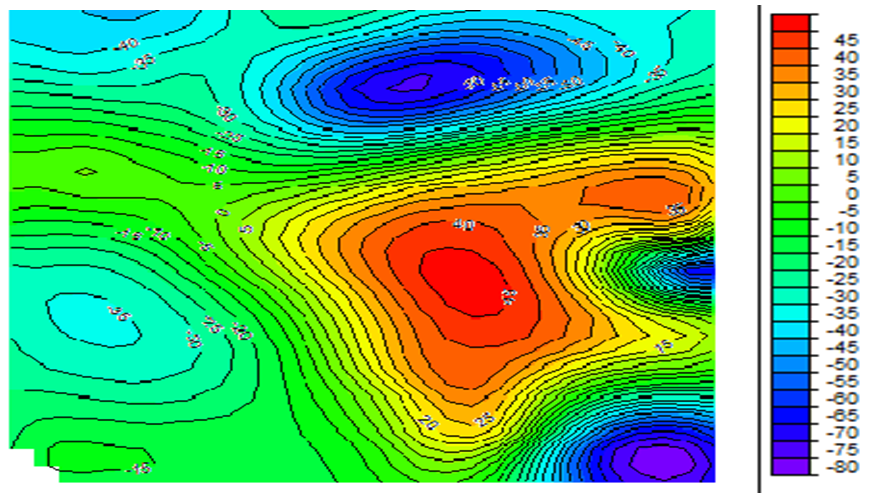 | Figure 3b. The residual map of degree one (nT) |
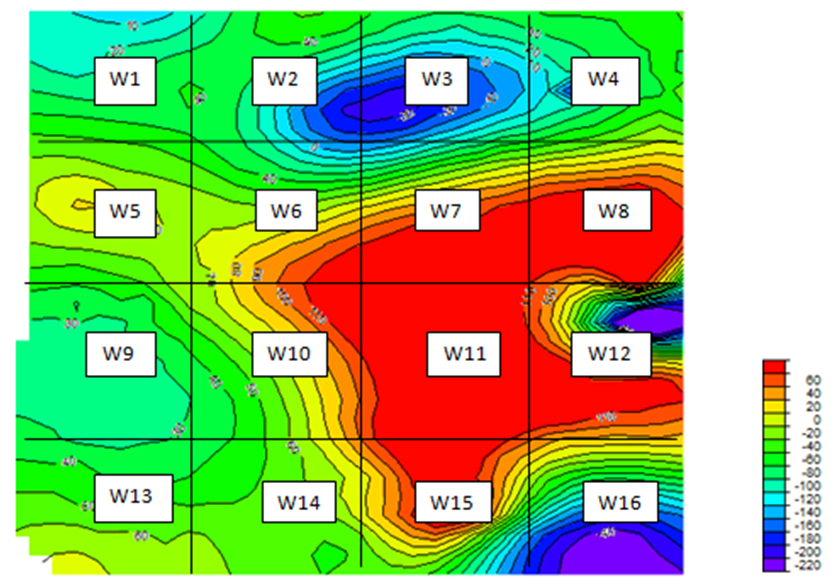 | Figure 3c. Sixteen (16) overlapping windows for CPD determination via spectral analysis |
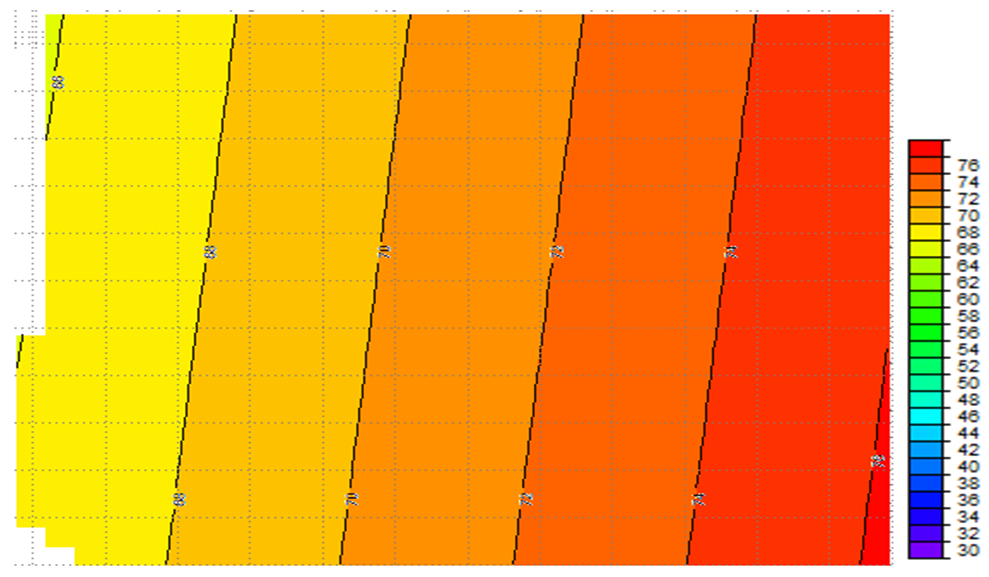 | Figure 3d. The regional map (nT) |
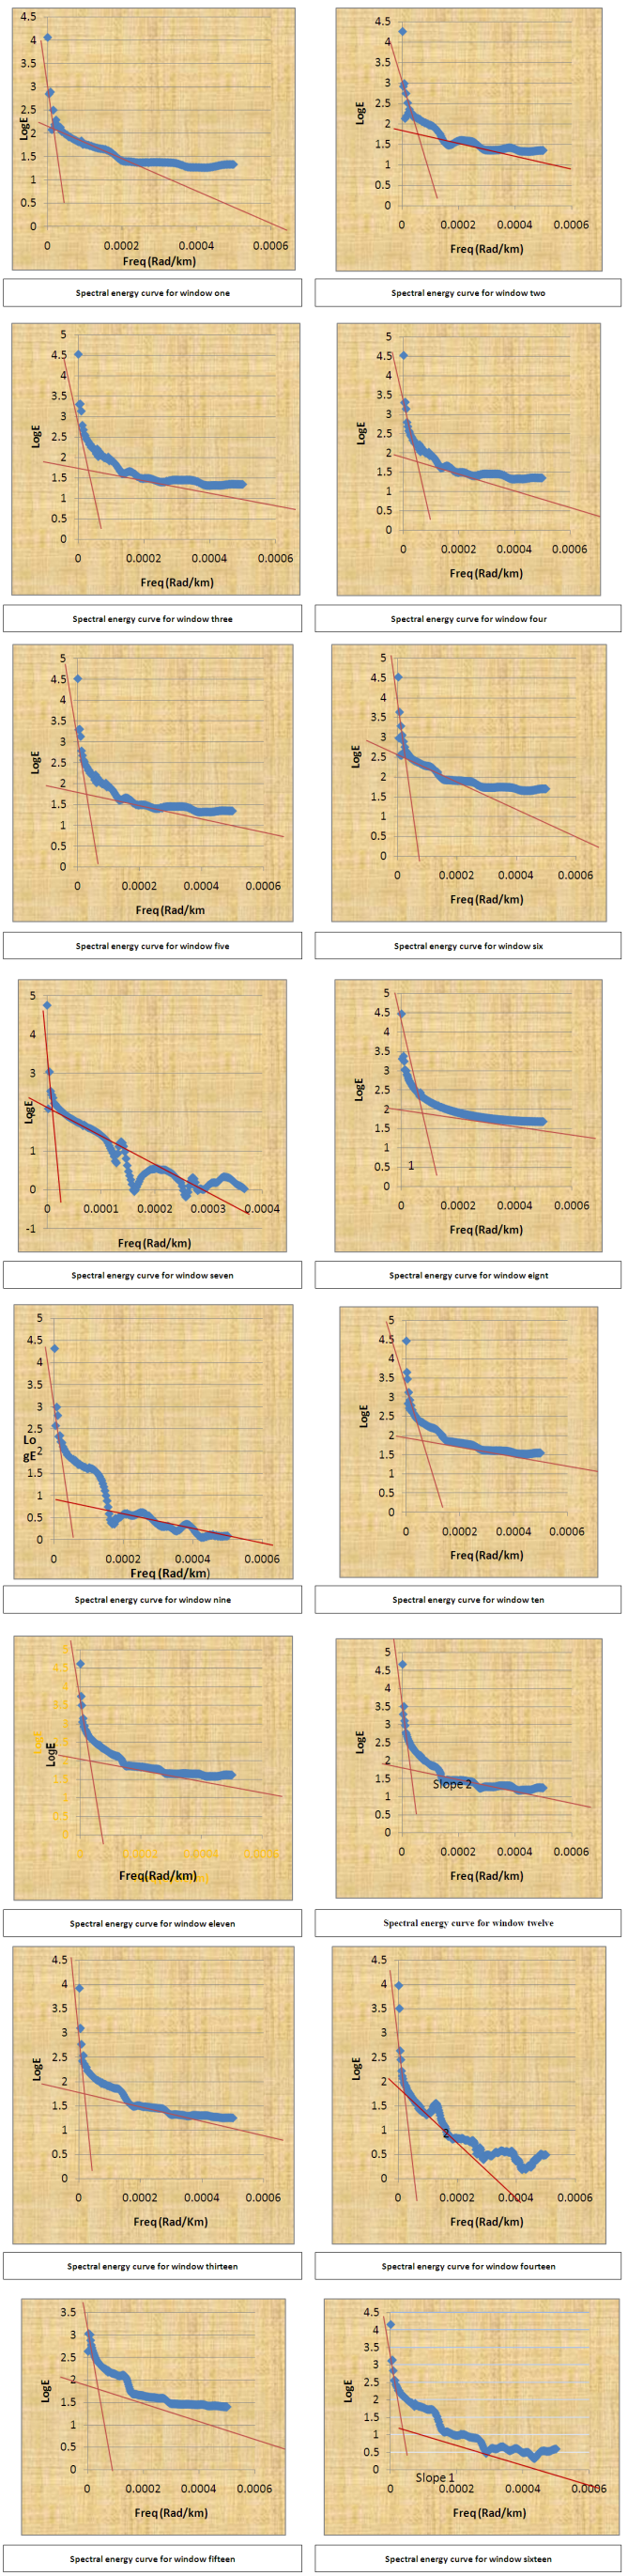 | Figure 3e. Graphs illustrating spectral depth analysis performed on each window or grid |
3. Results and Interpretation
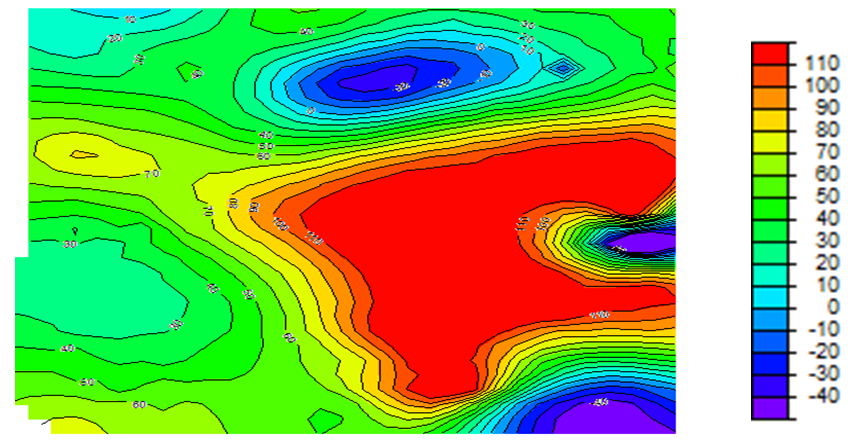
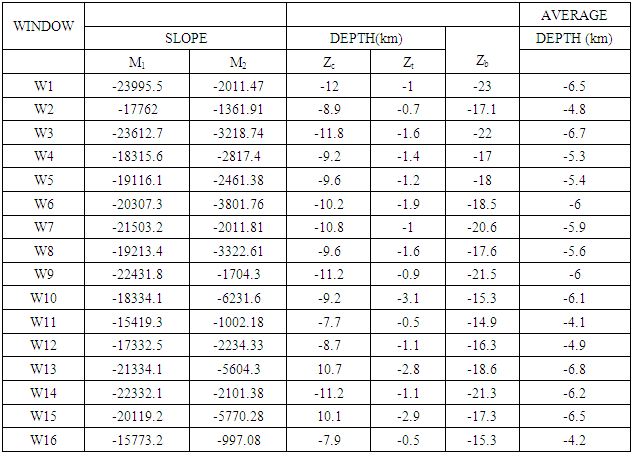
- Fig 3 a is the contour format of Fig 3. On Fig 3 a, regional-residual separation was undertaken and this generated the residual map (Fig 3 b and Fig 3 c) and the regional map (Fig 3 d). Qualitatively, the raster map shows colour variations illustrating magnetic field changes within the study area. Apparent on the contour and residual maps are contours of various configurations. However, colour contrasts are obvious on the contour and residual map. The regional map depicts an elongated regional trend. The graphs showing plots of Log E against frequency are aftermath of the spectral analysis performed on each of the overlapping windows. The slopes of the graphs are negative slopes; hence the corresponding depth values are all negative values. Using the graphs, Fig 3 e, table 1 was generated. Table 1 is a summary of the sedimentary thickness and the CPD obtained. Zc and Zt represent depth to centroid and to the top of magnetic sources, respectively while Zb is the basal depth. At the basal depth, the magnetic sources lose their ferromagnetic properties. Nevertheless, Zc denotes the depth values obtained due to the deep seated magnetic sources while Zt is the depth values of shallow magnetic sources. Maximum depth of 12 km, for the deeply seated sources was obtained but with an average depth of 6.5 km while a minimum depth of 0.5 km was determined for the shallow related features.
|
4. Discussion of Findings
- Obvious on the raster map are colour differences ranging from red, yellow, green, light blue, blue and the mangenta. These colour variations are true reflection of magnetic field changes that occurred within the area. The magnetic field changes result from the presence of distinct lithology, basement topography, susceptibility contrast or geologic boundary. The raster map aids an interpreter to section an area into various magnetic zones or units. For this study, the area was partitioned or sectioned into three magnetic zones of high, intermediate and low. The red and yellow colours represent the magnetic high while the green and light blue, blue, magenta colours exemplify intermediate and low magnetic units respectively. Beside the raster map is a legend showing the magnetic intensity values for each of the magnetic zones. The magnetic high have values which falls between 70 nT and 110 nT. Intermediate magnetic units have values ranging from 20 nT to 60 nT while the magnetic low ranges from -40 nT to -10 nT. The yellow and red colours show possible igneous intrusive or Precambrian basement rocks like older granites and migmatites whereas the green colour shows probable granitic rocks and the inscribed magenta showing the superposition of magnetic units. The light blue and blue colours, according to Gunn et. al., (1997) highlight zones made up of irregular weathering of magnetic units and assemblage of non magnetic units respectively. The contoured Total Magnetic Intensity (TMI) map shows various degrees of contours. Contours that are almost closed, closed, smooth, broadened, parallel, elliptical, irregular and localized are obvious on the TMI contour map. The TMI map however consists of long wavelength regional anomalies. Super imposed on the regional are the short wavelength residuals. The residuals are of primary in importance as they may provide evidence of the existence of mineral ore bodies or reservoir type sedimentary structures. To effectively characterize the sedimentary thickness, regional-residual separation was carried out. This art gave rise to the regional and residual maps. No attention was given to the regional as it is geologically insignificant. This necessitated the research interpretation to be based on the residual. Relatively closed magnetic signatures that are more or less circular, parallel, broadened or localized are conspicuous on the TMI map. The magnetic field intensity values of the map ranges from -80 nT to 45 nT. Signatures that are attenuated can be seen running from the central portion of the map to the eastern part. Geologically, the central portion of the map lies within the Oji Rivers settlement. East of the Oji Rivers settlement are the Enugu shale, Mamu Formation, Agwu Ndeaboh shale, Ajali sandstone while west of the Oji Rivers settlement are the Ameki Formation and the Imo shale. The magnetic low contours occurring at the northern, eastern, south eastern and western portion fall within the Umuelem, Ngwo, Mmaku, Lokpanta, Nanak Ekwulobia and Awka province. These magnetically low regions are underlain by the Ajali sandstone, Nsukka Formation, Enugu shale and the Ameki Formation. Planar NNE-SSW tectonic trend can be seen manifesting on the Regional map. The NNE-SSW trend in conjunction with the NE-SW, NW-SE trends are conceived to be Pan African trends by Anudu et. al., (2012). On the residuals, quantitative analysis is then carried out.Quantitatively, three (3) source depth models, Zc, Zt, and Zb were identified and thus proposed. Graphs of the spectral energies revealed that the depth due to the deep seated anomalous sources or the centriod depth (Zc) varies from 7.7 km to 12.0 km. Conversely, the depth due to the shallow bodies or due to the top boundary of magnetic sources ranges between 0.5 km m to 3.1 km while the corresponding CPD ranges from 14.9 km to 23.0 km. The true or average depths for each of the respective windows were calculated and this varies between 4.1 km and 6.1 km. Generally, a true depth of 5.7 km was ascertained within the study area. The depth value of 5.7 km suggests relative sedimentary thickness. These results compares favourably with the result obtained by Umeanoh (2015) within the lower Benue trough. Although with information on the crustal temperature missing in his work, Umeanoh (2015) obtained the depths due to the deep seated sources to range from 7.2 km to 13.0 km while the depths values for the shallow sources varies from 0.4 km to 3.9 km, but on the average, he obtained a true depth of 7 km. Onwuemesi (1996), within parts of lower Benue trough, obtained the true thickness to be around 5.6 km. His result is not a far cry from what was obtained for this study. Also, the results ascertained by Nur et. al., (1999) were not in much variance with what was obtained for this work. They obtained the CPD to vary from 23.80 km to 28.70 km. Shallower CPD can be seen towards the southeastern portion of the study area and this falls within the Oji river settlement province perceived to be the crystalline basement area . Kasidi and Nur (2013) enunciated that this is a reflection of the thinning of the crust under Benue rift. They further stated that the basement area is as a result of the upwelling of magma on Cameroon Volcanic Line (CVL) during the tertiary period.
5. Conclusions
- This study proposed three depth source models, namely depth to centroid, Zc, the basal (or CPD) depth, Zb, and the depth due to the top of magnetic sources, Zt. The depth due to the deep seated anomalous sources or the centriod depth (Zc) varies from 7.7 km to 12.0 km while the basal depth lies between 14.9 km and 23.0 km. Similarly, the depth due to the shallow bodies or due to the top boundary of magnetic sources ranges between 0.5 km m and 3.1 km. The sedimentary thickness established in this work, shows that the study area holds a promise for hydrocarbon exploration. Therefore, to reduce the ambiguity problem that accompanies potential field interpretation, the need for researchers to run seismic sections within the area.