-
Paper Information
- Paper Submission
-
Journal Information
- About This Journal
- Editorial Board
- Current Issue
- Archive
- Author Guidelines
- Contact Us
Geosciences
p-ISSN: 2163-1697 e-ISSN: 2163-1719
2017; 7(3): 89-94
doi:10.5923/j.geo.20170703.01

Spatial-Temporal Distribution of the Lightning Strokes in Kazakhstan for Year 2016 Based on WWLLN Data
 Abstract
 Reference
 Full-Text PDF
 Full-text HTML
Alexandr Inchin, Yuriy Shpadi, Anatoliy Lozbin, Maxim Shpadi, Pavel Inchin
Scientific Space Systems Laboratory, Institute of Space Techniques and Technologies, Almaty, Republic of Kazakhstan
Correspondence to: Anatoliy Lozbin, Scientific Space Systems Laboratory, Institute of Space Techniques and Technologies, Almaty, Republic of Kazakhstan.
| Email: |  |
Copyright © 2017 Scientific & Academic Publishing. All Rights Reserved.
This work is licensed under the Creative Commons Attribution International License (CC BY).
http://creativecommons.org/licenses/by/4.0/

In this article, for the first time the initial study of spatial-temporal distribution of lightning discharges on the territory of Kazakhstan based on Worldwide Lightning Location Network (WWLLN) data was done. The results of monthly, daily and hourly temporary distribution of lightning activity are obtained. Density distribution of the lightning, durations of thunderstorms, spatial development of lightning activity are presented. WWLLN efficiency for the Kazakhstan area is discussed. The research was executed within the framework of Creation of Kazakhstan Lightning Detection Network project.
Keywords: Lightning, Thunderstorm, Lightning detection network, Spatial-temporal distribution, Lightning density
Cite this paper: Alexandr Inchin, Yuriy Shpadi, Anatoliy Lozbin, Maxim Shpadi, Pavel Inchin, Spatial-Temporal Distribution of the Lightning Strokes in Kazakhstan for Year 2016 Based on WWLLN Data, Geosciences, Vol. 7 No. 3, 2017, pp. 89-94. doi: 10.5923/j.geo.20170703.01.
Article Outline
1. Introduction
- Specialists in many areas face the problem of lightning protection and assessment of spatial distribution of lightning discharges. The number of high buildings and site development increases; combustible and explosive substances are widely used in the industry; sensitive electronic devices which react to the interferences caused by lightning discharges are using more and more often in electronics and communication. As a result, damages, caused by lightning discharges, business interruption might take place and in some cases can be fatal.In many countries, including Kazakhstan, main source of lightning information is still visual and aural observations provided by meteorological stations and temporal instrumental observations (e.g. at the airports). Nowadays, there are 328 meteorological stations in Kazakhstan. Visual and aural method of lightning activity detection allows to determine lightning in ~15 km radius. Thus, observations at one station allow to cover ~ 707 km2 area and 328 stations can provide information about lightning activity for ~232000 km2 (8,5% of the country area). The majority of stations are placed in inhabited regions of the country, however spatial-temporal distribution of lightning is important not only for safety, but for science. For instance, there is hypothesis that irregularity of lightning distribution might be caused by different conductivity of various rocks lithotypes [1-3] and it’s possible to use lightning data for natural resources locating [4].Moreover, detailed maps of spatial-temporal distribution of lightning discharges is necessary for assessment of lightning protection actions for power industry objects. Lightning discharge signatures are necessary for calculations of inductive voltage on power transmission lines, devices of grounding, relay repeaters. Large area of Kazakhstan is not covered by lightning observations stations; it is necessary to develop methods of lightning harmfulness estimation not only at the qualitative level.The purpose of the this research is to provide spatial-temporal distribution of lightning discharges for Kazakhstan based on data from global scientific network of the electromagnetic sensors for lightning discharges disturbances in the low-frequency range detection.The results are based on lightning events data collection, processing and visualization during the lightning period – from March to October, 2016.
2. Data and Methods
- The basic data for this study is a number of lightning discharges received by ground lightning location system WWLLN (Worldwide Lightning Location Network). Method of positioning of lightning is based on distance determination to lightning discharge using a difference in time of signal arrival to remote antennas (the TOGA method – time of group arrival) [5]. Data from at least 5 stations is required. Stations can be located at distance of thousands kilometers from lightning discharge. Nowadays the network contains 70 stations worldwide and the last researches according the worldwide average efficiency of 30 kA current rate lightning detection is about 30%. It should be noted, that the efficiency of network is based on the number of the detected lightning discharges relatively to their total number.Since 2015, Kazakhstan Lightning Detection Network (KazLDN) has been developing by the Institute of Space Techniques and Technologies [6]. In the framework of the project for monitoring of thunderstorms in East-South region of Kazakhstan the distributed network of sensors for near-surface electromagnetic field strength measuring is developed. Very-low frequencies (3-300 kHz) electromagnetic field disturbances data is collected from sensors and stored in database on the KazLDN server.From 2016, WWLLN data is also collected to the KazLDN server for further comparison of the results of lightning discharge location determination. WWLLN provides an open access to data for 1 hour with 6 hours delay in *.kml file format through project website (wwlln.net). The script for hourly automatic data readout from WWLLN server was developed. 40°-56°N and 46°-88°E area was chosen for data selection. Discharge time (to the minutes accuracy), location (longitude and latitude), a residual (in microseconds, 1 μs ~ 0,3km) and the number of registered stations (not less than 5) are stored for every lightning discharge detected by WWLLN.Selection of data by days, months and for whole lightning season from March to October, 2016 for the analysis of lightning activity in the territory of Kazakhstan was done.Density of lightning discharge and lightning hours falling on a spherical rectangle with a length on a meridian and latitude in 1° were extracted. SURFER software was used for visual representation of the results (http://www.goldensoftware.com/products/surfer).
3. Results and Discussion
- By the technique described above, necessary data was selected and following results are received.In total, in March - October, 2016 on the territory of the Republic (40°-56° N, 46°-88° E) 1,151,001 events by WWLLN network were detected. We consider every single lightning discharge as an event. The histogram of distribution of lightning discharges by months for the specified period is shown on Figure 1.
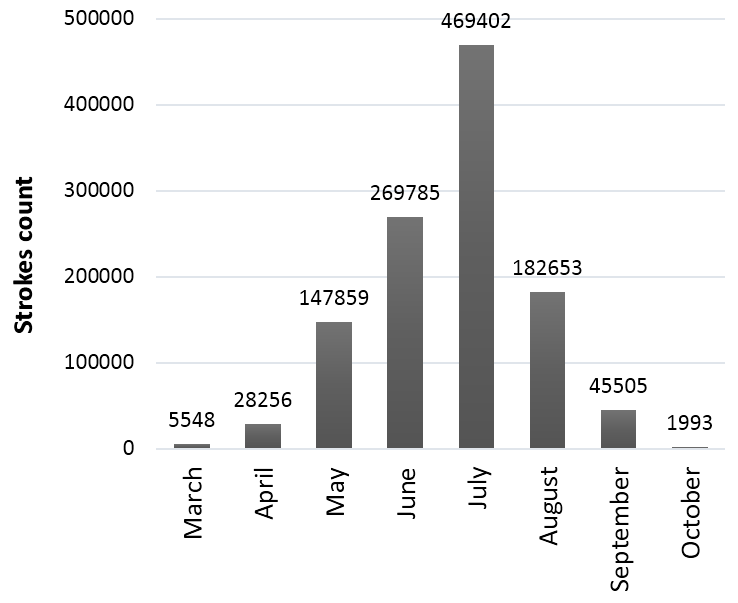 | Figure 1. The chart of lightning discharges distribution from March till October |
3.1. Monthly Lightning Activity
- Plots by months of lightning activity distribution (Figure 2) are obtained. Daily number of strokes in May was 3 000 – 5 000, except for the last days of month when this number exceeded 25 000. In June daily average number of strokes was ~10 000 and 15 000 in July. In March, April and October lightning activity had generally incidental character. 2 days in May (30 and 31) and several days in July (6 and 7, 25 and 26) were the strongest storm days throughout the whole year. There were more than 24 000 lightning discharges per each day.
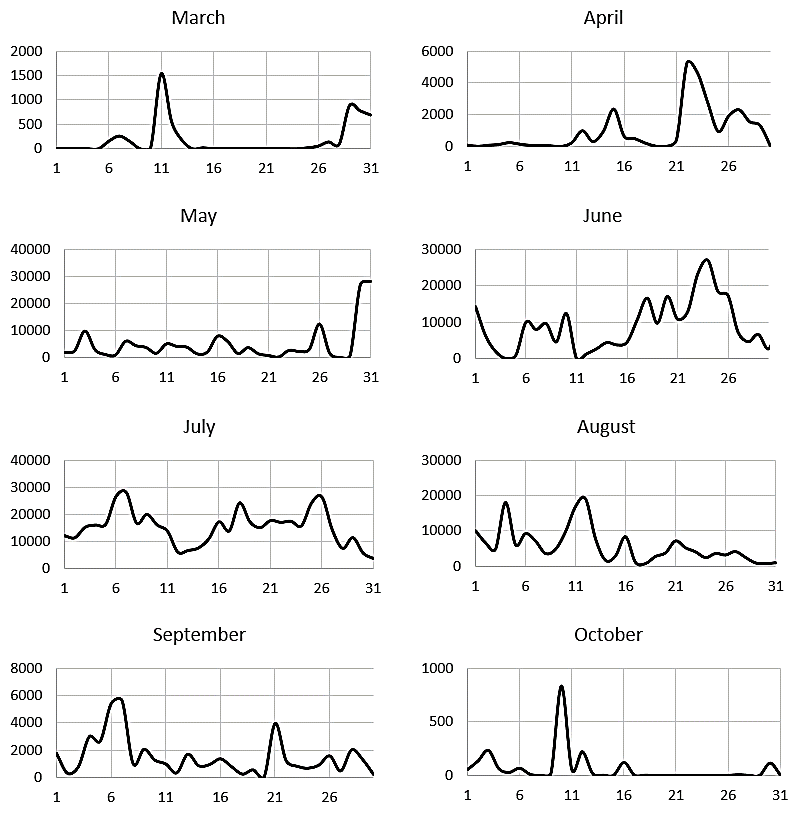 | Figure 2. Monthly graphs of lightning activity |
3.2. Daily Lightning Activity
- It is known that lightning activity during the day is nonuniform, therefore the number of strokes distribution depending on time is of interest. Kazakhstan has 2 time zones +6 UTC (Center and East of the country) and +5 UTC (West of the Republic). In order to assess a common tendency we neglected this difference. In Figure 3, plots of daily thunderstorm activity for two cases with most strokes are shown. In Figure 3a the number of strokes depending on time of day (local time) from May 30 to June 1, and in the Figure 3b – from July 6 to July 8 are presented. Notice, that in both cases low lightning activity was during 8-9 AM and at midnight. High lightning activity with a maximum at 1-3 PM was observed afternoon.
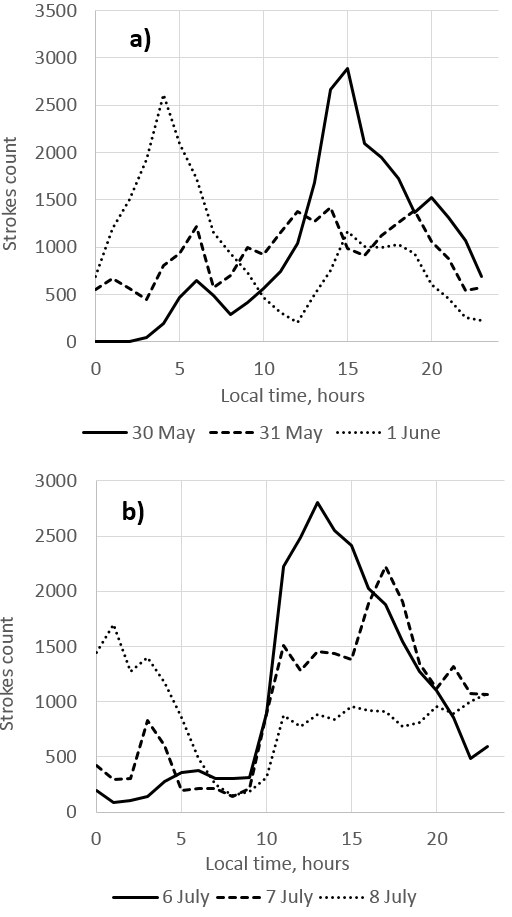 | Figure 3. Daily lightning activity for May 30 – June 1 (a), and July 6-8 (b) |
3.3. Lightning Activity Spatial Distribution
- As it was mentioned previously, study of lightning activity on Kazakhstan area was limited in coordinates 40°-56° N and 46° - 88°E. For this area the latitudinal and longitudinal distribution of lightning activity (Figure 4) are presented.From Figure 4(a) it can be seen that the minimum of lightning activity is within 43-45°N latitude. Supposedly, it is caused by the fact that the area at these latitudes is mostly desert lands of the South of Kazakhstan and Uzbekistan. 47°-51°N latitudes are on mainly territory of Kazakhstan. Here, annual lightning activity had about 95 000 strokes a year on whole longitude. As for longitudinal distribution, here we see a minimum on 64°E. This is because of the droughty and desert regions here. Furthermore, there is a stable increase of the lightning activity with longitude and local maximum on the 72°E. It is connected with the fact, that in the south of the country are mountainous areas and Kazakh Upland in the central part of the country on this longitude.
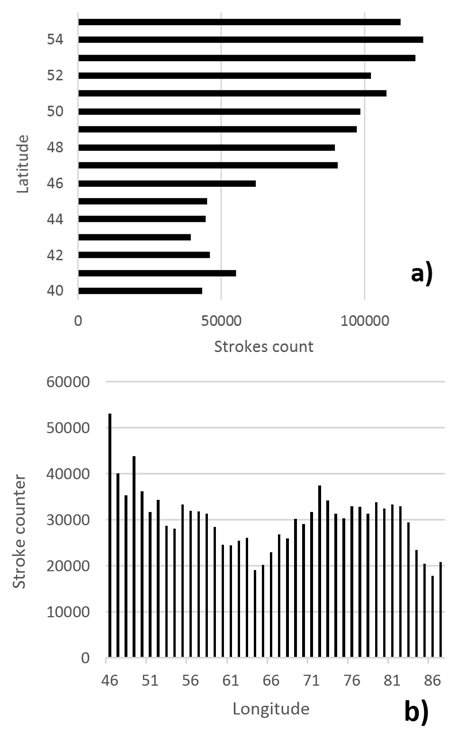 | Figure 4. Latitudinal (a) and longitudinal (b) distribution of lightning activity in Kazakhstan |
3.4. Quantity of Hours with Lightning in 2016
- Estimation of quantity of hours with lightning for Kazakhstan in 2016 was done. The mapping of the results is presented on Figure 5.These estimations for a 1°x1° bin was provided (615 bins total). Usually, such estimates based on visual and aural observations of density distribution of lightning discharges to the ground, expressed in terms of number of strokes to 1km2 of the ground surface in a year. Thus, to obtain number of strokes to square kilometer, the number of events in a 1oх1o bin is necessary to divide into the area of this cell. As the area of cells depending on the longitude and latitude is different, application of the universal approach is impossible here.However, for some cells the quantitative comparison was done. For example, for a cell 48°-49° N and 75°-76°E the area is 8 194 km2.The area of space of the sphere S bounded in meridians φ1 and φ2 and latitudes θ1 and θ2 (given in degrees) is calculated by equation (1):
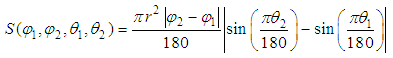 | (1) |
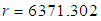 km, then
 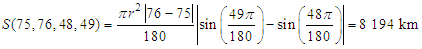 According to WWLLN data, there were 2 035 strokes in this area. Thus, for this cell the number of strokes for 1 km2 (Ng) is ~0,25 strokes/km2. From here, it is possible to determine duration of thunderstorms in hours Td by equation (2) [7]:
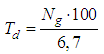 | (2) |
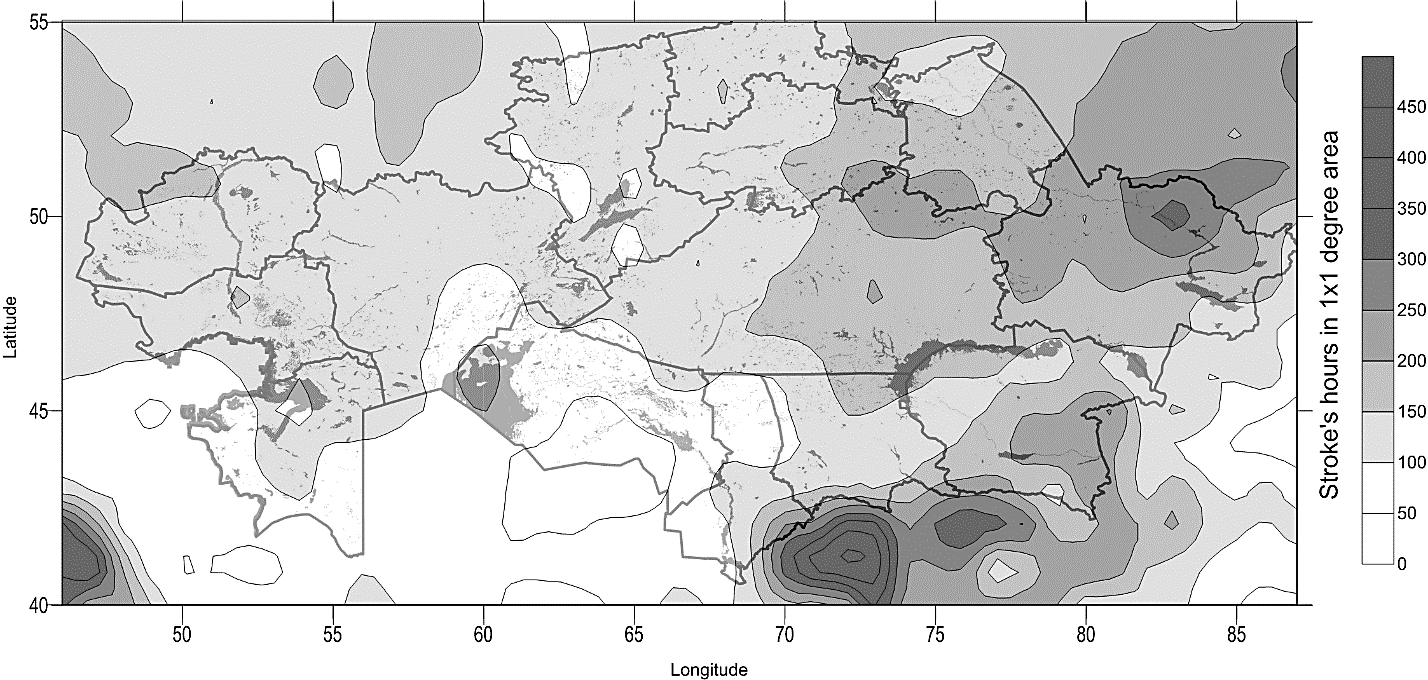 | Figure 5. Map of the quantity of hours with lightning for Kazakhstan in 2016 |
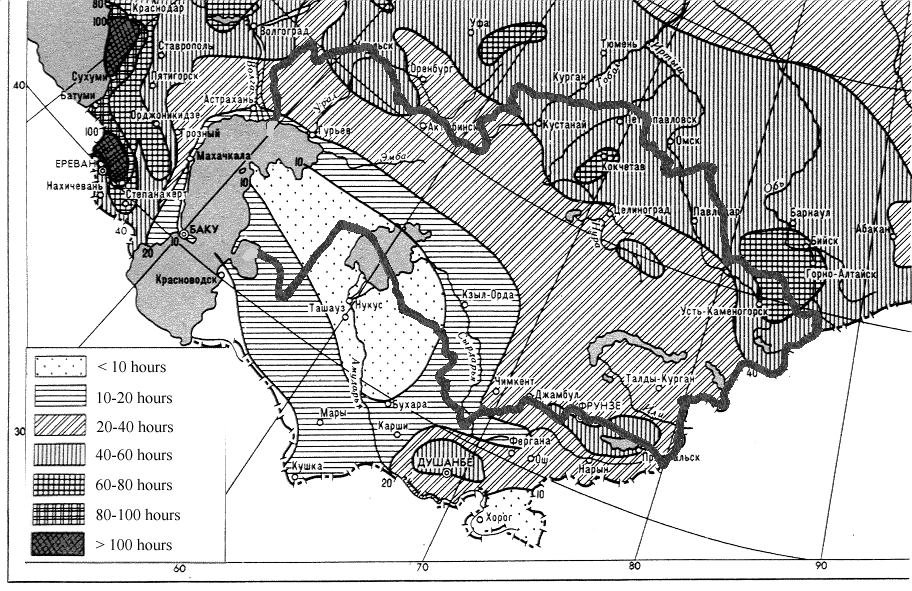 | Figure 6. The segment of the map of average lightning duration in hours for Eurasia |
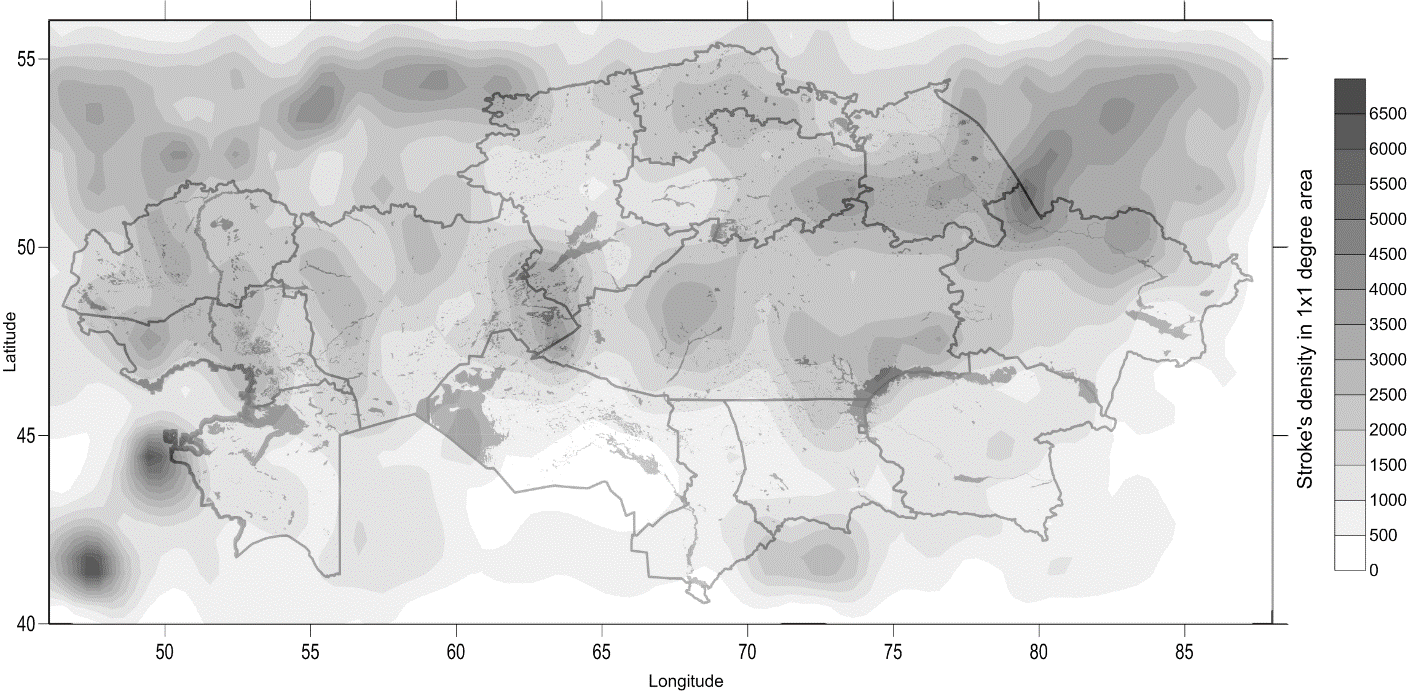 | Figure 7. The map of strokes density based on WWLLN data for year 2016 |
3.5. Strokes Density for Year 2016
- Map of density of lightning discharges based on data from WWLLN network for year 2016 is presented on Figure 7. Here, density is number of the lightning discharges detected by network per area unit. Estimates were provided also for bins 1х1°.From Figure 7 it is possible to allocate the most lightning dangerous regions in Kazakhstan in 2016. The greatest number of annual lightning discharges in a year was observed in East region of Kazakhstan near Semey and Ust-Kamenogorsk cities, in Pavlodar region, on West of Kazakhstan in Atyrau and West Kazakhstan region, as well to the North of Aral sea. The minimum number of strokes was observed in Kyzylorda region.
4. Conclusions
- The study of spatial-temporal distribution of lightning activity for 2016 for the Kazakhstan territory based on data of WWLLN network is done. The most of lightning discharges in 2016 was in summer months – from May to August with a maximum in July. Daily lightning have a low activity at 8-9 AM and at midnight and high activity at 1-3 PM. Spatial distribution analysis show, that minimum of lightning activity is within 43-45°N latitude, and for longitudinal distribution with a minimum on 64°E. Maps of the quantity of hours with lightning and strokes density for Kazakhstan are obtained. Calculation of strokes per square kilometer and lightning duration in hours was done. Obtained results and data from old map of average lightning duration in hours was compared. Now, WWLLN network is the only available source of lightning discharges data for the whole area of Kazakhstan. The first results showed that even with declared 30% average effectiveness of registration of lightning discharges in WWLLN, results of thunderstorm duration in hours are strongly underestimated in comparison with results based on data received from visual and aural observations and from local automatic detection systems. Thus, it is possible to make a conclusion that actual average efficiency of the detection of lightning discharges in WWLLN network for the Kazakhstan area is maybe 5-10%. But, it’s hard to estimate, because of different efficiency for different areas. Firstly, it can be seen from fact that stations of WWLLN are non-equally spaced. However, further studies for more time should be done to confirm these claims.To sum up, the development of automatic network for lightning detection is of the need in Kazakhstan. Due to close stations positions of our network we will obtain more detailed lightning data. Such network is already created and in 2017 it will be put in commission.
ACKNOWLEDGEMENTS
- The work is supported by the Grant 0100/GF4 of Ministry of Education and Science of the Republic of Kazakhstan.