-
Paper Information
- Paper Submission
-
Journal Information
- About This Journal
- Editorial Board
- Current Issue
- Archive
- Author Guidelines
- Contact Us
Geosciences
p-ISSN: 2163-1697 e-ISSN: 2163-1719
2017; 7(2): 77-88
doi:10.5923/j.geo.20170702.04

Qualitative and Quantitative Interpretation of Parts of Onshore Niger Delta, Nigeria, Using High Resolution Aeromagnetic Data
 Abstract
 Reference
 Full-Text PDF
 Full-text HTML
Bello R., Ofoha C. C., Edah H.
Department of Physics, University of Port Harcourt, Nigeria
Correspondence to: Bello R., Department of Physics, University of Port Harcourt, Nigeria.
| Email: |  |
Copyright © 2017 Scientific & Academic Publishing. All Rights Reserved.
This work is licensed under the Creative Commons Attribution International License (CC BY).
http://creativecommons.org/licenses/by/4.0/

Aeromagnetic data acquired by the Nigerian Geological Survey Agency and which covers about 3025 square kilometer of some parts of onshore Niger Delta, Nigeria, was processed and interpreted with the purpose of determining the depth to basement of the study area, delineating areas suitable for hydrocarbon and mineral accumulation, establishing the basement topography, highlighting the structural lineaments with their corresponding trend patterns and then inferring the effect of the above findings as it relates to the tectonic history of the area using the qualitative and quantitative approach. Using polynomial fitting of degree two (2), regional-residual separation was carried out on the Composite Total Magnetic Intensity (CTMI) map, lying geographically within longitude 6°30′ E - 7°0′0″ E and latitude 4°30′ N - 5°0′0″ N, and this generated the regional and residual maps. Some enhancement techniques applied upon the residual map gave rise to some directional gradient maps that depicted structural lineaments trending in the E-W, NE-SW, NW-SE and N-S directions. These lineaments influence the tectonics of the area and as such created faulting and fracturing within the area under review. Quantitatively, the sedimentary thickness was determined using the deeping spikes (blue and green colours) and the shallow spikes (violet, yellow and red colours) models. The deeping spikes highlight zones of deeper magnetic bodies while the shallow spikes reveal magnetic bodies of shallow origin. The deeping spikes also indicate areas with thicker sedimentary cover while the shorter or shallow spikes highlight areas affected with magnetic intrusions. These thick sediments range from 5158.8 m to 11040.2 m but with an average depth of 7359.98 m. The short spikes have sediments thickness ranging from 871.2 m to 4617.7 m but with an average depth of about 2864.24 m. On the average, a thickness value of 4939.2 m was obtained and this suggested that the area holds a promise for the exploration of hydrocarbon.
Keywords: Source Parameter Imaging, Hydrocarbon, Geothermal energy, Sedimentary, Magnetic low
Cite this paper: Bello R., Ofoha C. C., Edah H., Qualitative and Quantitative Interpretation of Parts of Onshore Niger Delta, Nigeria, Using High Resolution Aeromagnetic Data, Geosciences, Vol. 7 No. 2, 2017, pp. 77-88. doi: 10.5923/j.geo.20170702.04.
Article Outline
1. Introduction
- Examining the local geology on the basis of the deviations found in the geomagnetic field is the purpose of the magnetic survey. This anomalies result mostly due to magnetization contrast of the subsurface rocks (Maritta, 2007). This method is a passive geophysical method (Henry, 2010). By being passive, no energy source is needed in order to acquire data (Jose, 2009). Magnetic survey is usually carried out either on land, sea or even in the air. When performed in air an aeromagnetic study is undertaken and as such a magnetometer is towed behind an aircraft. Aeromagnetic survey has become an indispensable component of exploration programmes in areas where exposure is poor (Michael and Steven, 2014). Abdulsalam et al., (2011) stated that the speed of operation and low number of field personnel make magnetic surveys performed at any location very attractive. They further explained that the main purpose is to assist in mineral and hydrocarbon exploration. The magnetic method measures spatial variations in the geomagnetic field. Anomalies in the geomagnetic field are due to the contrast in magnetic properties of rocks, which is mostly controlled mainly by magnetic susceptibility (Michael and Steven, 2014). Emujakporue and Ofoha (2015) pointed out that the differences in magnetic susceptibility may lead to insignificant variations in the magnetic fields of rocks measured on the vicinity of measurement. Generally, the susceptibility of rocks varies and this depends on rock type and the environment in which it is found. Magnetic surveys, usually in nano Tesla (nT), show that unusual variations called magnetic anomalies exist and this could be caused by dykes, faults and lava flows. Nevertheless, two types of magnetism, namely the induced and remnant magnetism are responsible for the differences in the magnetic values (Maritta, 2007).The study area and its environs are ranked among the major productive hydrocarbon zones in West Africa and the world generally. Sandstones and unconsolidated sands which is predominant within the Agbada Formation are believed to be the source of oil and gas in the Delta (Aizebeokhai and Olayinka, 2011). Niger Delta basin is known specifically, all over the world, for its hydrocarbon potential. So researchers, government as well as oil exploration companies have made attempts towards the exploration of its hydrocarbon, and perhaps mineral, potentials. Thus, extensive researches have been carried out, and are also currently ongoing, within the basin with various aims and objectives. Oladele and Ojo (2013) enunciated that many exploration works in Niger Delta have been concentrated on seismic survey of Tertiary deltaic hydrocarbon bearing sequence with little or no attention paid to the underlying basement structures. The knowledge of basement framework has been known to exert significant control on the structural disposition and petroleum system of the overlying sedimentary section. Okiwelu et al., (2014) asserted that, in thick sedimentary terrain like the Niger delta basin, regional aeromagnetic field data sets can be utilized in imaging the basement under the sedimentary section, particularly if magnetic sources within the sedimentary section are weaker than the basement rocks as this will have control on the hydrocarbon bearing potential of the basin since structures which will enhance the migration and entrapment of hydrocarbon and minerals will be exhumed. According to Okiwelu et. al., (2014) important factors such as regional structural characteristics of the basement and the correlation between deep basement architectural framework and hydrocarbon target have been lacking in the delta. This study will therefore contribute to the average sedimentary thickness and then exhume the structural controls that will foster the possible migration and accumulation of hydrocarbon and perhaps mineral, within the study area. Location and Geology of the Study AreaThe study area is bounded eastwards by Port Harcourt, westwards by Oloibiri, southwards by Rule and Bony and Northwards by Patani and Ahoada. The study area lies between longitude 6°30′ E - 7°0′0″E and latitude 4°30′ N - 5°0′0″ N with an approximate area of about 3025 km2 within the Niger Delta sedimentary basin of Nigeria. The geologic map, (Fig 1), reveals the area to be swampy and also depicts the Creeks, Benin Formation and Sombreiro Warri Deltaic Plain, SDP.
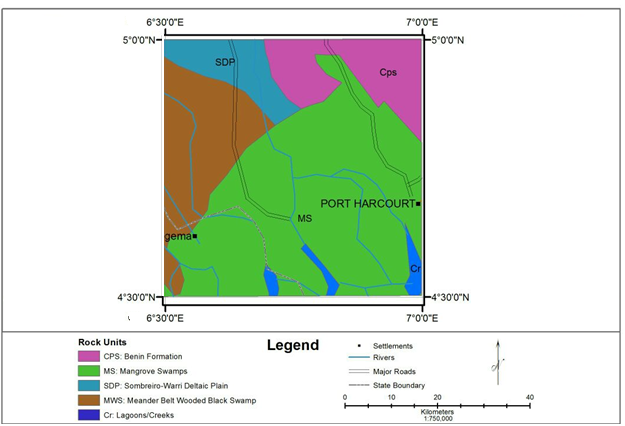 | Figure 1. Geological map of the study area (Obtained from the Nigerian Geological Survey Agency, NGSA, Abuja) |
2. Data and Analysis Method
- Digitized aeromagnetic data (Fig 2 and Fig 2b) covering Degema area of Rivers State, and which was obtained from the Nigerian Geological Survey Agency (NGSA) Abuja on a scale of 1:100000 in half degree sheet, was used for this research. The aeromagnetic survey was flown at 500 m line spacing, tie line of 2 km and 80 m mean terrain clearance. Oasis Montaj 6.4.2 (Geosoft) software was used for the data processing, analysis and interpretation.
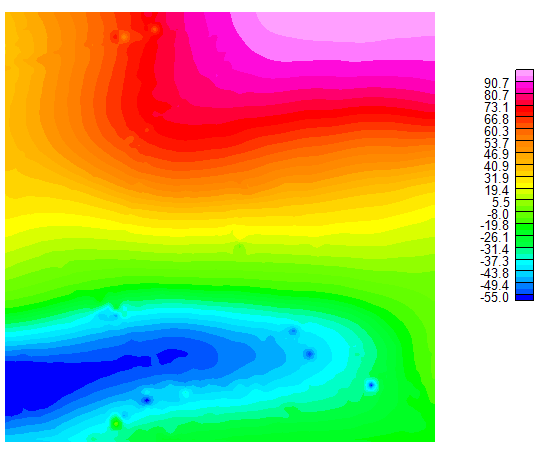 | Figure 2. Aeromagnetic raster map of the study area (nT) |
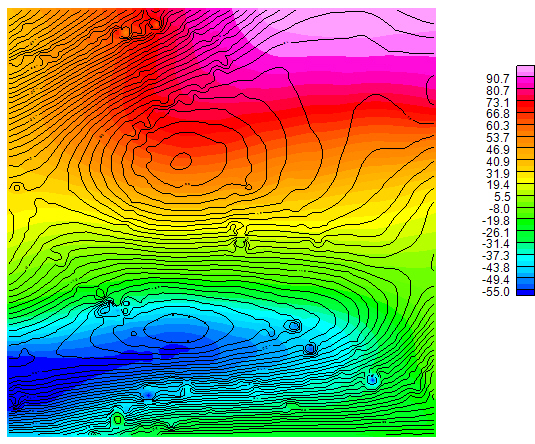 | Figure 2b. Aeromagnetic contour map of the study area (nT) |
 | (3.1) |
 is the Laplace transform which can be expressed in full as
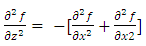 | (3.2) |
 are the differentials in z, y and x coordinates.Then nth vertical derivative can be computed once the Fourier transform is known by using the equation shown below:
  | (3.3) |
2.1. Depth Determination
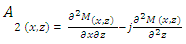
- This study adopted the use of Source Parameter Imaging (SPI) technique to quantitatively determine the depth to basement or the thickness of the sediments. Nwosu (2014) categorically stated that the SPI technique can be a good analytical signal to estimate magnetic depths. The depth parameter is usually determined from grid data sets. According to Thurston and smith (1997), the technique made use of the relationship between depth to sources and the local wave number (k) of the calculated field at any location through gradient derivatives. One merit of the SPI technique over spectral depth analysis is that the depth can be visualized in a raster format and the true thickness determined for each anomaly. The depth parameter determined is independent of an assumed model. The SPI method estimates the depth parameter using the local wavenumber of the analytic signal (Nwosu, 2014). Nabighian (1972) defines analytic signal A(x,z) as
 | (3.4) |
 is the analytic signal
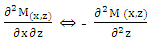
 is the magnitude of the anomalous total magnetic field, J is the imaginary number z and x indicate the gradients in the vertical and horizontal direction Also, it was shown by Nabighian (1972) that the gradient changes comprises the real and imaginary parts of the 2D signal and they are related as follows:
 | (3.5) |
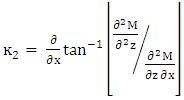
 a Hilbert transform.Thurston and Smith (1972) showed the local wave number ĸ1 to be expressed as:
 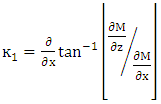 | (3.6) |
 | (3.7) |
 | (3.8) |
 | (3.9) |
3. Results and Interpretation
- Qualitative analysis gave rise to some gradient maps and quantitative analysis generated the map depicting the sedimentary thickness of the area. The qualitative analysis results consist of the regional, residual, first vertical derivative, second vertical derivative, first horizontal derivative, upward continuation and downward continuation maps. Quantitatively, SPI and 3D images depicting depth to basement with its morphology were generated. These images reveal undulations of the basement peculiar to the study area.The Regional Aeromagnetic Map The regional map (Fig 3) is the qualitative effect of the regional-residual separation performed on the TMI map. The regional-map depicts zones with long wavelength and with E-W tectonic trends. The regional aeromagnetic values range between -57.1 nT to 89.0 nT. The southern region is associated with low magnetic values (blue and green colours) while the northern portion of the map is marked with high aeromagnetic values (yellow, red and violet colours).
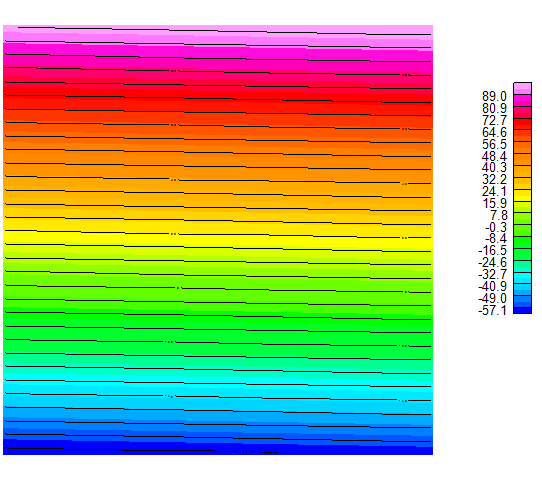 | Figure 3. Regional map of the study area (nT) |
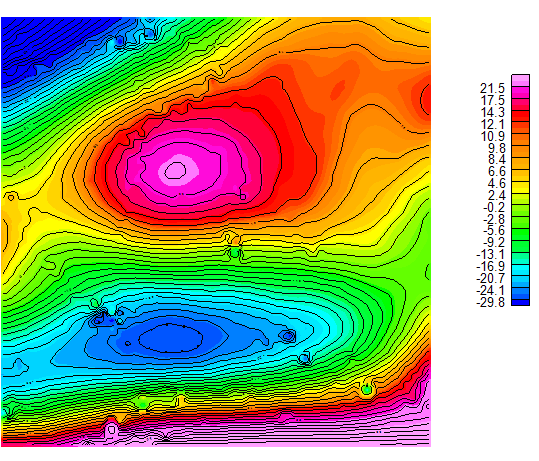 | Figure 4. The residual aeromagnetic map (nT) |
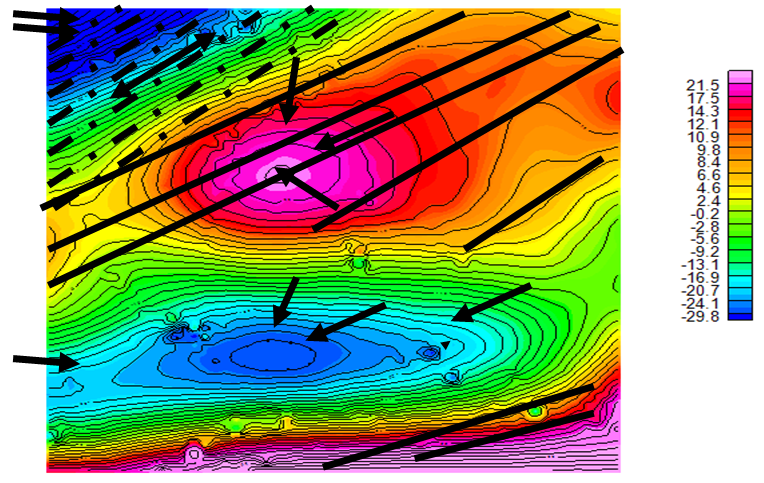 | Figure 4b. The aeromagnetic residual map showing magnetic highs and lows |
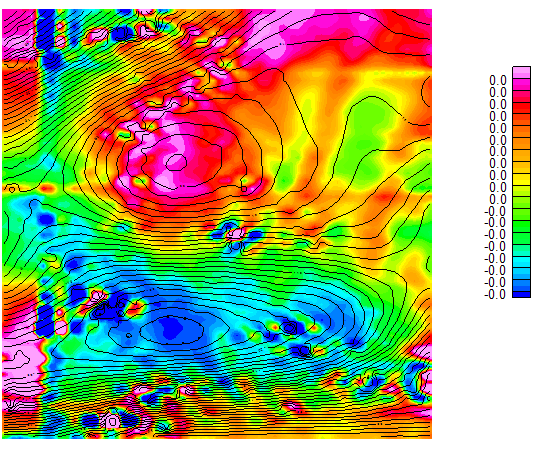 | Figure 5. First vertical derivative map (nT) |
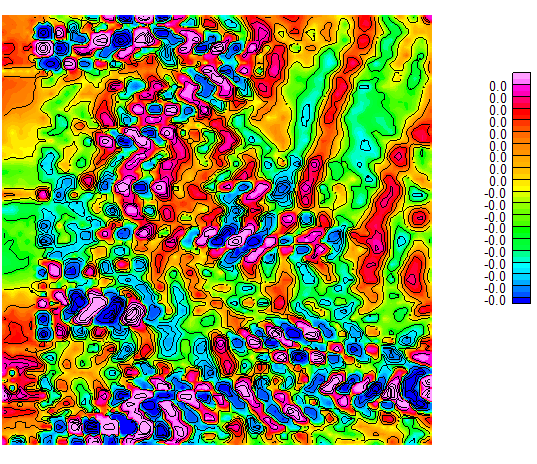 | Figure 6. Second vertical derivative map (nT) |
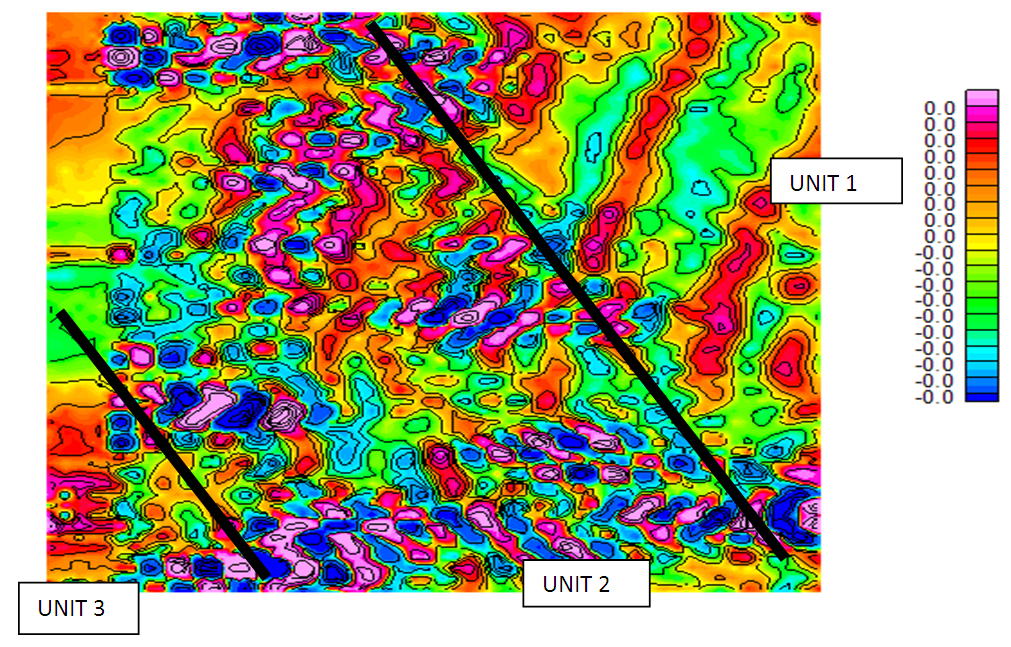 | Figure 6a. The second vertical derivative map sectioned into three idenfiable units of 1, 2 and 3 (nT) |
4. Discussion of Findings
- The aeromagnetic data covering parts of Degema was qualitatively produced into a map consisting of aggregate of colours called the Composite Total Magnetic Intensity (CTMI) map. By first inspecting the CTMI map, colour contrasts are apparent. These colour variations show the magnetic intensity values at various point of the map. The contrast in colour are possibly due to the presence of faults, fractures, dykes, seals, undulations in the basement, differences in lithology and geologic contact as well as magnetic susceptibility contrast of minerals present in the sedimentary section. The aeromagnetic raster map comprises of the violet, yellow, red, green, blue and the light blue colours. Beside the CTMI map is a corresponding legend showing positive and negative magnetic intensity values.The negative values imply areas that are magnetically subdued or quiet while the positive values are magnetically responsive. In respect to the CTMI map, the magnetically subdued areas are the magnetic low points of the study area and this is typical of a sedimentary terrain while the magnetic responsive areas are the magnetic high regions which according to Onuba et.al., (2011) is believed to be due to either igneous or metamorphic rocks. Based on the variation of intensity of magnetic responses, the magnetic low regions are discernible at the southern part of the map while the magnetic highs are obvious at the northern end of the map. The aeromagnetic intensity values ranges from -55 nT to 90.7 nT. Minimum intensity value of -55 nT occurs within the southern portion of the CTMI map while a maximum value of 90.7 nT dominates the northern portion of the map. Critical examination of the magnetic low occurring at the southern portion of the map reveals the blue colour been embedded inside the light blue colour. Gunn (1997) is of the opinion that the blue is as a result of the superposition of magnetic units while the light blue colour is as a result of weathering of the magnetic units.The transformed contour map highlights contours of various characteristics. The magnetic contours vary from been closely parked, relatively closed, closed, linear, smooth to been parallel, elliptical, broadened and irregular. The CTMI is composed of residual and regional field effect trending in the NE-SW and E-W directions but with the NE-SW tectonic trends been dominant. The residual effects are masked on the regional effects. Both effects are due to the total magnetic properties of rocks and this indicates the whole sum of remnant and induced magnetization. The residual and regional anomalous effects are due to shallow magnetic bodies and deep seated magnetic bodies, respectively, found within the mantle and core. In order to unravel the tectonics and economic potential of the study area, regional-residual separation becomes necessary. The regional-residual separation gives rise to the residuals which may provide clue about the existence of mineral bodies or sedimentary structures by highlighting some subtle or concealed features. The regional map reveals hidden and planar E-W tectonic trend which is economically insignificant in terms of both hydrocarbon and minerals. The regional field aeromagnetic values ranges from -57.1 nT to 89.0 nT. These values are depicted by the legend attached beside the map. However, values between -57.1 nT to 15.9 nT reflects magnetic low areas (blue and green colours) and this can be traced within the southern portion of the map. From the central portion of the map are high magnetic values represented with the yellow, red and violet colours. These magnetic high anomalies can be found from the central part of the map to the northern portion.The residual anomalous map contains various contour configurations with high economic significance. These contours are of low amplitude and longer wavelength in nature. Although short wavelength magnetic sources are apparent on the map, generally the magnetic signatures trend in the NE-SW and E-W directions. More or less closely parked, circular, linear, parallel, broadened or localized are revealed on the residual map. Revealed at the northwestern part of the map after the regional-residual was carried out are low magnetic areas typical of a sedimentary section. These areas are indicated with the dash thick lines. Within the area are two magnetic lows, namely the area indicated with the double directional arrow and that indicated with thick double arrow points. The thick double arrow point highlighted closely parked, linear and parallel magnetic anomalies trending in the NE-SW. The area under the two thick directional lines trend also in the NE-SW direction and is presumed to be possible structures housing hydrocarbon but Dobrin and Carl (1988) believe that this anomalous pattern results from subsurface faulting that have displaced magnetized rocks. This region falls under the Sombreiro -Warri Deltaic Plain (SDP) at Orerokpe in the western Niger Delta. Moving downwards and northeast wards are magnetic high which lies within the regional thick lines. The regions with high magnetic values are attributed to basement rocks that have intruded onto the sedimentary section. Geologically, the Benin Formation, SDP, Mangrove Swamps, Meander belt wooded back swamps (MWS) cut across this area. The magnetic high anomalies trend in the NE-SW direction. Within the region, circular and irregular magnetic contours are conspicuous. Higher magnetic anomaly occurs visibly at the circular magnetic contour indicated with three directional arrows. The high magnetic values surrounded by the closer circular contour are perceived to be magnetic aureole and this is indicative of high tectonics within such region but Gunn (1997) opines that the circular anomalies are due to the accumulation of magnetite. Further away from the magnetic aureole and moving north eastwards, the contours are farther apart. Generally, the closely parked and spaced contours found within the magnetic high and low areas indicate shallower and deeper anomalous sources respectively. Immediately below the magnetic highs are linear magnetic signatures which is of regional extent and which trends in the E-W direction. Onuba et al., believe that the E-W directional trend is typical of Pre-Pan African trending fault characterized by little brittle deformation which resulted in the development of conjugate strike-slip fault systems while Stone et al., (2004) stated that the E-W anomaly is synonymous to the anomaly induced around the equator. They further stated that around the equator the field is horizontal. According to Jiakang and Igor (2005), the E-W trend often coincides with litho-tectonic domains. Nevertheless, the linear signatures are of low relief and long wavelength. Moving further southward is an anomalous low with single and double arrow. This magnetic anomaly has a short wavelength and low relief as well as an elliptical shape. The elliptical nature signifies a dyke that houses hydrocarbon. An almost NE-SW trend lies below the dyke like structure. The NE-SW trend probably indicates the Charcot fault and chain oceanic fracture zones which serve as a migratory path for hydrocarbon. Hence the possibility of the NE-SW trend in aiding the exportation and importation of hydrocarbon from the dyke. Above all, high magnetic anomalies trending in the E-W directions are discernible at the northern extreme part of the map.The First Vertical Derivative (FVD) map shows smoothened shallow magnetic bodies with anomalous trend of E-W and NE-SW. Unlike the residual map, high magnetic values indicating magnetic intrusions occur at the north western and south western portion of the map when the enhancement technique was applied. However, zones with high aeromagnetic values can also be seen obviously at the northern and slightly at the southern portion of the map. As earlier stated, the high values are intrusions upon the sedimentary cover. Little magnetic low points can be sighted at the north western and southern areas. The contour obtained during the FVD transformation bears the same configuration with the residual map. This therefore implies that the magnetic sources can still be located at the same depth after the FVD filtering action.Second vertical derivative map reveals irregular magnetic signatures of shorter wavelength unlike in the FVD. The SVD magnetic field map contains anomalies and magnetic discontinuities with E-W, NE-SW and subtle NW-SE structural trends. Thus, it can be said that the major E-W and NE-SW trends truncated an older NW-SE trend within the area. To handle effectively the various magnetic anomalies and to identify the possible hydrocarbon and other mineralized structures occurring within the study area, the SVD map was divided into three identifiable magnetic units. The Magnetic units were established based on dominant magnetic signatures and patterns of the anomalies. Unit 1, 2, 3 are located at the North northeast, central and south western portion of the map respectively. Unit one covers about twenty five percent (25%) of the map and is located at the north-northeast part of the study area. The unit is characterized with irregular magnetic highs and lows having a general axis trend of NE-SW. Magnetic high occupies the northern, eastern and southern portion of unit one while the magnetic low occupies the central portion of the unit. Within the unit, the anomalies are of longer wavelength and it can be seen that the edges of the anomalies with high values cut across the boundary of unit one and two. Magnetic unit 2 is emplaced centrally and occupies about fifty percent (50%) of the map. Unit 2 consists of mixture of irregular magnetic highs and lows. The anomalies are almost of equal wavelength except for the anomalies found at the northwestern portion of the unit. The anomalies generally trend in the NE-SW and NW-SE direction. Few E-W tectonic trends can as well be seen at the North western portion of the map. Unit 3 is located at the south western portion of the map and it occupies about twenty five percent (25%) of the map. The region is characterized with equal number of magnetic highs and lows but with the magnetic low dominating. The anomalies trend in the NE-SW, NW-SE and E-W but with the E-W trend been less occurring at the western portion of the unit. Generally, keen inspection of the SVD map reveals short wavelength bodies with blue and green colouration across all the magnetic units. The blue and green magnetic bodies are typical of a sedimentary terrain and they signify probable structures that could accumulate hydrocarbon. It could therefore be inferred that the percentage of hydrocarbon accumulation and exploration would be on the increase within the study area as the intrusive which will be a suitable source of geothermal energy are in proportion with the magnetic lows. The intrusive will provide appropriate geothermal energy needed for the maturation of source rocks. The SPI image map highlights spatial location of various magnetic sources at various depths. The magnetic bodies are evenly distributed as revealed by the image map. Maximum depth of 11040.2 m can be seen occurring at the north western, southern, central and south western portion of the map while minimum depth values occur at the northeastern, north western and southern part of the map. The SPI image, nevertheless, revealed an average depth of 4939.2 m which does not fall short of the maximum thickness required for the concealment of oil and gas formation from organic remains. This was evaluated to be 2.3 km by Wright et al., (1985) provided other conditions remain favourable. The result obtained quantitatively was validated by the dominate NE-SW tectonic faults found within the study area as these fault zone serve as conduit for oil and gas exploration.The spatial location of magnetic sources revealed by the SPI image map (Fig 7) is in consonance with the various locations of sources found on the 3D SPI map (Fig 8). The 3D SPI map reveals two magnetic source models, namely the deepening and the shallow spikes. The deeping spikes (represented with the blue and green colour) show areas with thicker sediments that are lying with the basement complex. These thick sediments range from 5158.8 m to 11040.2 m with a true thickness of 7359.98 m. According to Nwosu (2014), the sedimentary thickness is similar to the thickness of over burden sediment. The thickness of over burden sediment, according to him has a very important significance as to the hydrocarbon generation potential. The short spikes (represented by the violet, yellow, and red colours) have thickness of sediments varying between 871.2 m and 4617.7 m with a true depth of about 2864.24 m. The short spikes highlight shallow seated magnetic bodies that have intruded onto the sedimentary cover. A thickness value of 4939.2 m is validated by the result of other researchers within the study area and its environs as this surpasses the average thickness value proposed by Wright et al., (1985), for the accumulation of hydrocarbon (oil and gas).
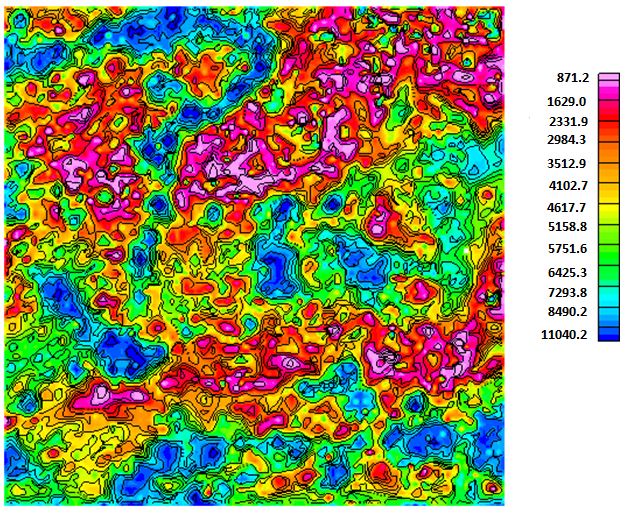 | Figure 7. Source parameter image dept map (m) |
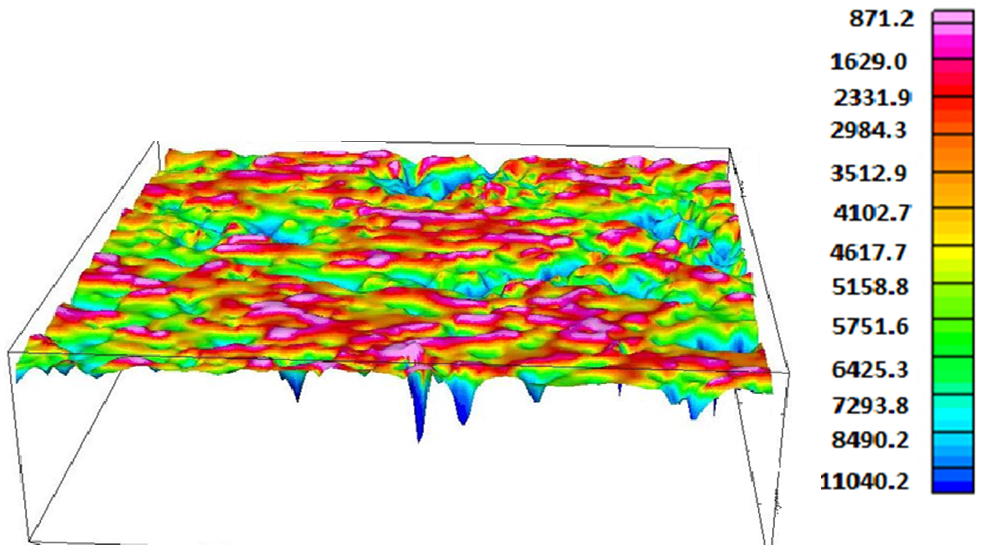 | Figure 8. 3D SPI topographic map |
5. Conclusions
- The qualitative analysis revealed structures trending in the E-W, N-S, NW-SE, NE-SW directions while the quantitative analysis established an average depth value of 4939.9 m. This conform favouraby with the result of other researches within the area of study in that, qualitatively, these structures aid the migration and entrapement of hydrocabon and quantitatively, the average sedimentary thickness obtained is beyond that required for the accumulation of oil and gas as stated by Wright et al., (1985).
ACKNOWLEDGEMENTS
- To the Nigeria Geological Survey Agency that assisted in this research by providing the aeromagnetic data used for this study.