Aqsa Anees 1, Shi Wan Zhong 1, Umar Ashraf 2, Ayesha Abbas 1
1Faculty of Earth Resources, China University of Geosciences, Wuhan, China
2Institute of Geophysics and Geomatics, China University of Geosciences, Wuhan, China
Correspondence to: Umar Ashraf , Institute of Geophysics and Geomatics, China University of Geosciences, Wuhan, China.
| Email: |  |
Copyright © 2017 The Author(s). Published by Scientific & Academic Publishing.
This work is licensed under the Creative Commons Attribution International License (CC BY).
http://creativecommons.org/licenses/by/4.0/

Abstract
The present study pertains to the development of a computer program for Zoeppritz energy partition equations to calculate the reflection coefficient curves of the productive zones from seismic and well log data of the Missakeswal area. The area is a part of Potwar sub-basin. The area is important for its hydrocarbon (oil and gas) structural traps. The seismic interpretation shows pop-up structures bounded by thrust faults. After time to depth conversion the true structural geometry is obtained in the form of depth sections. Seismic structural model shows major thrust faults, which confirm the compressional tectonic regime in the study area. The petro-physical analysis for the selected zones of the interest shows reservoir quality. 2-D seismic model and synthetic seismic model confirms the position and depth of the marked horizons, relief and structural configuration of the study area. Reflection coefficient curves as a function of angle of incidence for Zoeppritz and its various approximations have been computed which show increasing negative acoustic impedance with increase in angle of incidence, a clear indicator of oil and gas based reservoir in the study area.
Keywords:
Interpretation, Stratigraphy, Modeling, Zoeppritz, Reflection Coefficient
Cite this paper: Aqsa Anees , Shi Wan Zhong , Umar Ashraf , Ayesha Abbas , Development of a Computer Program for Zoeppritz Energy Partition Equations and Their Various Approximations to Affirm Presence of Hydrocarbon in Missakeswal Area, Geosciences, Vol. 7 No. 2, 2017, pp. 55-67. doi: 10.5923/j.geo.20170702.02.
1. Introduction
The geographical location of Missakeswal is near Dina 17.7 kilometers north west of city of Jhelum on 33.1869° N, 73.3473° E. It is linked with Dina on one side and Rawalpindi on the other by the Grand Trunk Road and the north western railway both running from Peshawar to Lahore. The climate of the area is hot in summer and dry cold in winter. Geologically Pakistan has its own importance and ground mapping was conducted in Pakistan to delineate the structural models. However, to delineate the subsurface structures, seismic interpretation was carried out. Petro physical analysis like volume of shale to extract and identify the shale and sand zones. In the current study MS Visual Basic 6 and two GeoStudio classes; RockPro and FlexGraph, have been used to develop a computer program “Zoeppritz Calculator” developed to compute the reflection coefficients at an interface between two layers for a range of angle of incidents which indicate change of acoustic impedance with change in angle of incidence to interpret oil and gas zones. In all, three seismic lines GNA-14, GJN-15, GJN-16 and well data were interpreted for evaluating hydrocarbon prospect and identification of petroleum plays in the subsurface of the study area. The imagery of the study area has been obtained from the Image Base databank developed using the Projection Independent Multi-Resolution Imagery Tiles Architecture (PIMRITA) [1] (Figure 1).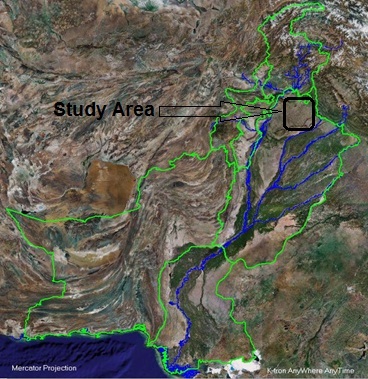 | Figure 1. Satellite image of Pakistan showing Missakeswal area [1] |
2. Tectonics
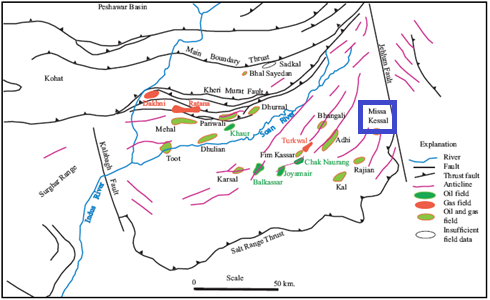
The studied area is a part of the Potwar plateau where the topography is undulating and characterized by a series of parallel ridges and valleys. Generally, they trend in E-W direction. Geo-logically it forms part of the foreland zone of the NW Himalayan fold and thrust belt. This fore-land zone, comprising of Salt range, Potwar plateau/Kohat plateau and Hazara ranges, is an area bounded by the Salt range thrust in the south and the Panjal-Khairabad fault in the north. At its eastern end is the nearly N-S running left lateral Jhelum fault [2]. Kohat-Potwar region situated in Sub- Himalayan domain contains significant quantity of hydrocarbons trapped in post Himalayan orogeny related compressional/transpressional subsurface structures [3-7] Since first discovery of oil in 1914 at Khaur, about 150 wells for exploration of hydrocarbons have been drilled in the Potwar sub-basin. Most of these wells were unsuccessful due to complex subsurface structuration, anomalous thickness of evaporates and huge succession of molasses that pose abnormal pressure during drilling in the area [3-5, 8]. The Oil and Gas field of Potwar-Sub-Basin is shown in Figure 3. Missakeswal field is also highlighted.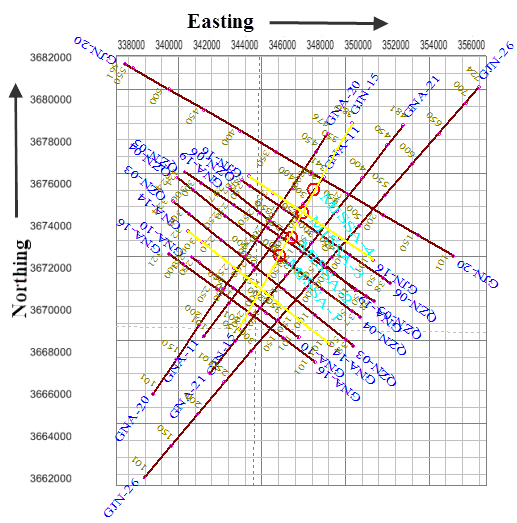 | Figure 2. Seismic Lines and Wells Basemap. Lines under study are marked yellow |
 | Figure 3. Oil and Gas field of Potwar-Sub-Basin. Missakeswal field is also highlighted. [11] |
3. Stratigraphy
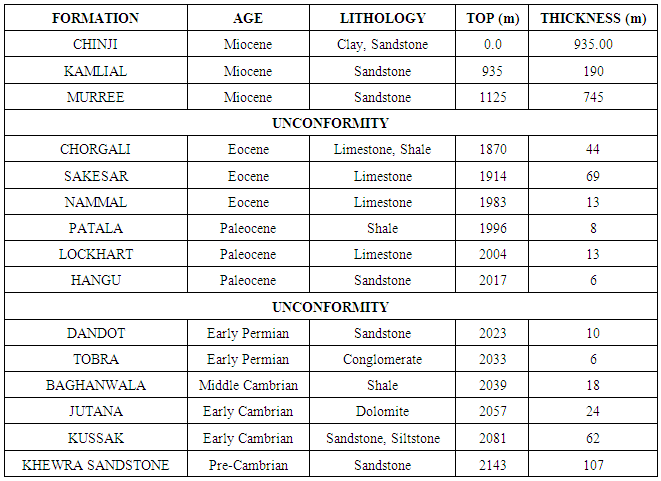
Subsurface geological data from wells drilled in Missakeswal area indicates presence of Precambrian-Eo- Cambrian, Cambrian-Permian, Permian-Paleocene and Eocene-Miocene breaks in deposition (Table 1). Eo-Cambrian Salt Range Formation unconformably overlies the basement rocks, composed of metamorphic and volcanic rocks of Indian Shield [9] and is overlain unconformably by Early Cambrian Khewra Sandstone. Contrary to well data obtained in Rajian, Missa Keswal and Adhi [5] Kussak (sandstone) Jutana (dolomite) of early Cambrian age and Baghanwala (shale) of middle Cambrian lies conformably over Khewra sandstone. While Dandot mainly composed of sandstone of early Permian lies over Tobra formation (conglomerates). Warcha and Sardhai formations are not present in the study area. The area remains exposed from upper Permian through lower Paleocene. Paleocene sequence comprising of Hangu, Lockhart and Patala formations are well developed. Nammal, Sakesar and Chorgali formations of lower and middle Eocene age conformably overlies Paleocene strata. Rawalpindi Group (Murree and Kamlial formations) with Himalayan provenance [10] was deposited unconformably over middle Eocene Chorgali Formation. Chinji formation is present at the top of Miocene molasses sequence in Missakeswal area. The stratigraphic section of MISSA KESWAL_03 well is shown in Table 1. General Stratigraphy of Potwar Sub-Basin is shown in Figure 4.Table 1. The stratigraphic section of MISSA KESWAL_03 well
 |
| |
|
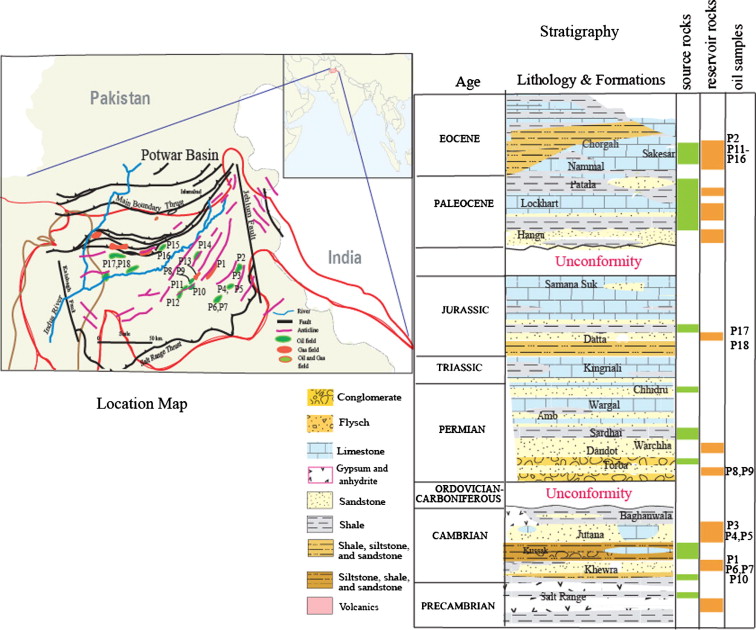 | Figure 4. General Stratigraphy of Potwar Sub-Basin |
4. Results and Discussion
4.1. Project and Interpretation
The base map of the area is generated by plotting data in Universal Transverse Mercator (UTM, Zone 43) geodetic reference system. The base map, given in Fig 2, shows the orientation of the lines present in the Missakeswal area. The lines under study; GJN-15 (strike line), GJN-16 (dip line), GNA-14 (dip line) have been highlighted with yellow. Names and direction of seismic lines used for base map are given in table 1. The base map of the area is generated using K-tron Precision Matrix an Integrated Geo Systems [12].
4.2. Seismic Horizons
Four reflectors are marked on the seismic section on the basis of continuity of the reflectors on the seismic section. Well tops are used in order to identify and name the horizons. The main reflectors marked on the seismic sections that are of interest are Chorgali, Sakesar and Lockhart Formations. The interpreted time sections of line GJN-16 given in Figure 5. The horizon with red color is Chorgali, green is Sakesar, blue is Lockhart and pink is basement.The seismic sections are in time domain, but the real subsurface structures are in depth domain so we have to convert time sections into depth sections using velocities data. (Figure 6)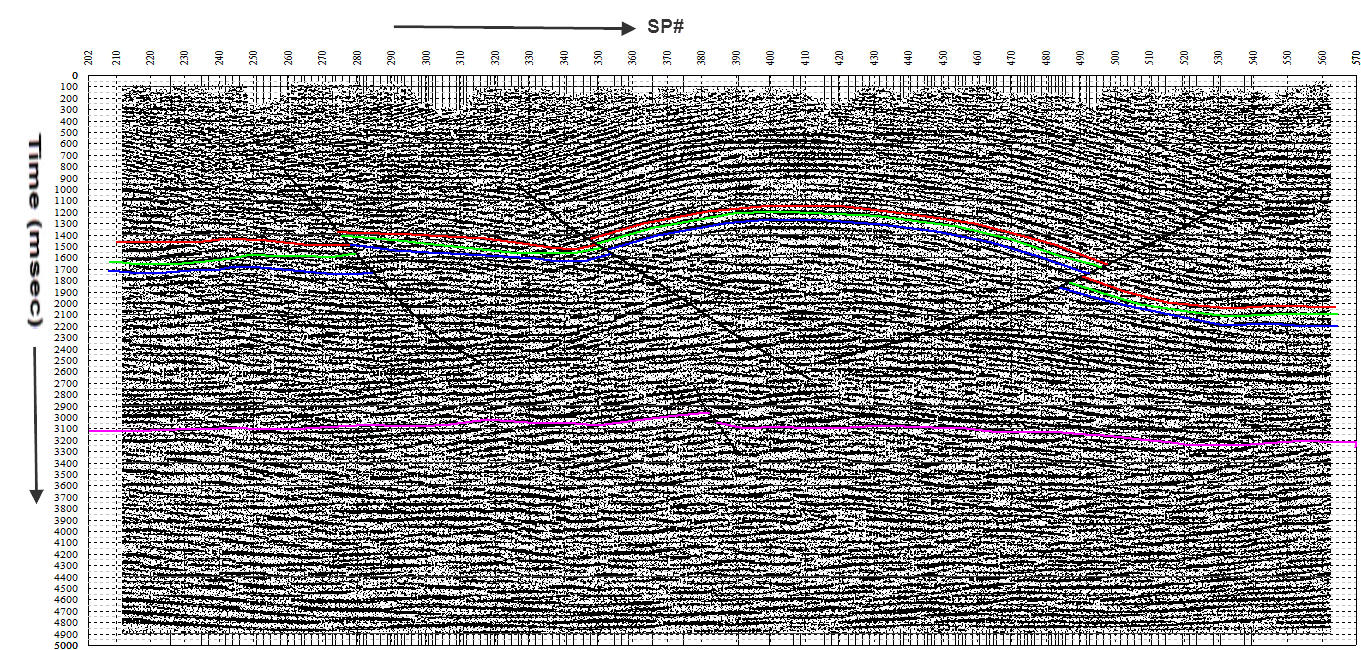 | Figure 5. Interpreted time section of line GJN-16 |
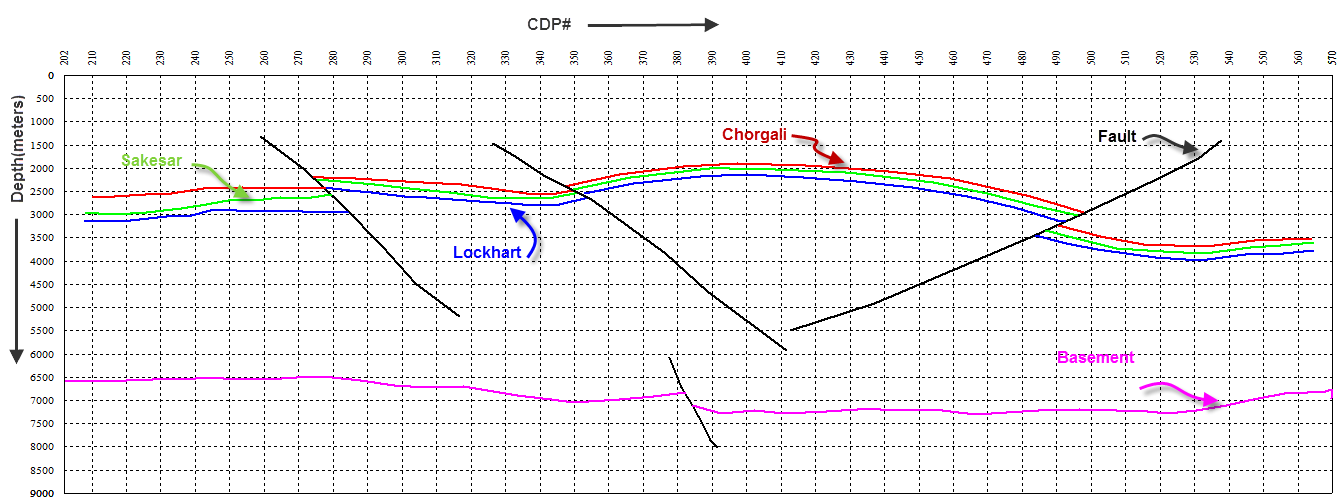 | Figure 6. Depth Section of seismic line GJN-16 |
4.3. 2D Seismic Modeling
Structural Modeling of the interpreted digital geological cross-section of seismic line GJN-16 was performed, to generate a synthetic 2D seismic section. Seismic modeling is reverse process of seismic interpretation. In seismic interpretation we mark geological horizons whereas in seismic modeling we generate the synthetic seismic section. As this modeling is completely based on the structural data the derived synthetic section completely matches the structures. This type of modeling is commonly used to select acquisition parameters for new surveys based on existing geological cross-sections with velocities assigned to each formation. It is also used to get seismic response of stratigraphic models as well as confirmation of seismic interpretation. A synthetic source wavelet was generated using the parameters that were used in the field.The geological section was convolved with the Ricker wavelet at 10 CDP interval to generate a Zero Offset 2D synthetic seismic section. This section is similar to a migrated seismic section (Figure 7). All interpreted geological horizons were assigned refection coefficient attributes. The interpreted geological cross-section has been modelled using X-Works, a geological cross-sections software application, developed using the Wavelets modelling engine [13].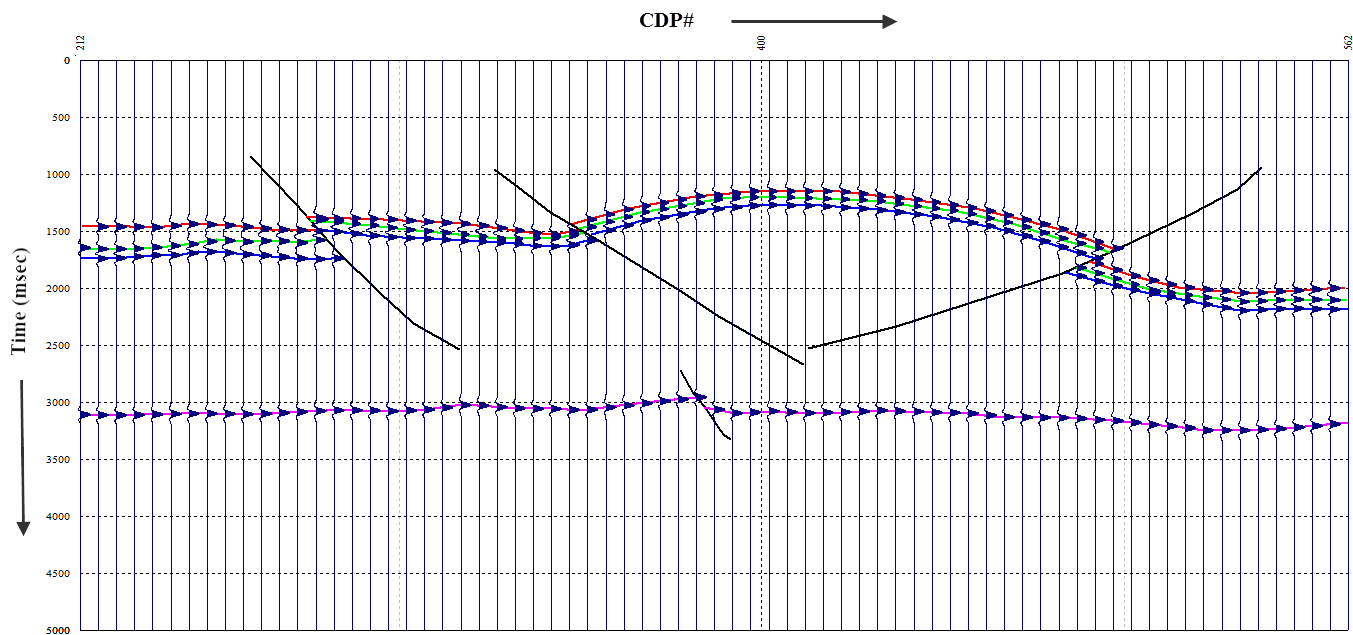 | Figure 7. Geological cross-section with Generated Synthetic Seismic Model |
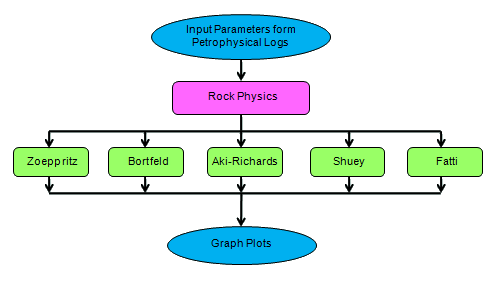
5. Development of Computer Program: Zoeppritz Calculator
5.1. Development Environment
K-tron GeoStudio contains a wide range of specialized geoscientific libraries or classes that can be used to develop software applications [14]. It provides the easy to use any programming language that supports Component Object Model (COM) technology. In the current study MS Visual Basic 6 and two GeoStudio classes; RockPro and FlexGraph, have been used to develop a computer program “Zoeppritz Calculator”. RockPro is a reusable component which includes a rich collection of predefined rock physics, petro-physics, fluid substitution and energy partition functions. Similarly, FlexGraph contains a wide variety of graph plotting functions.
5.2. Mathematical Background
Zoeppritz equations express the partition of energy when a plane wave hits an interface with an acoustic-impedance contrast. For a non-zero angle of incidence four waves are generated: reflected P-wave and S-wave and transmitted P-wave and S-wave as shown in Figure 8.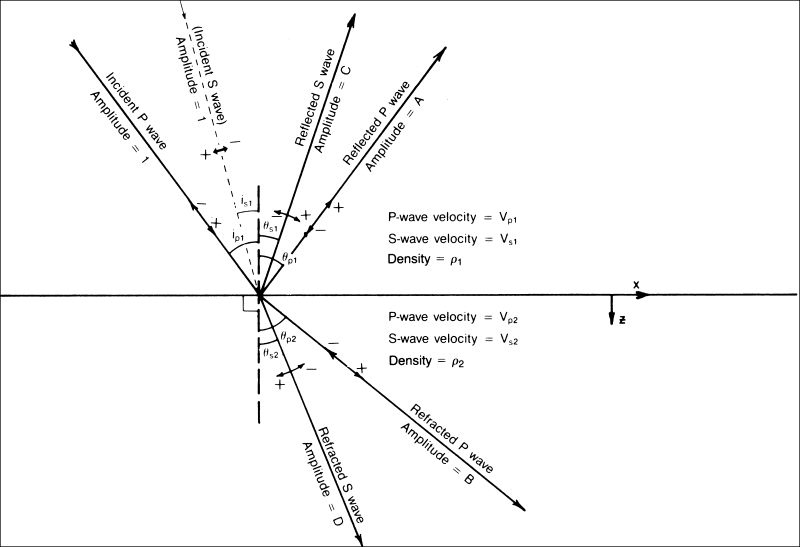 | Figure 8. Partition of Energy when a P or S Wave is incident at an interface with an angle |
The Zoeppritz equations [15] give the amplitudes (reflection coefficients) RP, RS, TP, and TS of the reflected P- and S-waves and the transmitted P- and S-waves respectively. These equations in matrix form are given by: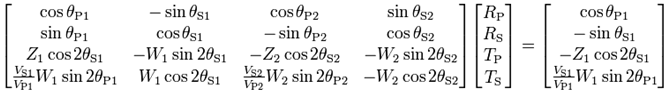 where Zi = ρiVPi, Wi = ρiVSi..Over the years several approximations have been made to the Zoeppritz equations. Some commonly used approximations are: [16-19]. The RockPro library contains predefined computational functions for Zoeppritz and its above mentioned approximation, which are used in the development of the computer program.
5.3. Zoeppritz Calculator
A program has been developed to compute the reflection coefficients at an interface between two layers for a range of angle of incidents. The source code of the program is listed in Appendix A. The program initializes and creates an instance of RockPro and FlexGraph classes, gets input parameters from the interface and then calls the required RockPro functions from a loop, iterating from 0 to 90 degrees for the angle of incidence. Finally, the computed reflections coefficients, stored in arrays, are plotted as graphs using FlexGraph PlotGraph function.The program inputs are P-Wave velocity, S-Wave velocity and density for both layers. It computes the reflection coefficients on the basis of Zoeppritz energy partition equations and its various approximations for angle of incidents ranging from 0 to 90. Graphs of reflection coefficients versus angle of incidence, computed using various methods (Zoeppritz and its approximations) are plotted on the graphics display. Figure 9 shows the interface of the program.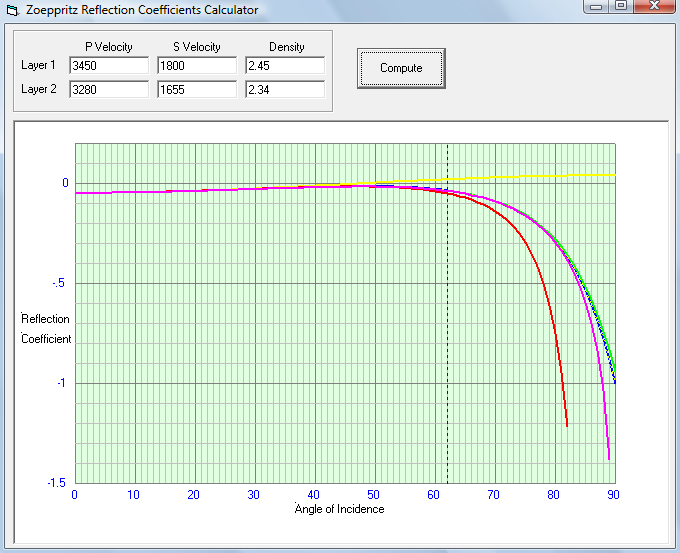 | Figure 9. Zoeppritz Calculator program interface showing the input parameters and the computed reflection coefficients graphs |
5.4. Computed Results for Missakeswal Reservoir
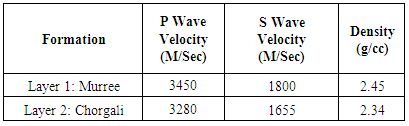
The develop program is used to compute the P wave reflection response of the Missakeswal reservoir, based on Zoeppritz equations and its approximations. The petrophysical logs along with seismic velocities are used to compute the P wave velocity and density for the top Muree formation (Marl) and the Chorgali reservoir (limestone). Rock physics empirical relations are used to determine the S Wave velocities for the two formations. The input parameters adjusted for Murree and Chorgali formations are summarized below in Table 2 These parameters are used as input to compute the reflection coefficients at different angles. Figure 10 shows the complete processing flowchart of the program.Table 2. The input parameters adjusted for Murree and Chorgali formations are summarized below
 |
| |
|
 | Figure 10. Complete processing flowchart of Zoeppritz Calculator |
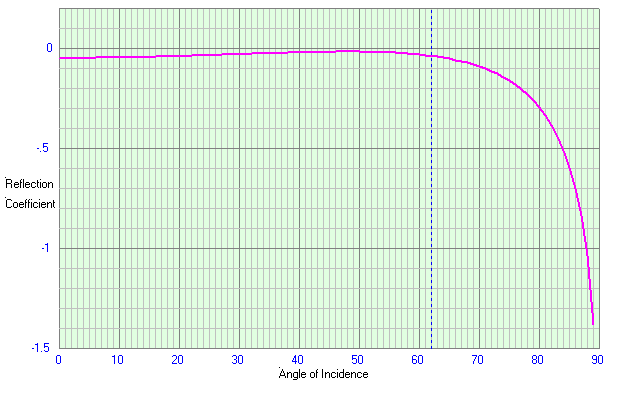
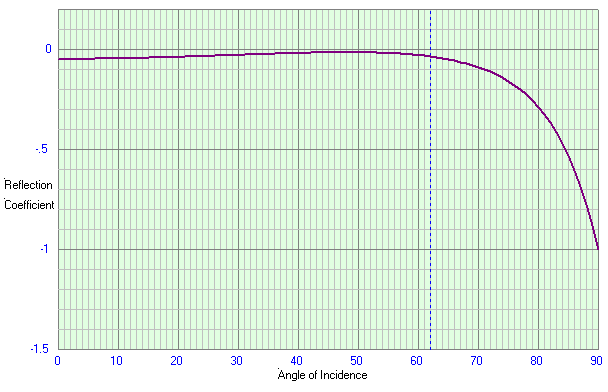
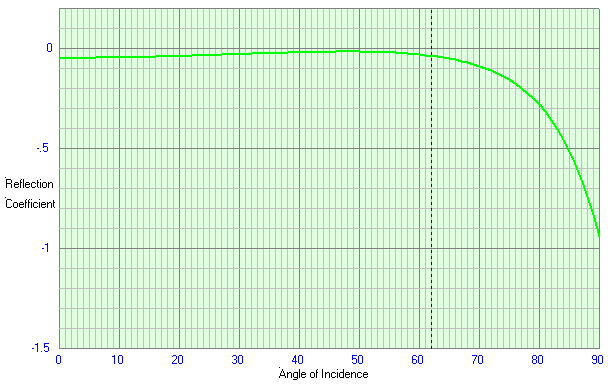
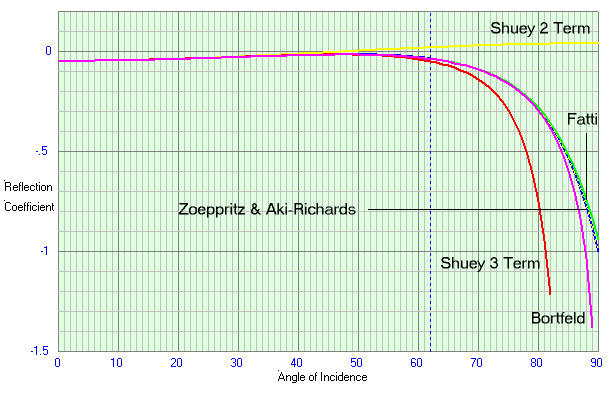
Figure 11 shows the graph of reflection coefficients computed using Zoeppritz equations and Figures 12-15 show the graphs of reflection coefficients computed using various approximations of Zoeppritz. It must be noted that the critical angle for the model is computed to be 62 degrees.Figure 16 shows the comparison of reflection coefficient curves computed from Zoeppritz equations and its various approximations. It can be observed that the curve generated by 2-term Shuey equation does not compare with rest of the curves when approaching the critical angle while rest of the curves closely match at pre-critical angles. At post-critical angles Zoeppritz, Aki-Richards and Fatti curves closely match, while Bortfeld matches up to 83 degrees of angle of incidence and 3-term Shuey deviates immediately after the critical angle. Thus all curves, except Shuey, can be used for the current model. These curves clearly indicate an increasing negative acoustic impedance with increase in angle of incidence which is an indicator of oil and gas based reservoir.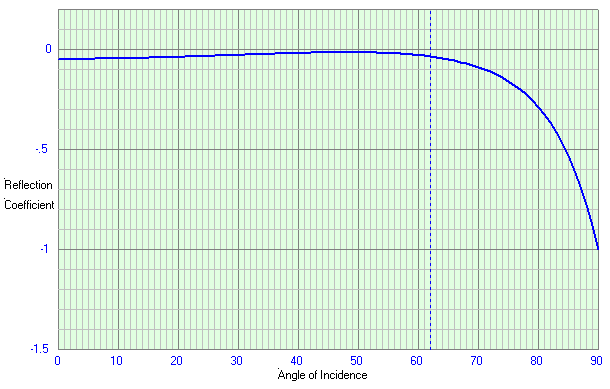 | Figure 11. Zoepprtiz based Reflection coefficient curve as a function of angle of incidence |
 | Figure 12. Bortfeld based Reflection coefficient curve as a function of angle of incidence |
 | Figure 13. Aki-Richards based Reflection coefficient curve as a function of angle of incidence |
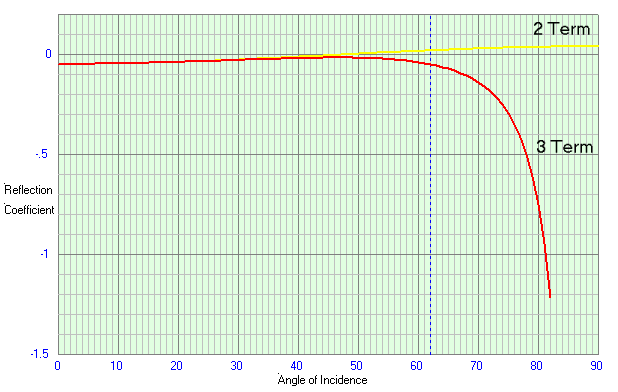 | Figure 14. Shuey based Reflection coefficient curve as a function of angle of incidence |
 | Figure 15. Fatti et al. based Reflection coefficient curve as a function of angle of incidence |
 | Figure 16. Reflection coefficient curves as a function of angle of incidence for Zoeppritz and its various approximations |
6. Conclusions
On the basis of general stratigraphic columns present in the area, four reflectors are identified. Reflector 1 can be considered as Chorgali. Reflector 2 can be considered as Sakesar. Reflector 3 can be considered as Lockhart. Reflector 4 can be considered as Basement. The seismic section shows a displacement and a popup anticlinal structure in the area which is best for hydrocarbon accumulation. Time to Depth conversion of seismic section gives us the true picture of sub-surface structures. Structural Modeling of the interpreted digital geological cross-section is performed to generate a synthetic 2D seismic section. Structural modeling is best for confirmation of type and nature of sub-surface material. Reflection coefficient curves as a function of angle of incidence for Zoeppritz and its various approximations clearly indicate an increasing negative acoustic impedance with increase in angle of incidence which is an indicator of oil and gas based reservoir. All curves, except Shuey, can be used for the current model.
ACKNOWLEDGMENTS
I am thankful to DGPC to give me the Seismic and Well data and to Sir Khalid Amin Khan (OGDCL) for his moral and technical manner which was very helpful for me.
Appendix
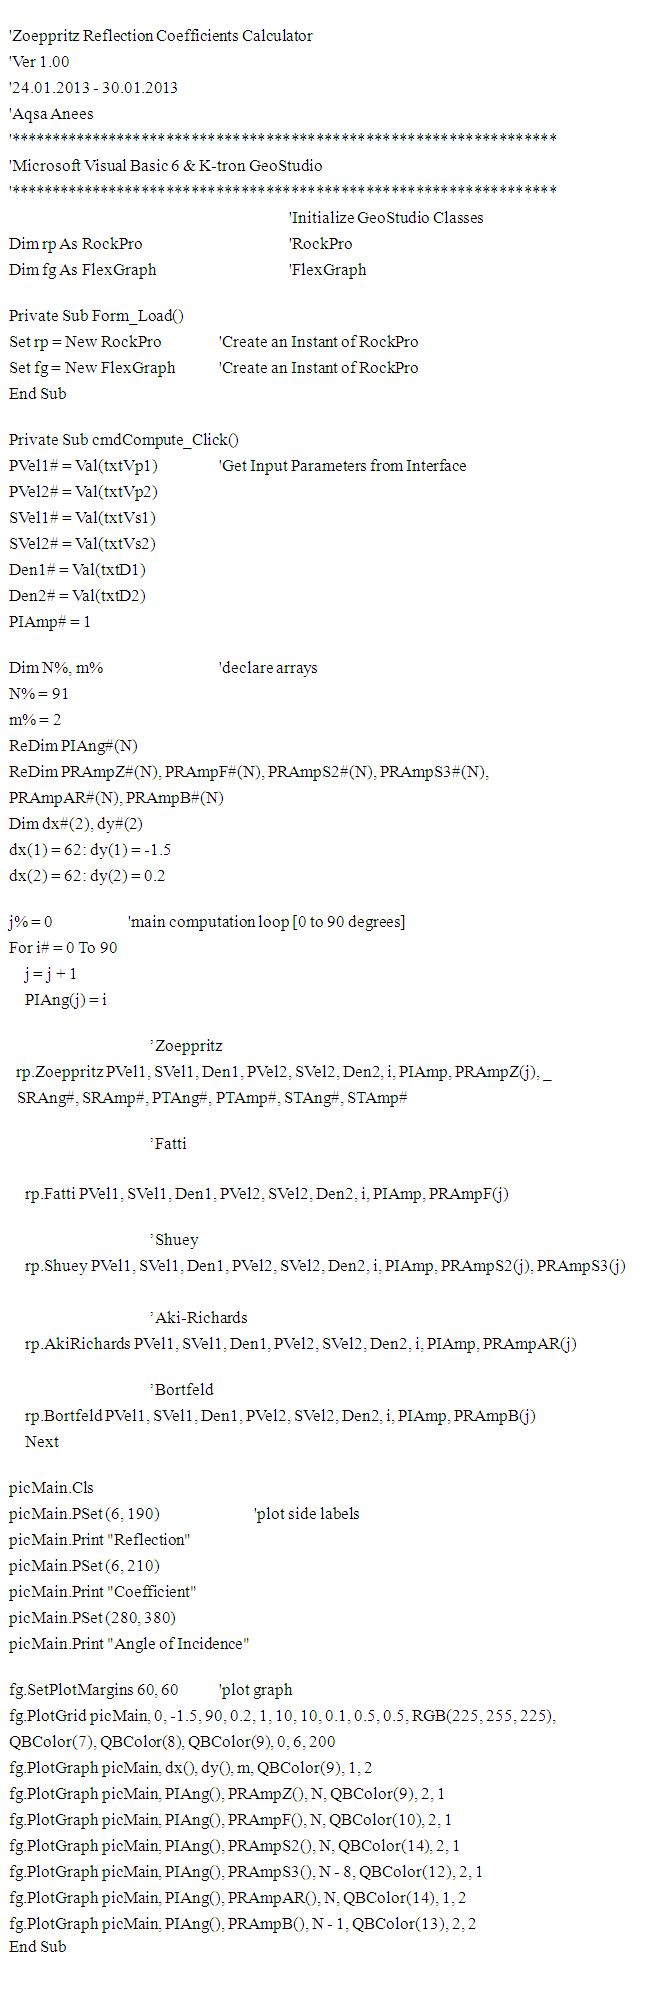 | Appendix A: Zoeppritz Calculator Source Code [MS VB6 & K-tron GeoStudio] |
References
| [1] | Khan, K.A., et al. Development of a projection independent multi-resolution imagery tiles architecture for compiling an image database of Pakistan. in Advances in Space Technologies, 2008. ICAST 2008. 2nd International Conference on. 2008. IEEE. |
| [2] | Kazmi, A.H. and M.Q. Jan, Geology and tectonics of Pakistan. 1997: Graphic publishers. |
| [3] | Jaumé, S.C. and R.J. Lillie, Mechanics of the Salt Range‐Potwar Plateau, Pakistan: A fold‐and‐thrust belt underlain by evaporites. Tectonics, 1988. 7(1): p. 57-71. |
| [4] | Kadri, I., Petroleum Geology of Pakistan: Pakistan Petroleum Limited. Karachi, Pakistan, 1995. |
| [5] | Moghal, M.A., et al., Subsurface geometry of Potwar sub-basin in relation to structuration and entrapment. Pak J Hydroc Res, 2007. 17: p. 61-72. |
| [6] | Pennock, E.S., et al., Structural interpretation of seismic reflection data from eastern Salt Range and Potwar Plateau, Pakistan. AAPG Bulletin, 1989. 73(7): p. 841-857. |
| [7] | Raza, H.A., et al., Petroleum zones of Pakistan. Pakistan Journal of Hydrocarbon Research, 1989. 1(2): p. 1-19. |
| [8] | Mona Lisa, A.A., Kwaja, M. Javed, Y.S. Ansari, and Q Jan,, Seismic Hazard Assessment of the NW Himalayan Fold and Thrust Belt of Pakistan using Probalistic Approach. Proc. Pakistan Acad. Sci., 2005(42(4)): p. 287-295. |
| [9] | Yeats, R.S., and R.D. Lawrence, Tectonics of the Himalayan thrust belt in northern Pakista, in Haq, B.u., and Milliman, J.D., eds., Marine geology and oceanography of the Arabian Sea and coastal Pakistan: New York, Van Nostrand Reinhold. 1984. |
| [10] | Chaudhry, M., et al. Age, Stratigraphic Position and Provenance of Murree Formation of North West Sub-Himalayas of Pakistan and Azad Kashmir. in Third Geosas Workshop on Siwalik GSP, Islamabad. Bull. Geol. Surv. Pak. 1998. |
| [11] | Siddiqui, M. and M. Aamir, Interpretation and visualization of thrust sheets in a triangular zone in eastern Potwar, Pakistan. Oil and Gas Development Company (OGD CL), Islamabad, Pakistan. The Leading Edge, 2006: p. 24-37. |
| [12] | Khan, K., Integrated Geo Systems-A Computational Environment for Integrated Management, Analysis and Presentation of Petroleum Industry Data. Geographic information systems in petroleum exploration and development, aapg book on computers in geology, 2000(4): p. 215-226. |
| [13] | Khan, K.A., Akhtar, G., Ahmed, Z., Khan, M.A., and Naveed, A., Wavelets - A Computer Based Training Tool for Seismic Signal Processing. Pakistan Journal of Hydrocarbon Research, 2006. 16(1): p. 37-43. |
| [14] | Khan, K.A., Development of a Computational Architecture for Geoscientific Data Management, Processing, Interpretation and Visualization along with Specialized Algorithmic Libraries for various Geophysical Methods, Ph.D. Dissertation, Department of Earth Sciences, Quaid-i-Azam University, Islamabad, Pakistan. 2011. |
| [15] | Sheriff, R.E. and L.P. Geldart, Exploration seismology. 1995: Cambridge university press. |
| [16] | Aki, K. and P. Richards, Quantitative seismology: theory and methods WH Freeman and Company. San Francisco, California, 1980. |
| [17] | Bortfeld, R., Approximations to the reflection and transmission coefficients of plane longitudinal and transverse waves. Geophysical Prospecting, 1961. 9(4): p. 485-502. |
| [18] | Fatti, J.L., et al., Detection of gas in sandstone reservoirs using AVO analysis: A 3-D seismic case history using the Geostack technique. Geophysics, 1994. 59(9): p. 1362-1376. |
| [19] | Shuey, R., A simplification of the Zoeppritz equations. Geophysics, 1985. 50(4): p. 609-614. |

 Abstract
 Reference
 Full-Text PDF
 Full-text HTML