-
Paper Information
- Next Paper
- Paper Submission
-
Journal Information
- About This Journal
- Editorial Board
- Current Issue
- Archive
- Author Guidelines
- Contact Us
Geosciences
p-ISSN: 2163-1697 e-ISSN: 2163-1719
2017; 7(2): 47-54
doi:10.5923/j.geo.20170702.01

A Spectral Method of Segmenting Well Data into Its Main Rock Stratigraphic Units in Niger Delta
 Abstract
 Reference
 Full-Text PDF
 Full-text HTML
Williams Ofuyah1, Omafume Orji2, Sunday Utah1
1Department of Earth Sciences, Federal University of Petroleum Resources, Effurun, Nigeria
2Department of Petroleum Engineering and Geoscience, Petroleum Training Institute, Effurun, Nigeria
Correspondence to: Williams Ofuyah, Department of Earth Sciences, Federal University of Petroleum Resources, Effurun, Nigeria.
| Email: |  |
Copyright © 2017 Scientific & Academic Publishing. All Rights Reserved.
This work is licensed under the Creative Commons Attribution International License (CC BY).
http://creativecommons.org/licenses/by/4.0/

Traditional well log interpretation involves direct horizon mapping using log signature, attributes cross plot, etc. to produce lithologic section for the delineation, exploration and production of hydrocarbon in oil and gas fields. The methods operate on recorded lithologic logs without adequate calibration. These result in interpretational ambiguities because of relatively poor resolution of well log owing to its recording in time, under sampling and coarse processing. In this paper, a method and algorithm for segmenting well log using Fourier transform in the interpretation of well data obtained from the Niger Delta is presented. The aim of the study is to develop a method for establishing reliable main stratigraphic units in well data using an adopted lithologic log (Gamma-Ray). The objectives are to segment well logs in three wells in a survey into their constituent lithologies in time domain, transform the well data from time to frequency domain, and deduce viable diagnostic attributes such as phase and frequency from the transform coefficients which could be used to segment, and identify the most probable zonation/contact in the wells. The algorithm adopts discrete Fourier transform technique in the time to frequency transformation and is implementable on both standard and general seismic and well data interpretational platforms. It directly computes the spectral equivalent of the adopted lithologic log and recovers hitherto lost frequency information. The results of the spectral decomposition of the well data yielded frequency (pseudo) logs that reveal subtle sub-well horizons and differences in lithology and better delineation and delimitation of mineral contact zones. This is valuable in fields of uncertain stratigraphy or frontier areas.
Keywords: Fourier transform, Spectral decomposition, Lithology, Formation, Mineral, Stratigraphy
Cite this paper: Williams Ofuyah, Omafume Orji, Sunday Utah, A Spectral Method of Segmenting Well Data into Its Main Rock Stratigraphic Units in Niger Delta, Geosciences, Vol. 7 No. 2, 2017, pp. 47-54. doi: 10.5923/j.geo.20170702.01.
Article Outline
1. Introduction
- Well log segmentation in spectral domain is the transformation and segmentation of well data into mineral contact zones in the frequency domain rather than in the traditional time domain. This is done to separate fact from artifact in well log processing and interpretation. Well logs can be considered as time series and analyzed in both time and frequency domains [1]. Even though this book was published in 1968, it is still the authority on spectral analysis. Segmentation is an important data mining process. Well logs can be subdivided into relatively uniform segments that represent zones of similar lithologic character (stratigraphic units/ formations). Segment boundaries correspond to abrupt changes in the layering, and conform to the limits of relatively stable periods or geologically meaningful zones. These elementary units of similar properties can then be used as the basis for inferring correlations between wells. There are various strategies for addressing this segmentation problem. Classical approaches include the detection of abrupt changes in the mean [2], or in the variance [3, 4]. Segmentation of discrete sequence of geologic data [5]. General descriptions of these techniques are in [6]. Recent studies include zonation by means of cluster analysis [7]. Spectral analysis for identifying stationary intervals [8], etc. Generally, well-log interpretation systems deal with the maintenance of a well log data base and evaluation of formation fluids but rarely carry out detailed stratigraphic interpretation. Standard well log interpretation involves direct horizon mapping, attributes crossplot, statistical analysis, etc. to produce lithologic section for the delineation, exploration and production of hydrocarbon in oil and gas fields. The methods operate on recorded lithologic logs (in time domain) without adequate calibration. These result in interpretational ambiguities because of poor resolution of the logs, under sampling and coarse processing. Majority of the classic stratigraphic interpretation algorithms are structural, and the interpretation is based upon maximum cross-correlation of zones in wells. Cross-correlation techniques run into trouble, however, when stratigraphic units differ in thickness, or are truncated due to erosion, faulting, or thickness changes from differing rates of sedimentation. Stretching of zones alone or moving window correlation, or a combination of both cannot ensure geologically meaningful correlation. The techniques succeed only when data sets have favorable characteristics [5]. Also, existing commercial interpretational techniques and algorithms as reflected in oil and gas industry’s softwares are good, but they are reliable only when geologic condition are favourable and need to be improved for precise reservoir delineation, delimitation and description.In this paper, the results of an algorithm for segmenting well logs into its main rock stratigraphic units or formations in frequency domain using the discrete Fourier transform in the interpretation of well data obtained from Tomboy field, Niger Delta are presented.The main inputs to the method are well data and a clear knowledge of signal analysis. The algorithm adopts discrete Fourier transform technique in the time to frequency transformation and is implementable on both standard and general seismic interpretational platforms. It directly computes the spectral equivalent of the adopted lithologic log (Gamma-Ray) in time domain and recovers hitherto lost frequency information.The results of the spectral decomposition of the well data yielded frequency (pseudo) logs that reveal subtle sub-well horizons and differences in lithology. The results indicate the three main formations in the Niger Delta and their gradations, i.e. from shale (Akata formation) to sandy-shale to shaly-sand (Agbada formation) and to sand (Benin formation). In the three wells studied, lithology changes vertically and horizontally, indicative of discontinuity and stratigraphic units differ in thickness. By revealing masked horizons and better delineating and delimiting reservoirs, more hydrocarbons will be recovered and field development will be enhanced. This is particularly necessary to improve the success ratio of field appraisal and identify potential exploration projects especially in fields of uncertain stratigraphy, complex geology or frontier areas.
2. Geologic Background
- The Niger Delta Basin, also referred to as the Niger Delta province, is an extensional rift basin located in the Niger Delta and the Gulf of Guinea on the passive continental margin near the western coast of Nigeria [9]. It is located in Southern Nigeria between latitudes 3°N and 6°N and longitudes 4°301E and 9°E. This basin is very complex, and it carries high economic value as it contains a very productive petroleum system. The Niger Delta basin is one of the largest subaerial basins in Africa. It has a subaerial area of about 75,000 km2, a total area of 300,000 km2, and a sediment fill of 500,000 km3. [9]. It is a large arcuate delta of the destructive, wave dominated type. The Basin is divided into the continental, transitional and marine environments in the following manner: A sequence of under-compacted marine clay (Akata formation, depth from 11121ft, and Paleocene in age). This is composed of thick shales, turbidite sands, and small amounts of silt and clay. It is the mobile formation that is squeezed into shale diapirs in the basin. The Akata formation formed during lowstands in sea-level and in oxygen deficient conditions. This formation is estimated to be up to 7000 meters thick [9]. The Akata shales are mobile, undercompacted and typically overpressured. They are considered to be the main source rock of the Niger Delta with the upper part considered matured source rock [10]. This sequence is overlain by paralic or sand/shale deposits (Agbada formation, depth: about 7180-11121ft and Eocene in age). It is a marine facies defined by both freshwater and deep sea characteristics. This is the major oil and natural gas bearing facies in the Basin. The hydrocarbons in this layer formed when this layer of rock became subaerial and was covered in a swamp type of environment that contained lots of organics. It is estimated to be 3700 meters thick. Oil and gas are trapped by roll-over anticlines and growth faults [11]. The paralic interval is overlain by a varying thickness of continental sands (Benin formation, depth: 0 - about 6000ft, Oligocene and younger in age). It is composed of continental flood plain sands and alluvial deposits. It is estimated to be up to 2000 meters thick [10]. The Benin formation contains no commercial hydrocarbons although several minor oil and gas stringers are present [12, 13], noted that the age of the formations become progressively younger in a down-dip direction and ranges from Paleocene to Recent. (Figure 1)The Niger Delta Basin produces around 2 million barrels of oil per day. The entire system is predicted to contain 34.5 billion barrels of oil and 94 trillion feet3 of natural gas. This area is still very heavily explored by oil companies today. It is one of the largest oil producers in the world. [9]
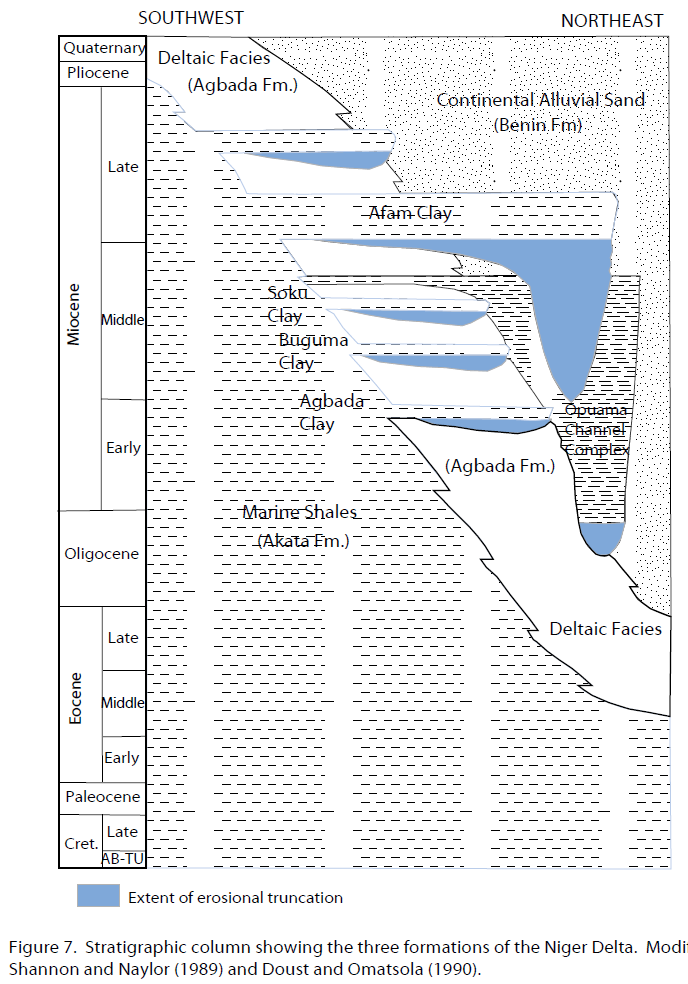 | Figure 1. Stratigraphic column showing the three Formations of the Niger Delta. (After [14]) |
3. Discrete Fourier Transform (DFT)
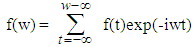
- Fourier analysis is extremely useful for data analysis, as it breaks down a signal into constituent sinusoids of different frequencies. For sampled vector data, Fourier analysis is performed using the discrete Fourier transform (DFT). The fast Fourier transform (FFT) is an efficient algorithm for computing the DFT of a sequence; it is not a separate transform. It is particularly useful in areas such as signal and image processing, where its uses range from filtering, convolution, and frequency analysis to power spectrum estimation. Spectral decomposition techniques provide enhanced frequency resolution. The concept behind spectral decomposition is that a reflection from a thin bed has characteristics expression in the frequency domain that is indicative of temporal bed thickness (Amplitude Spectra) [15]. Amplitude spectra delineate thin bed variability via spectra notching patterns, which are related to local rock mass variability. Likewise phase spectra respond to lateral discontinuities via local phase instability. [15]. Spectral techniques include discrete Fourier transform (DFT), Hilbert transform (HT), maximum entropy method (MEM), STFT etc. The discrete Fourier transform (DFT) was adopted in this study. More sophisticated transforms such as STFT to overcome the inherent windowing problems of the DFT have been applied in other studies but mostly to a single well e.g. [16]. The Discrete Fourier Transform (DFT) is the digital equivalent of the continuous Fourier transform and is expressed as
 | (1) |
 | (2) |
 | (3) |
 | (4) |
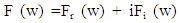
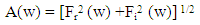
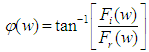
 are the amplitude and phase spectra respectively [17]. The DFT computes response attributes of magnitude, phase and frequency (time derivative of phase).
4. Method
- In this study, well-log segmentation and interpretation using DFT was undertaken with well data from Tomboy oil field in Niger Delta. The data comprises six wells (W01-06) and seismic data. However, only three of the wells that are of good data quality (Wells 02, 05 and 01) were segmented and compared. The datum (Kelly Bushing) for measuring depth in each of the wells is 46.50ft (W01), 45.93ft (W02) and 45.00ft (W05). The aim and objectives of the study are to segment three well logs in the survey into their constituent lithologies in time domain and compare, transform the well data from time to frequency domain, deduce viable diagnostic attributes such as phase and frequency from the transform coefficients which could be used to identify the most probable zonation/contact in the wells, then segment, and compare with the result in time domain. The following routines were adopted: (a) lithologic plot of Gamma-Ray (GR) data in each of the wells to obtain log description in time (natural data acquisition domain), and (b) In order to detect the subtle and other changes in the well data, and to examine if filtering of the logs (in time and frequency domains) would provide a clearer picture of the lithology, the DFT was applied to transform the lithologic log (GR) in each of the wells using a developed spectral decomposition algorithm implemented within Matlab software. The analysis was carried out using the three wells located about an approximately straight line portion of an arbitrary line drawn to connect all the wells in the survey. (Figure 2). In the transformation, fast Fourier transform (FFT) technique was used to compute the response attributes of DFT over the entire window length. Representative pseudo-well log attribute sections of the GR log such as phase and frequency were computed and plotted for each of the wells. The original data (GR), its time filtered version, and its DTF response attributes were compared afterwards. The pseudo-sections computed from the results give distinct sequence boundaries, and lithofacies compartments. The programming and plotting languages used were Kingdom Suite, Matlab, Gnuplot and Surfer programs.
5. Discussion of Results
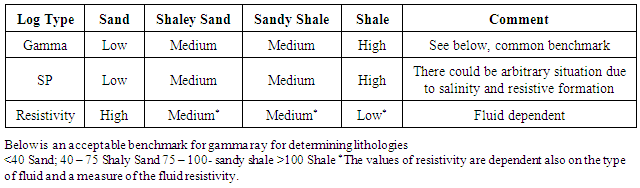
- The data sets used are field data sourced from Niger Delta by Chevron Corporation, Nigeria. They include well logs e.g. Gamma-ray (GR), Resistivity, Self-potential, etc. and Seismic data. The aim and objectives of the study are to segment three well logs in a survey into their constituent lithologies in time domain, transform the well data from time to frequency domain, and deduce viable diagnostic attributes such as phase and frequency from the transform coefficients which could be used to identify the most probable zonation/mineral contact in the wells and stratigraphic variation and compare. The adopted lithologic log for analysis is GR log. In sedimentary formations, the log normally reflects the Shale content of the formations. This is because the radioactive elements tend to concentrate in Clays and Shales. Clean formations usually have a very low-level of radioactivity, unless radioactive contaminant such as Volcanic ash or Granite wash is present or the formation waters contain dissolved radioactive salts. It is useful for location of Shales and non-Shaly beds and, most importantly, for general correlation. The bed boundary is picked at a point midway between the maximum and minimum deflection of the anomaly. The radioactivities in sedimentary formations generally range from a few API units in Anhydride or Salt to 200 or more in Shales [18]. A low Gamma-ray count rate is diagnostic of a Sandy formation, while a high Gamma-ray count rate characterizes Shale or radioactive Sand (Shaly Sand) formation (Table 1).
|
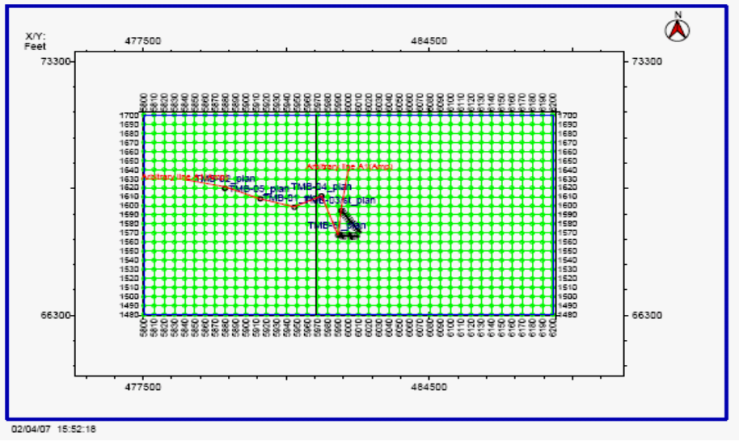 | Figure 2. Tomboy Field, Niger Delta: Base map of survey area showing the Arbitrary (User defined) line (red). The Arbitrary line connects the entire six wells (black dots). The wells under consideration are labeled TMB 02, 05 and 01 |
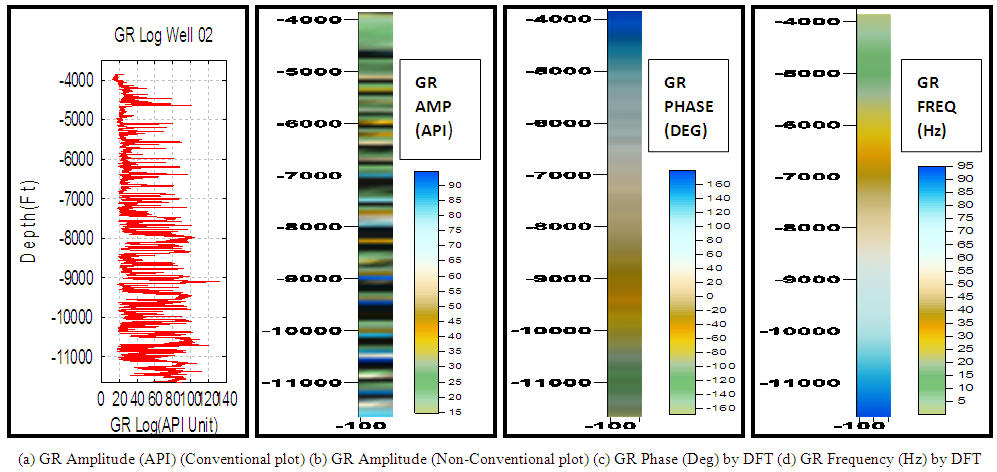 | Figure 3. Well 02: (a) GR Amplitude (Conventional, noisy) (b) GR Amplitude (Non-conventional plot, time filtered, noise still present but reduced (black bands) (c) GR Response Phase by DFT (d) GR Response Frequency by DFT. Clearer segmentation is obtained in the frequency filtering. The transformation was done over the entire data length |
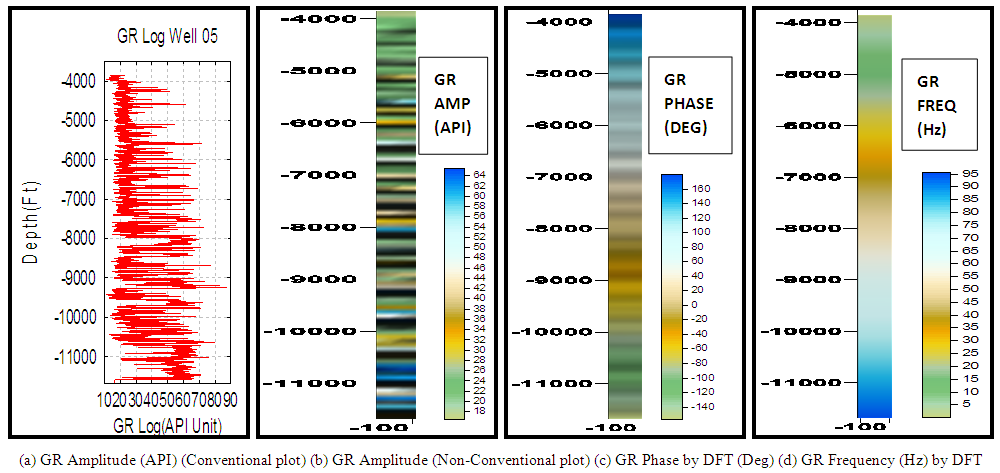 | Figure 4. Well 05: (a) GR Amplitude (Conventional, noisy) (b) GR Amplitude (Non-conventional, time filtered, noise still present but reduced (black bands) (c) GR Response Phase by DFT (d) GR Response Frequency by DFT. Clearer segmentation is obtained here |
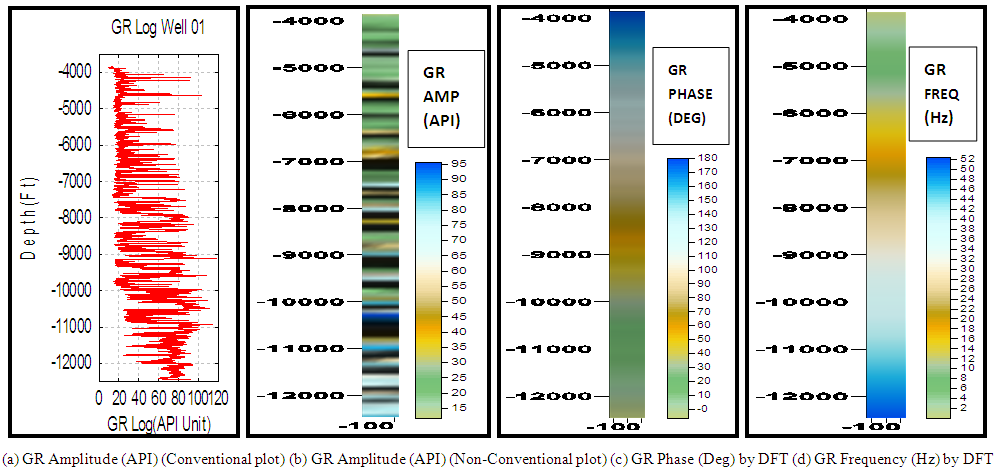 | Figure 5. Well 01: (a) GR Amplitude (Conventional, noisy) (b) GR Amplitude (Non-conventional, time filtered, noise still present but reduced (black bands) (c) GR Response Phase by DFT (d) GR Response Frequency by DFT. Clearer segmentation is obtained in the frequency filtering |
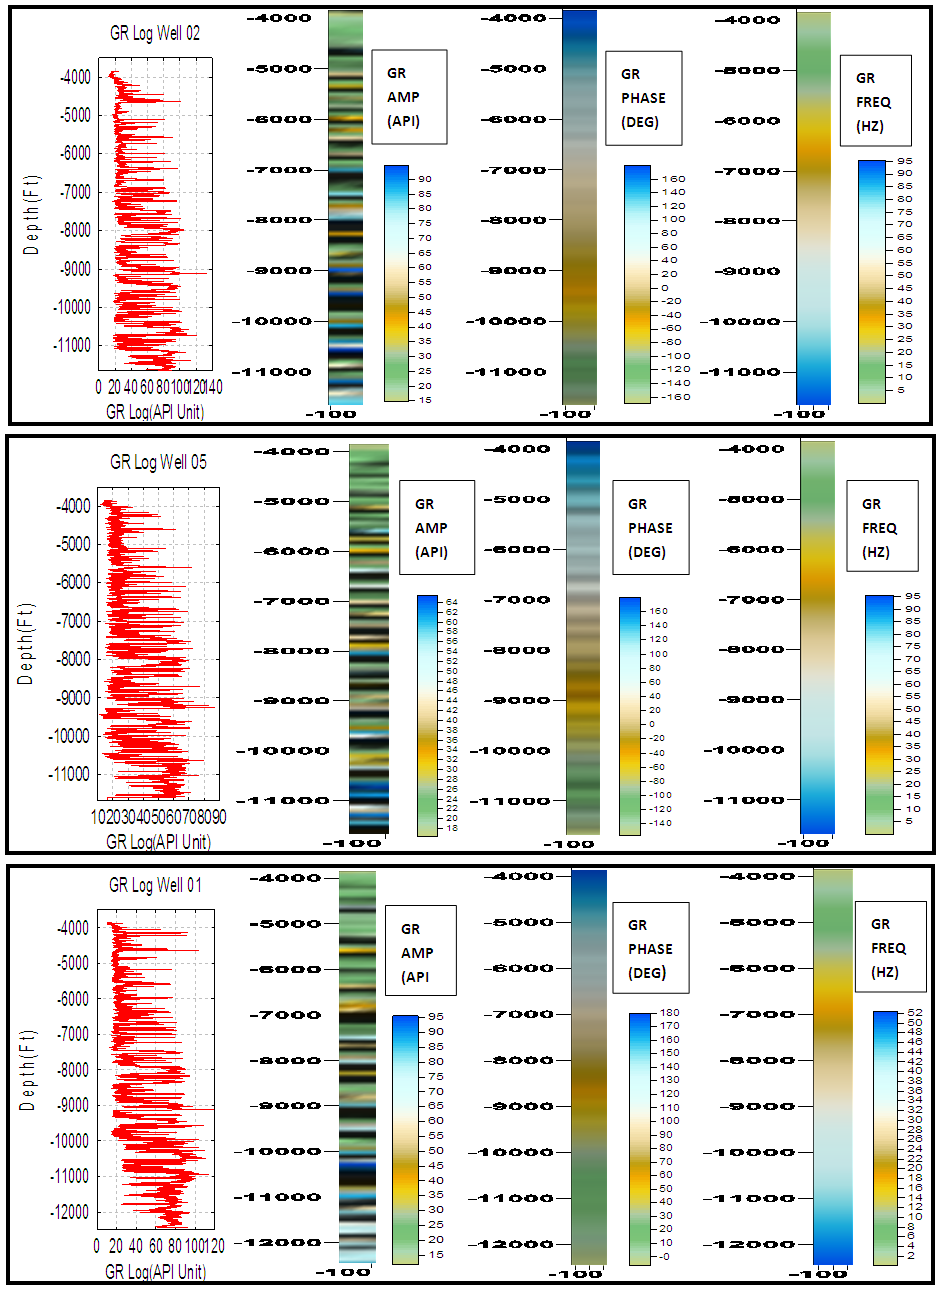 | Figure 6. Gamma-Ray attributes in time and frequency domains in the three wells. The phase and frequency attributes indicate the three main stratigraphic units (Formations) in the Niger Delta and their gradations, i.e. from Shale (Akata Formation) to Sandy-Shale to Shaly-Sand (Agbada formation) and to Sand (Benin Formation). These correspond to the lithostratigraphic sequence of the Niger Delta |
6. Conclusions
- In this paper, an algorithm for segmenting well log (Gamma-ray) in frequency domain using the discrete Fourier transform has been undertaken using well data from Tomboy Oil field, Niger Delta. The aim of the study was to develop a practical spectral technique for segmenting well log into its fundamental lithologic stratigraphic units. The results indicate the three main formations in the Niger Delta and their gradations, ie from Shale (Akata Formation) to Sandy-Shale to Shaly-Sand (Agbada Formation) and to Sand (Benin Formation),consistent with established geology of the area. In the three wells studied, stratigraphic units differ in thickness due to erosion, faulting, or differing rates of sedimentation. The algorithm adopted Fast Fourier transform (FFT) techniques in the time to frequency transformation and is implementable on both standard and general seismic and well log interpretational platforms. Spectral decomposition of the well data yielded frequency (pseudo) logs that revealed subtle sub-well horizons and differences in lithology. Given that the literature on the use of high resolution spectral techniques on well log segmentation is limited, this new non-conventional approach will among other advantages reveal masked layers, and better delineate and delimit reservoirs resulting in enhanced hydrocarbon recovery. This work is applicable in areas of scarce wells, complex geology and unknown stratigraphy or in the frontiers. It is recommended that more sophisticated signal transforms such as wavelet transform (WT), Cepstral transform (CT), etc. be used in future.
ACKNOWLEDGEMENTS
- The authors wish to thank Chevron Corporation, Nigeria for making data available for use. Thanks are also due to Tertiary Education Trust Fund (TETFUND) for the grant used for the research as well as the Federal University of Petroleum Resources, Effurun, Nigeria for the use of her computing facilities.