E. C. Merem1, Y. Twumasi1, J. Wesley1, P. Isokpehi1, M. Shenge1, S. Fageir1, M. Crisler1, C. Romorno1, A. Hines2, G. Hirse2, S. Ochai3, S. Leggett3, E. Nwagboso4
1Department of Urban and Regional Planning, Jackson State University, Jackson, MS, USA
2Department of Public Policy and administration, Jackson State University, Jackson, MS, USA
3Department of Health Policy and Management, Jackson State University, Jackson, MS, USA
4Department of Political Science, Jackson State University, Jackson, MS, USA
Correspondence to: E. C. Merem, Department of Urban and Regional Planning, Jackson State University, Jackson, MS, USA.
| Email: |  |
Copyright © 2017 Scientific & Academic Publishing. All Rights Reserved.
This work is licensed under the Creative Commons Attribution International License (CC BY).
http://creativecommons.org/licenses/by/4.0/

Abstract
In the past several years, Nigeria continues to experience robust economic development with growth rates surpassing those of her neighbors. Added to all these are pressures from rising population spread across different eco-regions and a growing demand for water use to meet the needs of different segments of the economy. With that have come water stress, limiting access, and degradation compounded by incoherent policy in water management in the country despite vast hydrological endowments. Notwithstanding policy efforts and provisions supporting proper management under various jurisdictions, water access remains a big issue in Nigeria where it is yet to be accorded priority. Seeing the various guidelines designed to safeguard aquatic ecosystems, the regulatory framework has been ineffective in containing the widespread discharge of toxics into surface water environments. The fact that current lapses in water management threaten the environment and public health in Nigeria, no effort has been made to assess the trends from a mix-scale perspective. Without that approach, managers lose sight of locational severity, the tracking of stressors and factors impeding water use. Accordingly, the study analyses water management issues in Nigeria using mix-scale method of GIS and descriptive statistics. Emphasizing the issues, environmental analysis, factors fuelling the problems and ongoing initiatives, results show declines in water quality, widespread degradation, limited access and growing demand. With the issues linked to various elements, GIS assessment reveals a steady dispersion of socio-economic factors as well as diffusion of stressors in some areas. Despite current initiatives, Nigeria’s water environment remains under stress with projected deficits. To deal with the issue, this research recommends the need for improved policy, regular monitoring, and the design of data infrastructure, sustainable use and regional cooperation.
Keywords:
Water management, Stressors, Policy, Degradation, GIS, Water Deficit
Cite this paper: E. C. Merem, Y. Twumasi, J. Wesley, P. Isokpehi, M. Shenge, S. Fageir, M. Crisler, C. Romorno, A. Hines, G. Hirse, S. Ochai, S. Leggett, E. Nwagboso, Analyzing Water Management Issues Using GIS: The Case of Nigeria, Geosciences, Vol. 7 No. 1, 2017, pp. 20-46. doi: 10.5923/j.geo.20170701.03.
1. Introduction
For decades Nigeria has endured the dilemma of unsolved problems of inadequate access to safe water on a recurrent basis in the face of a teeming population and rapid urbanization despite its vast surface and ground water potentials [1, 2]. Added to that, the population growth currently driving economic predictors has not been accompanied by an increase in the delivery of regular water supply with the provision of adequate sewerage and sanitation services. At the same time, the gap between those areas that have reasonably safe access to water supply and sanitation and those without is growing wider [3]. In that light, urban areas see greater coverage, whereas many in semi-urban and rural areas experience stagnation in services [3]. Notwithstanding the progress that has been made in water supply development since the first waterworks in Nigeria was commissioned in Lagos in 1915, many Nigerians still have no access to a modern water supply. Seeing the growing essence, the federal government only got involved in the management of water resources in 1976 when it created the ministry of water resources and the River Basin Development Authorities (RBDAs) primarily to provide irrigation water, and also water for power supply [2, 4]. Even with that, sporadic water shortage not only persists across the country, but Nigeria has been projected to face acute water stress by 2020 and 2025 [4]. The incidence of limited access in the country has become so common that Lagos now faces daily water deficit of 300 million gallons out of a daily requirement of 540 million gallons [5, 6]. Being largely endowed with surface and groundwater resources, Nigeria is well drained with a close network of streams and rivers [7]. But, the task of providing safe water supply for the citizens has been quite elusive for 3 decades [8]. More so, degradation of water quality remains most severe in the four states (Lagos, Rivers, Kano and Kaduna States) containing 80% of the nation’s industries [9, 10]. With the threats posed to the health and economic development in the country by these risks. Nigerians have been openly breaching and evading surface water and groundwater laws put in place to ensure effective management much of the time. Unsustainable practices of some water users in those circumstances have damaged carefully thought projects, thereby resulting in massive financial losses at the expense of the welfare of Nigerians. Added to that, many regulations adopted by the previous governments to safeguard the marine environment in Nigeria, have been ineffective in controlling the indiscriminate dumping of effluents into open water bodies. These effluents consist of chlorides, phosphates, oil and grease, nitrates, heavy metals and other chemicals [9, 10]. Given the lax regulations, Nigeria’s water infrastructure has also suffered from years of poor operation and maintenance, weak and inefficient institutions and unsustainable public sector spending [3, 11]. Other impediments embody persistent implementation failures which have also contributed to poor access rates, unsustainability, poor sanitation and the risks posed to public-health. As a result, Nigeria has failed to attain the Millennium Development Goals (MDGs) set target of 75% for improved water access in 2015 [12]. This is compounded by the drying of lakes and streams due to droughts and climate change impacts that negatively contribute to ecosystem decline and the death of 200,000 toddlers yearly from poor water and sanitation systems [13]. At the same time, flood disasters have become more frequent and destructive during the rainy seasons as well.Considering the implications on ecological health, these problems must be analyzed by a mix-scale approach using Geographic Information Systems (GIS). Given the risks posed to water resources, very little has been done to assess these challenges using GIS. The applications of GIS in that setting can pinpoint the threats and practices impacting water resource quality and availability and the spatial patterns [14-22]. Many studies exist in the literature with focus on water management using GIS [23-27]. In the context of the study area, these themes are essential as Nigeria searches for the right tools for water resource management. The country has for decades, been burdened by the challenges of addressing growing demand for water access and the threats of pollution [28, 29]), due to many factors like weak policy, poor coordination among sectorial agencies, rising population and unsustainable practices. While much of the challenges emanate from unrestrained urban expansion leading to demands for portable water, poor maintenance and negligence of water infrastructure, and the resultant decay continue to threaten water quality [28-32]. In recognizing such deficiency in the literature, many scholars, who identified these problems, not only outlined the risks to ground and surface water in the country, but they reaffirmed the need for continued analyses to boost policy [31]. Based on Nigerian government unmet target of its MDGs agenda in 2015 and the threats posed by a multiplicity of stressors, water resources management has now assumed more relevance than ever in the country [32].Notwithstanding the threats to the environment and public health in Nigeria, no effort has been made to assess the trends from a mix scale perspective built on descriptive statistics and GIS. Without such a geo based approach [33-36], managers can lose sight of locational severity and the tracking of stressors and factors impeding water use. Accordingly, the study adds to the literature by analyzing water management issues in Nigeria using a mix-scale method of GIS and descriptive statistics. There is an emphasis on the issues, environmental analysis, factors fuelling the problems and ongoing initiatives. The paper has five objectives. The first aim focuses on the use of geospatial technology to assess water use, while the second objective is to design a support device for managers. The third aim emphasizes the crafting of novel device for identifying parameters for water management. The fourth objective is to create a framework for water planning using mix scale tools of descriptive statistics connected to GIS. The fifth objective is to analyze water use trends. In terms of organization, the paper is divided into five sections. The first part covers the introduction and background, while the second part highlights the methods and materials. Section three presents the results of data analysis made up of descriptive statistics and spatial analysis of GIS mapping, factors and efforts while section four covers the discussion and recommendations. Section five highlights the conclusions.
2. Methods and Materials
The study area Nigeria (Figure 1) stretches through 923,769 Km2 range of which 13,000 square kilometers is covered by water across 36 states from north to south [5]. With a population of 187 million in 2016 [37], the nation has substantial resources of water bodies [38]. This includes annual water resources potential of 319 billion cubic meters consisting of 272 billion cubic meters (BCM) of surface water and 52 billion cubic meters (BCM) of ground water [39]. While these are large water budgets and definitely large volumes of water flowing through the nation’s rivers, this water provides resources for fishery, transportation, irrigation, recreation and domestic use. With climate ranging between the semi-arid type in the north to tropical and humid in the south. The availability of surface water resources transcends the river systems and catchment areas made up of River Niger, Lake Chad, the South East and South West regions of Nigeria.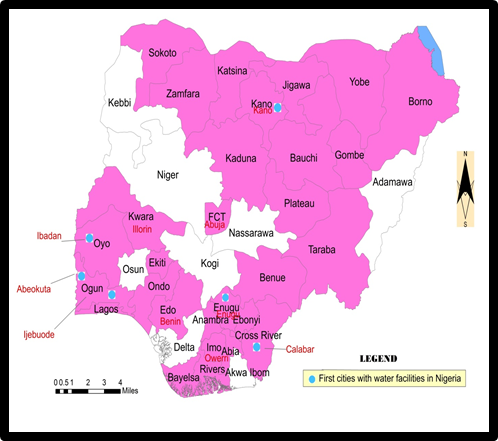 | Figure 1. The Study Area of Nigeria |
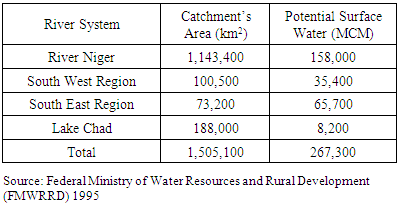
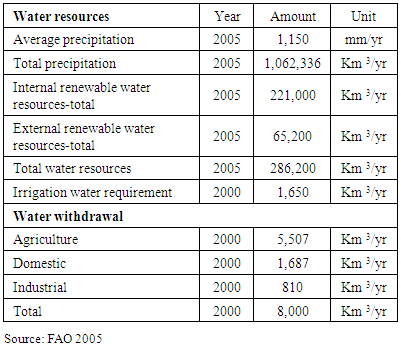
Of the total of 1,505,100 km2 potential surface water resources of Nigeria along catchment areas, River Niger stands out with 1,143,400 km2 to 158,000 million cubic meters in potential surface water areas followed by Lake Chad at 188,000 km2 and 8,200 million cubic meters. Among the regions while the South West and the South East region river systems, cover catchment areas of 100,500 and 73,200 km2, the potential surface water areas show South West with 35,400 compared to 65,700 million cubic meters in the South East region (Table 1). Other aspects of the water trends in Nigeria consist of the index of water resources from precipitation to irrigation needs nationwide and the amount of withdrawal. Accordingly, in the context of water resources in Nigeria between 2000 through 2005, of the total of 286,200 Km3/yr, the country saw a combined water precipitation volume of 1,062,336 Km3/yr at an average precipitation of 1,150 mm/yr. Added to that, comes the quantity of internal and external renewable water resources of 221,000 Km3/yr to 65,200 Km3/yr in 2005 while irrigation water needs in 2000 reached about 1,650 Km3/yr. Water withdrawal total of 8,000 Km3/yr in the year 2000 under three broad areas of agriculture, domestic and industrial highlights an interesting scenario. During that period, the withdrawal levels for the three sectors shows agriculture at 5,507 Km 3/yr as the highest sector, domestic households followed with 1,687km3/yr while industrial activities finished at 810 Km 3/yr in the fiscal year 2000 (Table 2).Table 1. Potential Surface Water Resources of Nigeria
 |
| |
|
Table 2. Water Resources in Nigeria in Km3/yr
 |
| |
|
Aside from Nigeria’s vast deposits of enormous surface and groundwater resources, the average annual rainfall ranges from about 500mm in the north to over 2,000mm in the south. Such uneven distribution of rainfall across Nigeria reflects a significant variation in water surplus when viewing different parts of the country. This rainfall distribution explains the arid and semi-arid conditions of the north, the wet south and the coastal aquifer environments of Nigeria. Regarding the hydrologic sequence, each of these four major ecological zones exhibits unique hydrological challenges. With the northern part of Nigeria vulnerable to the problems of aridity–semi-aridity, which restricts the volume of water available for recharge to the aquifers, the south is burdened with the problems of recurrent flooding, saltwater intrusion, environmental and ground water contamination prompted by the operations of the oil and gas sector. Another twisting to Nigeria’s water problem stems from the risks of a looming stress level of 1,700m3/capita/year. Being a warning sign to countries with rising populations, it seems that Nigeria is gradually getting to very critical levels of water scarcity likely to kick in by 2025. This is attributed to the 3,203m3/capita/year recorded in 1990 which is well above the 1000m3/capita benchmark. Compared to other West African nations, Nigeria is trapped in a very dire state because of her robust population increases. With an average of 400 boreholes drilled daily in Nigeria, there are still also very high risks of water contamination and subsidence [40].The situation has been exacerbated due to demographic pressures coupled with the rising operational and maintenance cost of water infrastructure. With the nation’s population growing rapidly and along with the demand for water. The population growth and urbanization have emerged as key factors fueling the growth in water demand [32]. In all these, the task of providing water supply for the citizenry has remained daunting for decades in a setting in which existing systems of water supply fail to ensure adequate supply and coverage. The water supply challenges are worsened also by the government’s dual roles as both the producer and regulator which stifle competition and efficient delivery through the private sector. While the optimum use of the resource will shield the nation from the menace of drought, flood, erosion and other ecological challenges. Appropriate management tools anchored in a mix scale approach if developed have the capacity to enable the country track and cope with the probable upsurge in water stress. See Appendix 1 for images on the study area.
2.1. Methods Used
The method used in the study stresses the applications of GIS and descriptive statistics in the analysis of water resource issues in a mix scale with GIS mappings to display the trends spatially. The spatial information for the research was obtained from the Federal Ministry of Water Resources, The Food and Agricultural Organization (FAO), The African Development Bank (ADB), The United Nations Economic Commission for Africa (ECA). The World Bank, the United States International Development Agency (USAID), the United Nations Environment Program (UNEP), the Nigerian Society of Engineers and the Lagos State Government. All in all, the data on fresh water withdrawal by industry and the percentage of population with access to safe water, the regional distribution of water by hydrological units was obtained from the World Bank Group and the Food and Agricultural Organization (FAO) water information network. Elsewhere, miscellaneous information on national water trends were procured through Non-Governmental Organizations (NGOs) and the USAID for the periods of 2002 to 2014, while the Federal Government of Nigeria along with the states and multilateral agencies provided the water borne disease, (cholera epidemic) and mortality information. Just as the federal geographic identifier codes of the states were used to geo-code the information contained in the data sets. This information was processed and analyzed with basic descriptive statistics, and GIS with particular attention to the temporal-spatial trends at the state and regional levels in a mix scale. The relevant procedures consist of two stages outlined below. See Appendix 2-3 for more on the mix scale, methods, the steps involved and the GIS approach.
2.2. Stage 1: Identification of Variables, Data Gathering and Study Design
The initial step involves the identification of variables needed at the national and state level from 2000-2016. This is intended to analyze the temporal-spatial aspects of water resource use and the factors shaping access. The variables involve socio-economic and environmental data including the quantity of fresh water, first cities with water infrastructure, amount of surface water, water use in agriculture, industry, and domestic households, used water quantity, projected demand, disparity index, and water deposits from the hydrological units, cases of cholera, deaths from cholera and the percentage of people with access to safe water. The other indicators include ground water resources, water use rate, ground water demand, internal renewable freshwater resources, annual freshwater withdrawals, access to an improved water source, average precipitation, total precipitation, irrigation water requirement, and flows per capita. Additionally, access to databases that are available within the federal and state archives in Nigeria and other NGOs and multilateral agencies quickened the search process. The process continued with the design of data matrices for socio-economic and environmental variables covering the periods from 2000, 2010, 2011, 2012, 2013, 2014, and 2016. The design of spatial data needed for the GIS analysis required the identification of applicable digital state, regional and city boundary lines covering the study periods of 2001-2012 and others. This entailed the gathering of electronic version of available hydrological and land cover maps containing water profile, including water stress, and deficits, ground and surface water, and water distributions in the regions and other spatial units of Nigeria for the periods of 2002-2011. As mentioned earlier, some of the information came from the FAO Aqua stat information system, The Nigerian Federal Ministry of water Resources, USGS and the USAID, the UNEP. This was made possible by the retrieval of spatial data sets of shape and grid files from the Aqua stat, The Food and Agricultural Organization Global Water Resource Information System in digital form using Arc GIS 10.4 and SPSS 20.0. With boundary lines unchanged, a common geographic identifier code was assigned to each of the units to ensure analytical coherency.
2.3. Stage 2: Step 2: Data Analysis and GIS Mapping
In the second stage, descriptive statistics and spatial analysis were employed to transform the original socio-economic and water data into relative measures (percentages/ratios). This process generated the parameters for measuring the volumes, differences, water usage by industry, water borne diseases, flows, access by population, deficit capacity, demands capacity, supply capacity, stress level, fresh water, ground water, usage levels and the trends. This was facilitated by measurements and comparisons of the trends over time. While this approach helps track the levels of use, the tables and graphics highlight potentials, availability, and the number of deaths, percentage of access, projected demands, supply, deficit and stress levels, water withdrawals, distribution of groundwater, flow and per capital usage, water resources and potential surface water resources. The remaining steps involve spatial analysis and output (maps-tables-text) covering the study period, using Arc GIS 10.4. The spatial units of analysis consist of states, regions and the boundary and locations where water usage and pollution is occurring. The geographic data for Nigeria which covered its boundaries and states, also includes ecological data of land cover files, and paper and digital maps from 2002-2016. The outputs of the spatial data were mapped and compared to see the dispersion of the trends, usage, deficit and the socio-economic factors fuelling the proliferation of water management challenges in the study area. Given that the official boundary lines between several states in the country stayed stable, it was possible to assign consistent geographic identifier code to the respective units in order to maintain robust analysis. With its relevance, descriptive statistics was quite instrumental in processing the raw data on environmental variables into final forms. The process helped delineate the spatial locations and patterns of contamination and the sites of water borne disease outbreak, the distribution of industrial pollution, and the dispersal of ground water use and other indicators associated with water use and quality declines in the study area.
3. Results
This section of the paper focuses on temporal and spatial analysis of water trends in the study area. There is an initial focus on sectoral use, availability, groundwater water distribution and projected regional balance, scarcity and water stress. The other portions highlight the challenges of access to safe water nationwide among the states based on percentages of the population and a risk assessment of the outbreak of water borne epidemics in the form of cholera and spatial analysis of the trends and impact using GIS. This is followed by the identification of factors and efforts.
3.1. Fresh Water Use by Sector
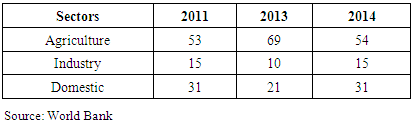
Since 2011, fresh water withdrawal has risen notably in Nigeria with the percentage for agriculture higher than the other areas. Based on information from the table, fresh water withdrawal in the farm sector amounted to 53%, while the allocation level for industry and domestic usage stayed at 15 to 31 percentage points respectively during the same period (Table 3). Further along the years in 2013, the demands from the agricultural sector rose to 69% even though water volume allocations to industry dropped to 10%. The domestic water needs also saw similar declines (at 21%) (Table 4). In the fiscal year 2014, the fresh water distribution patterns for the country followed similar patterns as manifested previously (in 2011). The allocation patterns showed that as 54% of water withdrawal went to agriculture, industry’s demands stood at 15% while domestic usage held firm at 31% (Table 5-6). The gap in water allocation also points to a wide margin between industry and the other sectors (agriculture and domestic). During the three year span (2011-2014) under analysis, water use in agriculture outpaced industry by 38, 59 and 29 percentage points (Table 6). The disparity between domestic usage and industry showed 16%, 11% to 16% gaps in withdrawal volumes during the same period.Table 3. Fresh Water Indicators for Nigeria 2011-2012
 |
| |
|
Table 4. Water Use by Industry in 2013
 |
| |
|
Table 5. Fresh Water Indicators for Nigeria 2014
 |
| |
|
Table 6. Summary of Percentage Change in Water Withdrawal for Nigeria, 2011-2014
 |
| |
|
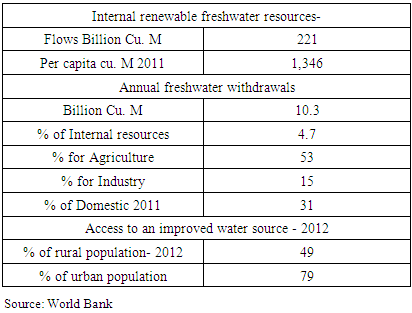
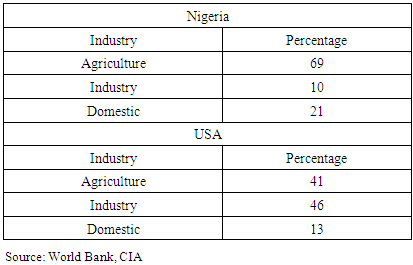
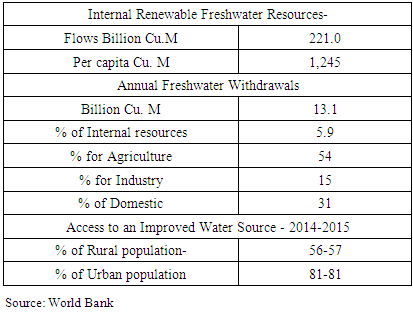
Notwithstanding the dominance of the agricultural sector in water use in the country, comparatively it is clear that there is a big difference between Nigeria and other countries especially the United States of America when it comes to water use by sector. Contrary to the trend in Nigeria, industrial and agricultural usage exceeds the domestic sector in the US. While Nigeria’s fresh water withdrawal for industry stood at 10% in 2013, the country ranks below the global average of 20% in industrial water usage. In comparison, the United States uses 46% of its freshwater for the needs of the industry; this translates into a surge of 30% higher than Nigeria (Table 4). Another way to assess fresh water availability and usage in Nigeria is by looking at the indicators in the Table 3 most notably the internal renewable resources, withdrawals and access. In terms of internal renewable fresh water indicators in 2011, Nigeria had flows of about 221 billion cubic meters and about 1,346 per capita equivalents. This is different from the annual withdrawal levels of 10.3 billion cubic meters. The trends in 2014 involved water flows of 221.cu.m and annual withdrawals of about 13.1 billion cu.m. Added to that is the proportion of rural and urban access to improved water source in the 2012 fiscal year in Nigeria (estimated at 49 to 79 percentage points). Note also that the percent of rural and urban access remained at roughly 56 to 81 percentage points all through 2014-2015.This once again reaffirms the extent of urban-rural divide and disparity in access to improved water in the country (Table 3 and 5).
3.2. Ground Water Distribution
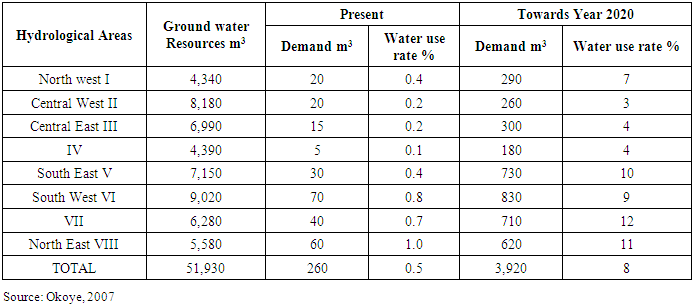
The distribution of groundwater in Nigeria occurs through eight hydrological areas with water resources totaling 51,930 m3. Among the hydrological zones, the first four made up of North West I, Central West II, Central East III and IV contained sizable ground water resources estimated at 4,340 - 8,180 and 6,990 to 4,390 m3. The other group of hydrological areas referred to as the South East V, South West VI, VII and North East VIII also have significant ground water reserves valued at 7,150-9,020 m3, and 6,280-5,580 m3. In comparing the present level of demands for water with a total of 260 m3 and water use rates of mostly less than single digits percentage points, note the large differences between the first four hydrological areas from North West to IV and the remaining hydrological areas from South East V to North East VIII. From the break down, the present demand levels shows the North West I, and Central West II at the identical levels of 20 m3 while the water needs in Central East III and IV stands at 15 to 5 m3. The larger demands for water consists of 30-70 m3 and 40-60 m3 for the second group of hydrological areas. Elsewhere, the corresponding water use rates ranged from 0.4- 0.2 for North West I, Central West II and Central East III whereas the rates for unit 4 stood at 0.1. For the other hydrological unit areas (South East V and South West VI), their demand rates stood at 0.4-0.8 percentage points followed up by units VII and North East VIII with 0.7 -1.0 % (Table 7).Table 7. Distribution of Ground Water Resources in Nigeria
 |
| |
|
In comparing the present trends in volume of water demand and usage rates to the year 2020, there exist substantial differences under the measured categories. Based on the demand and water use rate, under projected totals of 3,920 m3 and 8% nationwide in 2020, note the initial variations in the distribution of ground water volumes (of 290- 260, 300 -180 m3) for the northern hydrological areas. The overall water demand levels of the remaining groups of hydrological units at 730 -830 and 710 -620 m3 for 2020 far exceeds the present levels by very considerable margins. The intense level of water use is evident with projected user rates of 7-3% and 4% for the prime group of hydrological units (North West I, Central West II, Central East III and IV). Among the southern group of hydrological units, both the South East and South West will see a water use rate of 10 -9% followed by 12- 11% usage rates for units VII and North East VIII. With that, it is clear that Nigeria faces severe water stress by 2020 considering the anticipated demands (Table 7). This could have very serious impacts on different life forms in the country’s already fragile ecological zones spread across various regions.
3.3. Regional Water Balance in 2020
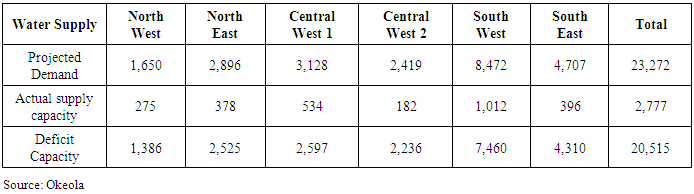
The critical state of Nigeria’s water situation comprises of a whole range of additional challenges including changes in regional water balance projected for 2020 across multiple regions beginning with the north, central and southern regions. Among the regions, the North East and the North West have a projected demand of 1,650 to 2,896 while the Central West 1 and 2 share a projected demand level of 3,128 - 2,419. During the same period in the south, the South West and South East would see demand levels of 8,472 - 4,707. With the actual supply capacity volumes estimated mostly in the hundreds for all regions with exception of the south west with 1,012. Among the other regions (most notably North West, North East, the Central areas and South east), the volume of water supply capacity will stand at 275 -378 to 534-182 and 396. Additionally, the very high water deficit capacity of 7,460 - 4,310 projected in the south for the South West and South East as the table shows surpasses the levels for the Central West 1 and Central West 2 at 2,597-2,236 coupled with 1,386- 2,525 for the North West and North East. See also the differences between total projected volumes for water demand at 23,272 to the actual capacity of 2,777 and a deficit capacity of 20,515 for all the regions in 2020. Even though the deficit capacity for 2020 appeared lower, rising deficits will be relatively common across the various ecological regions regardless of climatic variability (Table 8).Table 8. Regional Water Balance in 2020
 |
| |
|
Such projected level of regional water balance and pattern of stress known for its wide ranging impacts will not only raise the susceptibility levels of many Nigerians to different epidemics, it will ravage agriculture with potential damage to livestock and food production with loss of cereals which livestock depend on. There is also the danger of desertification with encroachment on livable communities and the threats of increased temperature in the midst of reduced access. Given the linkages between changes in water resource availability and rainfall fluctuations along with variations in weather patterns, soil degradation, farm nutrients and infections, the projected scarcities in fresh water availability in 2025 would exacerbate the proliferation of deplorable sanitary conditions across the country. This would come at the expense of ordinary Nigerians coupled with unrestrained dumping of domestic and industrial waste water with the degradation of water quality through elevated levels of organic materials in both surface and ground water. That will increase the occurrences of epidemics of water borne diseases made up of cholera, hepatitis, typhoid and malaria [41].
3.4. Access to Safe Water among the Citizens 2000 -2015 - 2011 and 2010
The importance of the percentage of population with improved water access over the years 2000-2015 time frame is that the country’s access levels never exceeded 59% all through the year 2000 to 2006. Between 2007 through 2015, improved water access among the citizens rose by 61 to 68.5% at levels identical to the rest of sub-Saharan African countries. Beginning in the first four years of the 21st century (2000, 2001, 2002 and 2003), the percentage of Nigerians with improved access to water rose to medium levels (by 51.8, 53, to 54.2, 56.6). In the following years of 2005 to 2006, the numbers jumped slightly from 57.8% to 59. By 2007 through 2011, Nigeria saw further increases estimated at (60, 61.29, 62.12, and 62.94 to 64.5) in the percentage of population with upgraded access to water. The trend continued in the ensuing periods of 2012, 2013, 2014, and 2015 when the provision of enhanced access rose substantially by 65.5 to 66.6 and 67.6-68.5 percentage points. This to some degree reflects the patterns evidenced all through the same time frame among the other countries in the Sub-Saharan Africa region as well (Figure 2).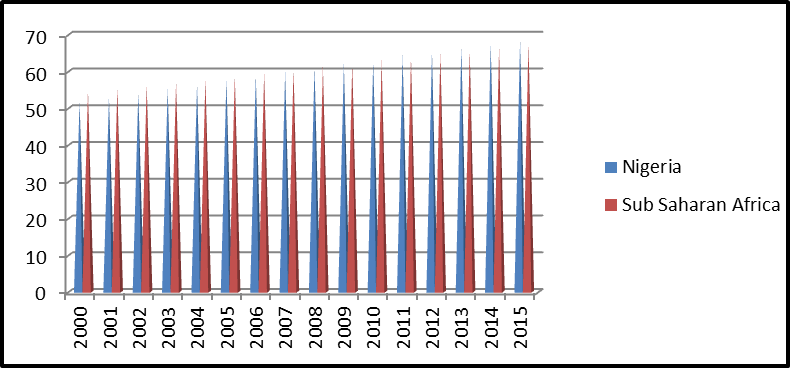 | Figure 2. Precent of People with Access to H2O in Nigeria, 2000-2015. Source: World Bank |
In terms of access to safe drinking water in 2001, note that about 78% - 59% of the population in Lagos and Kwara had more access, coupled with the 55% in Ogun and the 51% in Enugu. Those states with population access to safe water of less than the 50% margin ranged from Enugu to Abia and Taraba which finished under the 10% mark. The regional classification of safe water access points to a southern dominance with a majority of the first six states (78-48% of the population) having safe access in the South West, South–South and the South East despite the lone presence of Kwara in the Middle Belt. From there on comes another group of states under the 42-30 percentage level with a solid mix of far north states of Borno, Jigiwa, Kano to Kaduna along with 13 southern states stretching from Oyo to Akwa Ibom. The great concern in the lower end of the graph, stems from the firm presence of mostly Middle Belt states (Plateau, Benue, Taraba, Kogi, Nassarrawa) along with five other far north states comprising of Zamfara, Kebbi, Sokoto, Bauchi and Zamfara among areas with poor access to clean water (Figure 3).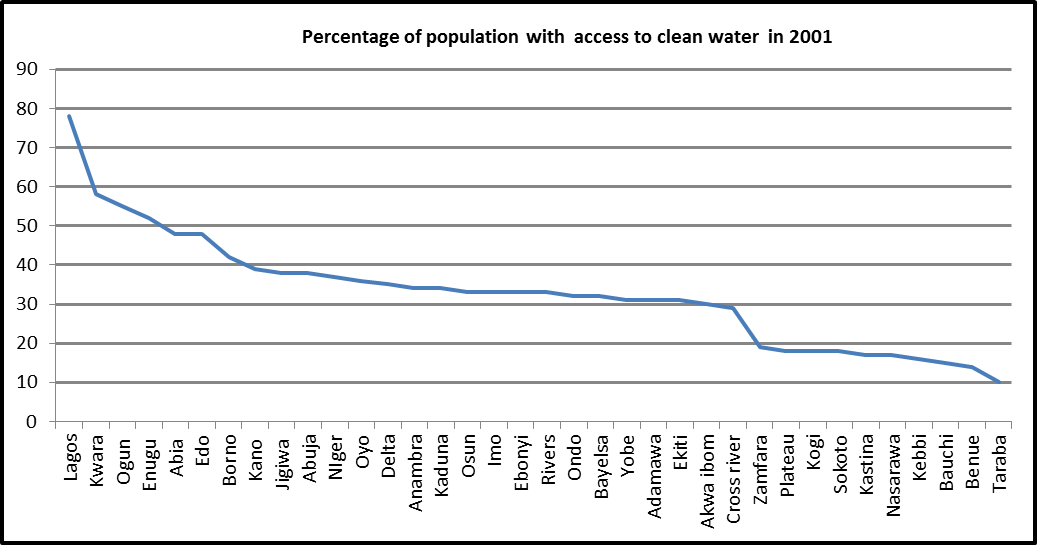 | Figure 3. Percentage of Citizens with Access to Clean H2O in 2001. Source: Okoye, 2007 |
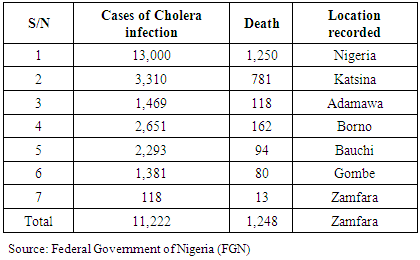
The mounting deprivation of access to drinkable water is also evident with the proliferation of water borne disease epidemic across the northern part of the country. Of the 13,000 cases in reported outbreak of cholera on September 28, 2010, about 1,250 of the victims died mostly as a result of lack of access to potable water in rural areas. Being mostly in the northern part of the country, Kastina topped the list with 781 out of the 3,310 reported cases while Adamawa and Borno followed up with 162-94 casualties and 2,651 to 2,293 infections respectively. Elsewhere, with 1,381 and 118 reported incidents of cholera epidemic, both the states of Gombe and Zamfara saw 80 to 13 deaths mainly from tainted water amongst rural peasants (Table 9).Table 9. Cholera Cases 28/09/2010 (Waterborne Diseases) in Nigeria
 |
| |
|
3.5. GIS Mapping and Spatial Analysis
This part of the paper presents the geographic dimension of water trends and the anticipated impacts in the study area. The spatial coverage ranges from the locations of the first water facilities in the early days of the republic to the current problems as manifested with the levels of water pollution across the states, epidemic outbreak, and the projected stress in the coming years using GIS. The spatial evolution of the first water facilities in 1915 in the country points to a regional pattern spread across the administrative headquarters of the old Northern, Western and Eastern regions. The upper portion of the map shows the city of Kano as the prime site of the earliest water facility during the colonial era. The lower end of the map covering the defunct southern protectorate consist of the cities with the earliest water infrastructure Ibadan, Abeokuta, and Lagos all in the Western region followed by Enugu and Calabar in the Eastern region of Nigeria. From the spatial distribution of the first water facilities, it is clear that many of the earliest water distribution centers established along regional lines showed more presence in the southern part of the country than in the north (Figure 4).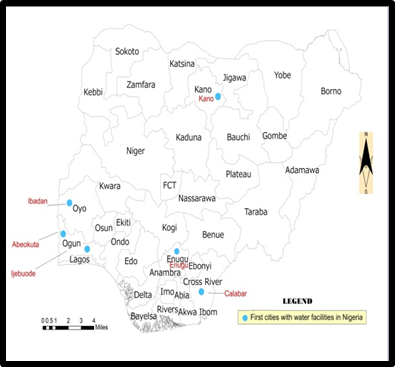 | Figure 4. Location of First Towns with Water Facilities, Source: Ali 2012, Ishiaku, 2011 |
The geographic dispersion of disparity access in water involves more pronounced spread in both the upper and lower south of the map with Kano and Lagos in opposite directions having more access. The trend involves a gradual spread of 81-12 percentage points from both Lagos and Bayelsa to the 97% to 15% levels for Kano and Sokoto states. This once again indicates the correlation between places with established water infrastructure in the old administrative centers and water access than others (Figure 5). With the challenges associated with poor water access in the country, numerous water projects initiated through multilateral agencies including the World Bank and the European Union emerged across the country. The initial projects as shown in the map consist of the ones in the North Central and Middle Belt states of Kaduna and Taraba and the states of Oyo and Lagos in the South West coupled with Enugu and Cross River in the South East and the lower south (Fig 6). Aside from a visible concentration of water projects in progress in the five states of the North beginning with Kano and Jigiwa, Bauchi, Gombe in the upper North and Plateau in the Middle Belt. Down to the south, one notices a cluster of other beneficiaries of water projects in progress spread across in the South Western areas of Ekiti, and Ondo along with Anambra, Abia, Rivers and Bayelsa in the South East and the lower south respectively (Figure 7).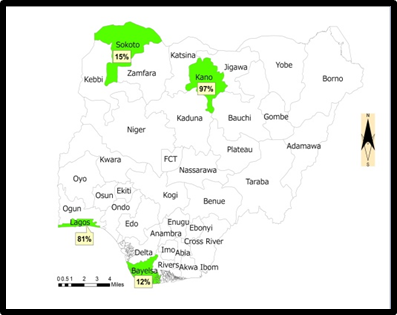 | Figure 5. Water Disparity Index in 2016 |
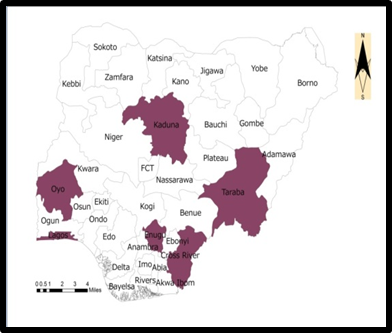 | Figure 6. Water Projects through Donors, the World Bank and EU, Source: Ochekpe, 2013 |
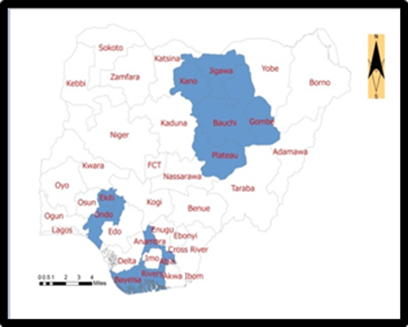 | Figure 7. Water Projects in Progress. Source: Ochekpe, 2013 |
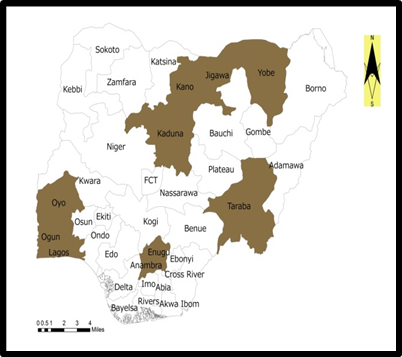
Looking at water projects ready to be commissioned, a completely different pattern emerges with a visible presence in the Middle Belt states of Plateau and Benue along the cities of Makurdi and Mangu in the North central region and the Esan North area in Edo state in the South-South -region. The benefits as the spatial distribution shows involves the hundreds of thousands of population served and the hundreds of job opportunities to be created through regional water supply schemes, Of the areas slated for the commissioning of water schemes, the city of Makurdi in the North Central region or the Middle Belt surpassed others in every category. The categories ranged from population served and the jobs to be created through proposed projects in the designated areas by 833,000-300,000 inhabitants to 250-150 and 159,000-120 (Figure 8). While the European Union assisted small town water projects in Adamawa in the Middle Belt region of the North. Those in Ekiti and Delta in the South West and lower south followed a similar path (Fig 9). Water sector completed projects across the country showed sustained presence dispersed along the upper northern states of Kano and Jigiwa and Yobe in the North West and Kaduna and Taraba in the central area. The south also saw an even spread clustered around five states most notably Oyo, Ogun, Lagos, Enugu and Anambra in the South West and South East (Figure 10).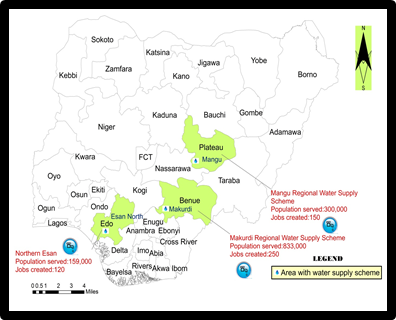 | Figure 8. Water Projects To be commissioned, 2011-2013. Source: Ochekpe, 2013 |
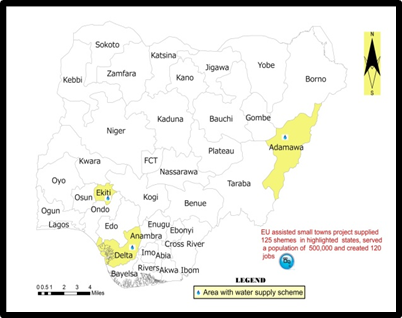 | Figure 9. EU Assisted Small Towns’ Project Supply. Source: Ochekpe, 2013 |
 | Figure 10. Water Sector Programs Completed Source: Ochekpe, 2013 |
Some of the related water projects to curb pollution and depletion in the country consist of those commissioned by the USAID in the South Eastern states of Ebonyi and Rivers (Figure 11). The spatial distribution of cholera outbreak due to tainted water in 2010 highlights the occurrence in the far north states of Zamfara and Kastina in the North West along with Bauchi, Gombe, and Bornu in the Northeast and Adamawa close to the North West. Given a geographic prevalence in the North, of the states impacted by the cholera epidemic, Kastina saw the largest casualties of 731 deaths while Zamfara finished with 13 in the North West region. Along the upper North West, Borno, Bauchi and Gombe experienced notable casualties numbering 180, 94, and 84. This is not different when compared to the trends in Adamawa where the number of deaths stood at 118 in 2010. Within the same geographic patterns, came the thousands of reported cases of cholera outbreaks spread among the affected northern states. While the analogy here reflects reported cases in mostly rural areas in the northern region, that does not in any way imply that the southern part of the country is immune from similar water borne diseases. All in all, water borne epidemics remain quite common in the country (Figure 12).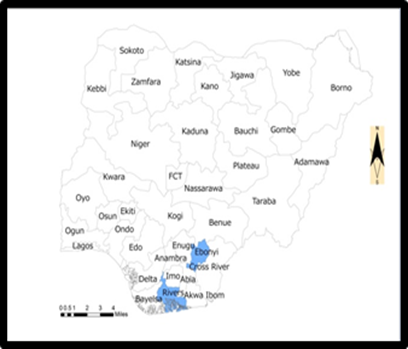 | Figure 11. USAID Projects to Enhance Water Quality, Source: USAI D2014 |
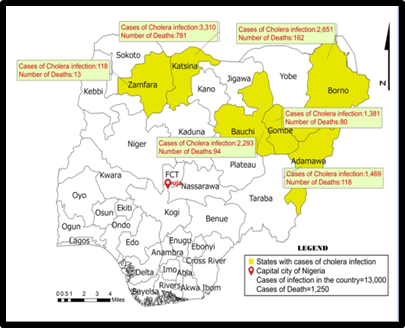 | Figure 12. The Spatial Distribution Outbreak of Cholera. Source: FGN, Ishiaku, 2011 |
With water stressors in the form of industrial sources of pollution spread across the country from the upper Northern cities of Kano and the central area of Kaduna and Ilorin in the Middle Belt and the southern region. It is clear that water pollution risks transcends all regions of Nigeria as manifested with spatial dispersion of industrial pollution sources concentrated in the South West city of Lagos, and Benin and Port Harcourt in Lower southern states of Edo and Rivers. The others include pollution sources in Owerri and Aba in Imo and Abia states in the South East (Fig 13). Having the highest concentration of industries in the nation, it comes as no surprise that the commercial hubs of Kano, Kaduna in the North and Ikeja and Port Harcourt in the south are big contributors of urban wastes threatening adjoining rivers. The impacted river systems threatened from industrial wastes consist of Bompai, Challawa, and Sharawa all in Kano and river Kaduna in Kaduna state. While the river systems in Lagos and Port Harcourt are also in that category, the Lagos Lagoon not only remains overly degraded, but industrial pollution of fresh water environments and the others are spread across areas adjacent to major commercial centers of the nation (Figure 14).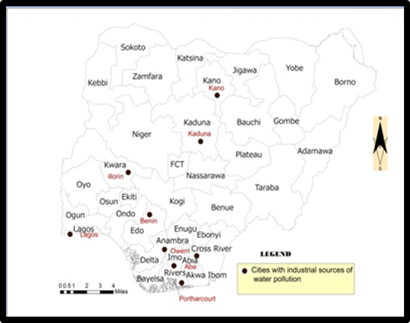 | Figure 13. The Dispersion of Industrial Pollution. Source: Ado, 2015 |
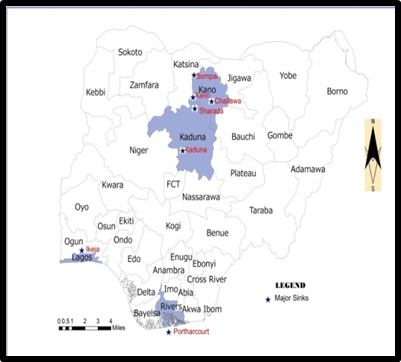 | Figure 14. Major Rivers Impacted by industrial and Urban Waste. Source: Ado, 2015 |
When it comes to water pollution from specific industries devoted to beverage production, there is predominance in mostly southern portion of the map with much of the incidence evident in the western area bordering Ilorin in Kwara state. This continued further onto the lower South West region from the Abeokuta area of Ogun state, Lagos, Edo and the Eastern zone of Imo and Abia states. The breakdown of the stressors consists of higher concentration of bacterial load at Ikpoba River in Benin along with brewery industry effluents and other microbes and pollutants manifested in Owerri, Imo state. Further presence of pollutants comes with high turbidity in both Ogun River mostly from Lagos and Abeokuta and the occurrence in Asa River in Ilorin, Kwara state as well (Figure 15).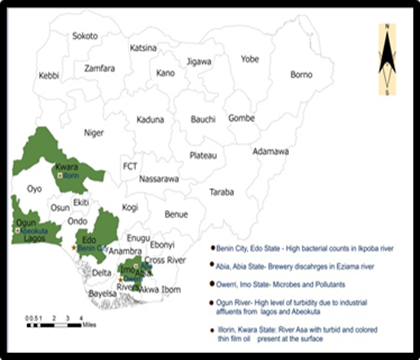 | Figure 15. Beverage Industry Sources of Pollution and others. Source: Ado, 2015 |
Apart from the foregoing spatial trends manifested across the country, compared to other African countries in terms of water access, it is evident that Nigeria faces bigger problems of water scarcity along with some of her neighbors in 2025 (Figure 16). The map indicates the probabilities of water stress and scarcity in yellow and red among the nations with Nigeria likely to the face the former. Regarding the patterns of aquifer productivity, note the high levels in the lower southern part of Nigeria, mostly in the South West, South –South and the South East areas of the country represented in mild blue color of the map. This is different when compared to the low and moderate levels in other parts of the country such as the North West, the Central region and the upper northern zone as well as some areas in the east (Figure 17).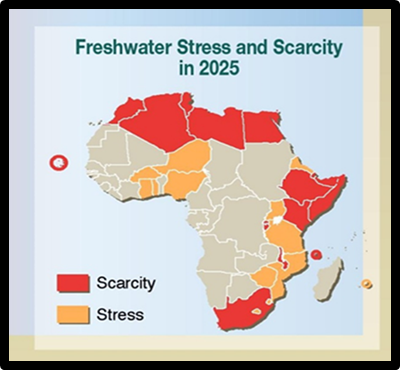 | Figure 16. Figure 16 Frsh Water Scarcity and Stress In Africa. Source: UNEP, UNECA |
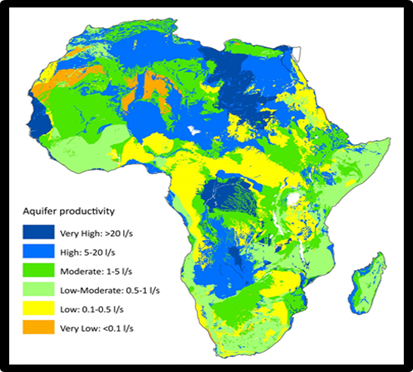 | Figure 17. The Distribution of Aquifer Productivity. Source: ERL |
3.6. Factors Fuelling Water Problems in Nigeria and Efforts
The factors fuelling the water issues in the country are not farfetched; they consist of socio-economic elements of ineffective policy, poor infrastructure, the threats of pollution and rising population. Each of these factors is described herein with a detailed overview in the following paragraphs.
3.6.1. The Deteriorating Level of Water Infrastructure
The deteriorating form of water infrastructure and limited provision of capital to improve water systems appear linked with the present water management issues faced in Nigeria. The country’s 37 water corporation boards and 12 river basin authorities operate with low efficacy in a setting where several of the water agencies still use obsolete water equipment such as pipes, pumps and machinery. Much of the time, dilapidated and inadequate infrastructural shortfall as well as recurrent breakages of water pipes and lack of spare parts results in the poor delivery of water. Even when the pipeline is partly intact, the water flow remains erratic due to lethargic electric power supply which impedes water pumpage to needy consumers. In Lagos where the state water capacity stands at 210 million gallons a day compared to the 540 million gallons needed by Lagosians in the face of inadequate infrastructure [5]. Potable piped water reaches only 7 million people while leaving two-thirds of the city without safe water. With the risks from poor hygienic conditions of communities and the challenges of unsafe water, failing sewage services and waste littering, Nigeria’s water infrastructure also suffered from years of neglect, poor operation and maintenance. The little access to improved sanitation in all these poses public health issue to citizens. This has been largely due to poor investments by government, and non-private sector involvement in the water sector in the last decades in Nigeria, compared to oil and gas. This in turn contributed to the ongoing challenges to water management in the country.
3.6.2. Population Growth Pressures
Nigeria’s major cities and states have all experienced widespread urbanization and growth in the last several decades. Being the largest economy and fastest growing population in Africa, the country faces the overwhelming challenges of providing access to safe water to citizens. With the projected water stress and deficit in 2020 and 2025 and current levels of urban expansion and industrial development. Nigerian major cities now risk the probability of surface and groundwater contamination emanating from run offs through heavy precipitation and other pollutants. Additional concerns revolve around the likelihood of groundwater pollution linked to poor sanitation and sewer systems in majority of the states. As a result, Nigeria’s ability to achieve safe water access under the MDA is impacted directly by its high population growth. With Nigeria’s cities now growing at a phenomenal rate, urban areas accounted for 60% of the population in 2015 compared to 30% in 1990. Lagos, its largest city of over 24 million in 2016 has water deficit of about close to 300 million gallons per day attributed to a high population annual growth rate of five per cent. Such level of population growth triggers the rising need for new housing, and business premises, and demands for fresh water, and the sinking of private bore holes with the risks of salt water intrusion. Other challenges consist of haphazard land development, and the emergence of slums, in areas prone to persistent flooding where run offs from open sewage threaten water quality, and access to safe water for citizens.
3.6.3. The Threats of Industrial Pollution
Nigeria has been facing problems of water quality and standards for the last twenty years amidst commonly held perception of its water as one of the most polluted in the globe [42]. Yet in the heavily industrial hubs of the country, cities like Kaduna, Lagos, Kano, Aba and Port Harcourt where citizens depend very much on their rivers for water supplies, suffer from declining quality emanating from pollution. At the same time, waste generations by the industries have continued to increase. These wastes are not only indiscriminately disposed-off into the water bodies, but this has led to the pollution of inland and coastal waters and the subsequent presence of water quality stressors such as heavy metals, nutrients, soluble ions and oil and grease. Other notable stressors consist of organic chemicals like pesticides and poly-nuclear aromatic hydrocarbons (PAHs). In the process, many factories in Nigeria located on the waterfronts use the rivers as open sewers for their effluents. The major industries responsible for water pollution in Nigeria include petroleum, mining, wood and pulp, pharmaceuticals, textiles, plastics, iron and steel, brewing through distillery fermentation, as well as the paint and food sector. Of all these, the petroleum industry constitutes the greatest threat to water quality. From time to time, the incidence of accidental oil spill continues to endanger local sources of water supply and freshwater resources especially in the rural areas. This is compounded by high loads of coliform from river water samples indicating fecal pollution from domestic sewage, dumpsites and abattoir activities. Another group of organic pollutants in fresh and marine water systems are chemicals classified as endocrine disruptors. Aside from the presence of PCBs and DDTs, the use of pesticides and fertilizer has been linked with nitrate and phosphate pollution of surface water in the country.
3.6.4. Ineffective Policy Since 1979
Part of the factors fueling water problem in Nigeria stems from ineffective policy and monopoly of the water sector by the state. With the federal and state and local governments in Nigeria presiding over all water regulations in Nigeria, there has been no willingness through government policy in restructuring the water sector by encouraging private sector participation. The existing government monopoly not only makes competition and antitrust policies impossible to implement, but it stifles innovation. More so, several of the government agencies in the water sector perform their functions independently devoid of coordination on common issues with other relevant agencies in the same sector. This often results in confusion and inefficiency. Under these circumstances, past water policy reform in Nigeria in conjunction with the World Bank failed. Since urban water supply is constitutionally a responsibility under Nigeria’s constitution, the first generation of World Bank assistance during the past periods was directed at investments and strengthening of institutions at the state level. In the process, several states (Kaduna, Anambra, Bornu and Lagos) from 1979-1989 emerged as beneficiaries. Just as the second generation of assistance (1991-2001) involved the $256 million national Water Rehabilitation Project nationwide, the third one (in 2000-2004), under the Small Towns Water and Sanitation Pilot Project focused on meeting the needs of 16 towns. Based on the initial objectives of the projects all these years, the Independent Evaluation Group (IEG) of the World Bank considers its intervention from 1979 through 2005 to have failed since seven selected case studies under the program were rated as unsatisfactory with negligible development impact. Additionally, many regulations adopted by the previous governments to safeguard the marine environment in Nigeria, have been ineffective in containing the contraventions of surface water and groundwater laws [43].
3.6.5. Efforts
Several initiatives have been put into place by government entities and international development agencies with the active involvement of Federal and state governments as well as the Federal Ministry of Water Resources. This includes a National Water Supply and Sanitation Policy aimed at addressing emerging sectoral problems. This policy, along with many other water resource initiatives, encourages private-sector participation and the expansion and improvement of rural water-supply systems. For the urban water sector, the policy focuses on improving the performance of service providers through institutional and policy reforms at the state level. The Federal Ministry of Water Resources (FMWR) on its part has been instrumental to policy formation, data collection, monitoring and coordinating water supply development, funding research and development. Also, multiple donor and international development agencies play a role in Nigeria’s Water Supply and Sanitation Policy (WSS) sector. Some of the principal participants include the DFID, the United Nations, the African Development Bank (ADB), the World Bank, Japan International Cooperation Agency (JICA), the government of China, and the European Commission. Notwithstanding these initiatives, water problems in the country are far from over.
4. Discussion
The study stressed the extent and nature of water usage and the widespread deprivation, reliance of the various segments of the economy on surface and ground water sources and the existing challenges facing access to water quality, demands and availability. Particularly significant are the linkages of different socio-economic factors comprising of population growth and expansion of cities as well as crumbling and ageing water infrastructure. Other limiting elements consist of the ineffectiveness of the nation’s water policy in guaranteeing access and quality. There is also the risk from industrial pollution and poor sanitation practices as limiting factors threatening the nation’s rivers and estuaries and ground water sources. To execute the research, the study used a mix-scale approach connected to GIS and descriptive statistics and primary data at the state and local level. From the study, aside from vast deposits of ground water resources estimated at 51,930 m3, there exists higher water demand in the hydrological areas and the risks of an impending stress and deficit due to growing usage across regions. The risks of water borne epidemics among the states, the human costs and the dangers they pose were also covered. Based on the results, agriculture and domestic use not only outpaced industries in 2011, 2014 and 2013 as the biggest users of water, the country faces a growing disparity between urban and rural inhabitants, and the various states in terms of access to better-quality water. Added to that, fresh water allocation to industry in Nigeria at 10% ranks below the global level when compared to other places. With both Lagos and Kwara ranked higher than the other states in 2001 in safe water access in the country, between 2000-2015 access to safe water among populations in Sub-Saharan African stayed relatively at the same levels (of over 50% to 66% plus) as in Nigeria.Furthermore, the precarious state of Nigeria’s water situation comprises of a whole range of challenges including changes in regional water balance projected for 2020 and the current distribution of the nation’s ground water resources. Contrary to common wisdom, the trends appear quite critical and compelling in the South West and the South East, compared to the other regions in every category from water supply to deficit capacity. While this may be connected to pressures from large urban centers in areas adjacent to the Southern region, the startling thing is that the projected demand levels in 2020 for every region surpasses the actual supply by a wider margin which in turn translates into huge water deficit capacity. Even though the deficit capacity for 2020 appeared lower, growing deficit will be relatively common across the various ecological regions regardless of climatic variability. The same trend also holds for the eight hydrological areas, holding the nations ground water resources. Considering the vast reservoir of ground water that is intact nationwide, presently the total for the northern unit pales in comparison to the south (South east and South west). With extensive demands and higher user rates spread across the individual hydrological units, the carrying capacity of the environment would be drastically impacted, by overstretching ground water reserves in the country, to the detriment of communities in the face of disparity in access to safe water.The spatial analysis of the trends using GIS mapping, highlighted the geographic diffusion of water pollution sources and locations, the major rivers at risk, the outbreak of water borne diseases such as cholera epidemic and the number of human casualties involved and the spatial evolution of public water facilities in the country. Aside from a spatial display of various initiatives aimed at boosting ongoing and concluded water projects by various foreign funding agencies across the country. The GIS mapping pinpointed clusters of mounting threats to water quality from contaminated sites spread across various states and cities in the country. Included in that category is the geographic dispersion of industrial pollution involving the brewery and food beverage sectors of the economy in the Southern region. While the regional breakdown of the spatial analysis points to an even geographic spread among the south and northern part of the country in terms of completed water projects, cholera outbreak and deaths seemed more concentrated among a handful of northern states. Of great relevance in the GIS mapping is the vast concentration of the earliest water projects in the nation along the southern region. The other significance of the analysis comes from the capability of GIS mapping in pinpointing the threats of water contamination and human costs of water borne epidemics dispersed across the northern region.Seeing that water resource management challenges issues outlined herein did not occur in isolation, the paper identified several factors fuelling it. The factors include the falling state of water infrastructure, growing population, industrial pollution and indiscriminate dumping of waste, coupled with incoherent water policy nationwide. With the growing incidence of water quality decline, and the threats of contamination now a recurrent trend, the projected deficits in ground water volume, and the pressures from increasing ground water demands across regions of the country, and the geographic dispersal of the challenges now looms larger than ever. For that, water resource issues as delineated here on Nigeria should not be ignored any further. The applications of mix-scale approach of GIS mapping and descriptive statistics in analyzing the extent of water management challenges in the nation not only holds promise for future policy research. It reaffirmed the capability of GIS mapping as essential decision support tool in water management for nations and their respective regions and states. Consistent with GIS mapping is the ability to track water resource issues as nations like Nigeria deal with declining infrastructure and other elements hampering regular supply and quality throughout the country. Notwithstanding current efforts by some of the federal and state agencies and multilaterals to address water issues with little success, the paper offered recommendations (in Appendix 4). The suggested areas for improvement consists of the need for effective policy, regular monitoring, design of national water infrastructure and the continual use of GIS in the process coupled with sustainable use and a regional approach to water management.
5. Conclusions
The research emphasized the extent and nature of water usage and the widespread deprivation, reliance of various segments of the economy on surface and ground water sources and the challenges facing access to water quality, demands and availability with several illuminating findings listed in the following order: a) Mix-scale approach quite effective; b) Water issues linked to several factors;c) Fresh water withdrawal has risen notably in Nigeria; d) Several agencies playing vital roles in water management in Nigeria. In outlining the impacts of projected water stress on ground water availability and the deficits in the country by 2020 and 2025, mix-scale model offered deeper insights not seen before for managers. Using descriptive statistics in that way, showed hope in the ability to track the exposure of communities in both the arid Northern region and water rich south to hydrological stress in the face of climate change and rising demands. The belief is that such a grave scenario provides warning signals likely to spur contingency measures among planners. With those projections in place, managers and consumers have at their fingertips critical information on the state of the resource as a guide towards sustainable use in the communities at risk. The exploitation of these techniques in the research along with findings emanating from it, therefore, makes a contribution to our understanding of water management trends in Nigeria and the emerging issues. The feasibility of the methodology is also fundamental regarding the steps needed in optimizing mitigation strategies. For that, the study thus provides the template for intervention among emergency management agencies and water providers in the event of crisis within vulnerable areas. Seeing the extent to which GIS analysis stressed the dispersion of essential water projects in different states. The spatial display of industrial water pollution impacts highlighting threats to major rivers and impairment from water borne diseases and the deaths showed the spread of cholera firmly evident in the upper Northern states compared to other areas of the country. In all these, GIS was helpful in visualizing the origins, projects, pollution threats and stress and aquifer productivity, distribution level and emerging tendencies in the use of water resources. Without such a framework, decision makers face the ordeal of prescribing policies using faulty blueprints at the expense of effective conservation, pollution abatement and access. The display of spatial information, including dimensions associated with water use and quality thresholds, epidemic outbreak, and environmental stressors, in visual form is vital due to its potential as a means of communication. The GIS maps are not only useful in conveying to managers which regions in the country are vulnerable to water stress, but they are useful in showing the states where water degradation and depletion should be tracked for intervention. The factors limiting water use in Nigeria as shown in the research are not farfetched; they consist of socio-economic elements of ineffective policy, poor infrastructure, the threats of pollution and rising population and urbanization. Part of the factors impeding water access in Nigeria stems from ineffective policy and the control of the water sector by the state. The government monopoly of water regulations in Nigeria and unwillingness to restructure the sector through privatization and innovation constitutes a setback. The deteriorating water infrastructure and the limited provision of capital to improve water systems do diminish usage in Nigeria. While the issue of rising population and poor sanitation conditions threaten quality, the pressures of urbanization in various states accelerates dumping of wastes into surface water environments, this in turn lead to significant risks to the hydrology. While pinpointing the risks posed by these set of constraints, would benefit regulators in crafting standards for monitoring the quality of head waters. Ignoring those constraints compounds the challenges of mitigation at hand even further. Considering that the various factors associated with the use of water in the study area were not identified previously, their role in influencing water access merits the attention of managers. In light of this, this study not only finds a practical use, but the design of index of water use and access outlining the constraints could emerge as a priority for managers. The ability of this project to unveil elements behind water problems in country also reaffirms the study’s promise in helping identify predictors of water stress and quality degradation. Accordingly, the description of factors herein not only provided policy tool for managers, but it furnished information on impediments to water quality and ground water use. The belief is that decision makers are provided opportunities for developing effective responses towards the containment of water quality declines, ground water depletion and unsustainable use. Furthermore, raising awareness on limiting elements also offers stakeholders from state water agencies to multilaterals the devices for understanding the critical issues faced in managing the nation’s water resources. This will not only enable cities and states design plans for sustainable uses, but the acknowledgement of these factors helps identify the human cost of water quality declines and vulnerability of the nation’s hydrology to stressors. One major thing that emerged from this research, which is also an important study contribution, touches on the provision of information detailing the growing pace of water consumption in Nigerian over the years. In 2011, fresh water withdrawal grew among the different sectors including agriculture, industry and households. Of these sectors, withdrawal rate for farms outpaced others significantly. The distribution patterns shows withdrawal in the farm sector at 53% while the rates for industry and households stood at 15 to 31%. In 2013 when farm use of water rose by 69%, industrial and households distribution fell to 10-21% respectively. Because the levels of disparity in water provision shows widespread difference between industry and the other sectors. Periodic awareness of these snapshots in water budgets as shown in the research for managers provides opportunities to gage disparities and address the imbalance among competing sectors as in other countries. With industrial growth the center piece of development in Nigeria, the sector, the business community and the water agencies will be hard pressed to reverse such unequal delivery when majority of industries from manufacturing to mining are highly dependent on water for their daily operations. Knowledge of these trends in this study serves a useful purpose for strengthening water policy more than ever in a country where many are still unaware of the links between industrial wealth and adequate water supply. This comes at a time of impending uncertainty from water stress and the fallout from climate change. Considering that Nigeria’s industrial water use ranks below the global average of 20%. Awareness of such anomaly in the distribution patterns is capable of getting Nigeria in line with international standards in a manner that is consistent with developed nations in the efficient use of water. By calibrating these indices for the purposes of aiding access and quality improvement, the study does fill a void in a relevant area. This will allow for a quick appraisal in the display of deficits and stress levels in drought prone areas. In critical situations, such an approach affords managers a framework for promoting water conservation. Being the pathway for measuring change, the finding serves the needs of planners in weighing the emerging patterns and their impacts on communities. Keeping managers abreast of change patterns in this way enhances their ability to track competing uses and gage whether current practices are sustainable enough to the benefit of communities. Considering that several government agencies in the water sector operate independently without coordination on common issues with other entities in the same sector. Many initiatives have been put into place by government entities and multilaterals. This includes a National Water Supply and Sanitation Policy aimed at addressing emerging sectoral problems such as water quality access in the country and the active involvement of multilaterals in the funding of programs for needy communities in Nigeria. Seeing the activities of these agencies in facilitating water management and access, the outcome of those programs offers a template for undertaking similar initiatives in communities struggling with quality water supply in the country. The procedures involved in the implementation of such projects and the lesson learned provides the pathway for managers across Nigeria in assessing the extent to which targeted communities benefit from such programs. From such initiatives, managers will have enormous chance to appraise the opportunities and challenges across time by assessing their impacts with regular preparedness. Being a step forward toward mitigation and water access, the documentation of the water projects involving multilateral agencies and the mixed results that followed them, offers a food for thought and the search for solution towards improved water access across the country. Awareness of these trends as shown herein optimizes the capability of policy makers in tracking the effectiveness of donor agencies and local institutions in water management. This would allow states and communities design the right measures for improving existing strategies. Seeing the crucial role of donor agencies in the face of limited access to drinkable water across northern part of the country, great opportunities exist in strengthening water management institutions in the country. Being a step forward toward mitigation, the documentation of the success and challenges of institutions, helps improve the readiness of policy makers to reassess the role of limiting elements in shaping access. This will benefit states and communities in the quest for right partnerships and measures for improving water management. Taking into account the growing water needs in the country and the vast potentials in water resources in particular and the problems posed by lack of access and the probability of stress and what emerged from this study. Policy makers and planners in the regions and various states would be tasked in the periods ahead to seek urgent responses to many pressing questions that are useful to water resource management. The questions involve: How would climate change impact water access? What scale would water stress assume? What would the geographic dimension of water stress be like across the regions? What are the economic predictors of regional water stress? Seeing the framing of these questions, there are ample probabilities from all these for the academic community and policy makers to redirect the strategy on water resources management with policies emphasizing efficient use and continued access for communities. This will enable the country fulfill the national mandate on sustainable water access with good results in the years ahead. To that end, the paper suggests the need for improved policy, regular monitoring, the design of infrastructure and a regional water information system, sustainable use, conservation and regional cooperation.
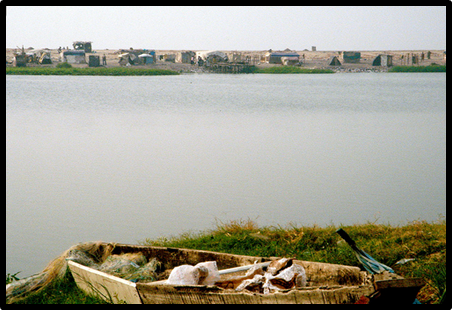
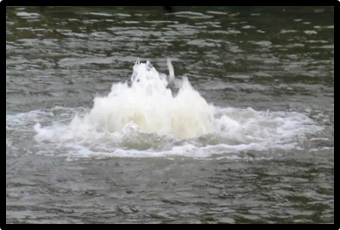
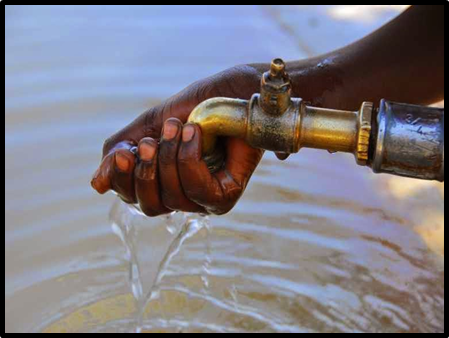
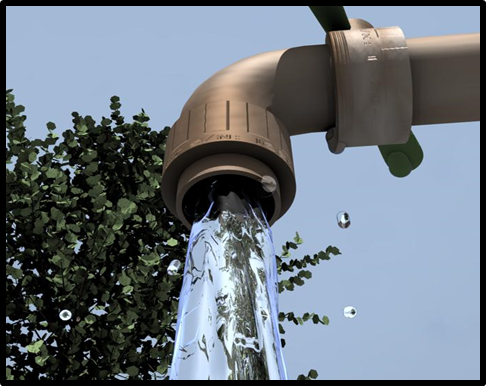
Appendix - 1
2. Images of Water Issues in the Study Area (Contd)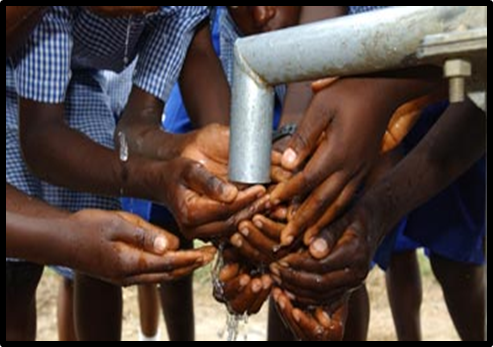 | Image 1. Challenges of Water Access Among School Children. Source: UNICEF |
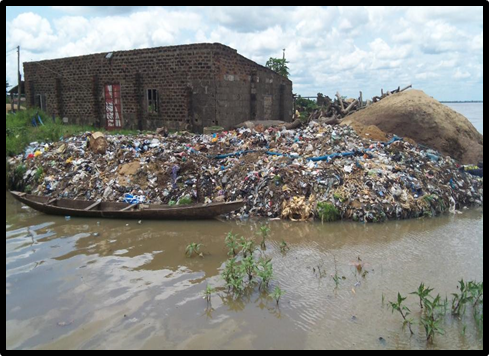 | Image 2. Open Dump Site Adjacent to Surface Water and an Impediment to H2O Access |
 | Image 3. Lagos Lagoon Unclean and Threatened By Pollution in the South West |
 | Image 4. Gas Leak From Under Water Pipeline in the Niger Delta. Source: NAN, 2016 |
 | Image 5. The Quality and State of Water Infrastructure |
 | Image 6. ADB Water Project In Zaria, Kaduna State, Northern Nigeria |
Appendix - 2
2.1. Mix Methods and Steps Involved (Contd)2.1.1. Mix Scale Approach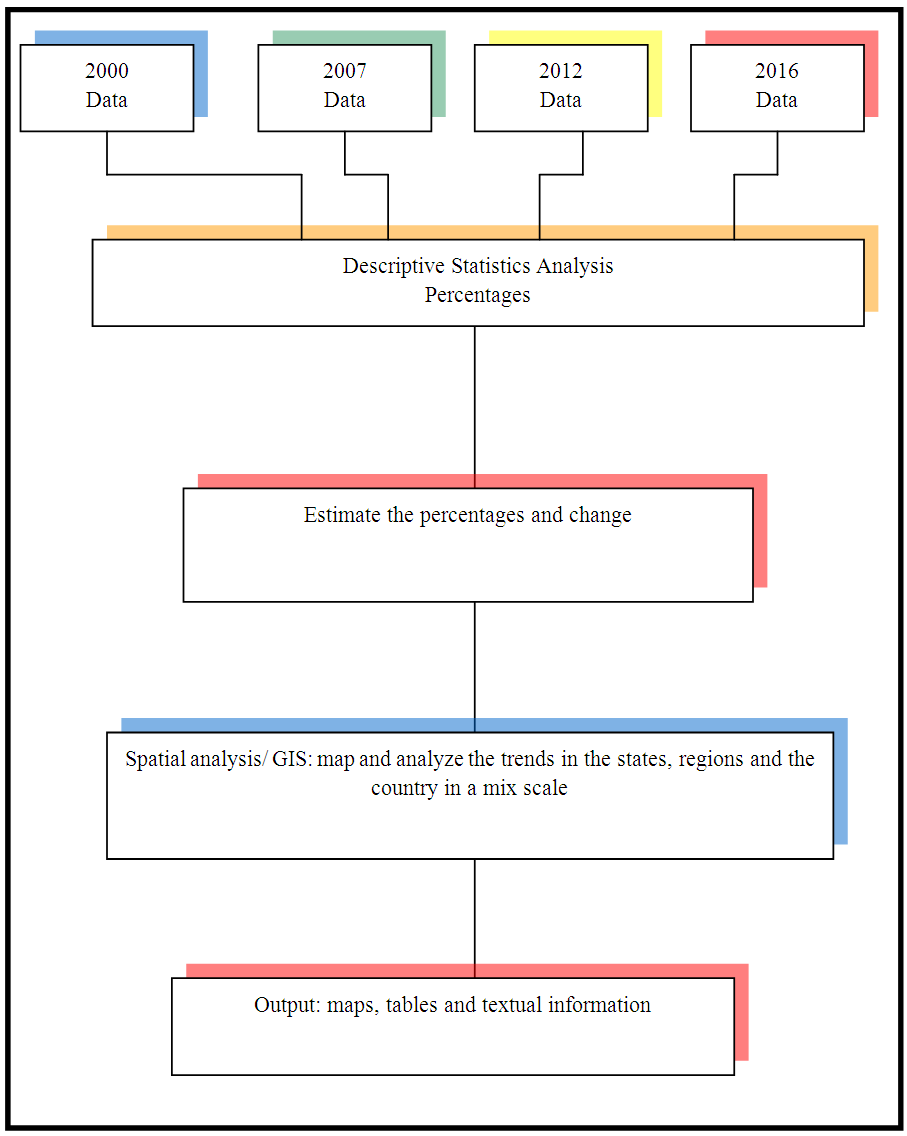 | The Steps Involved in the Mix scale Data Analysis |
The mix scale approach as highlighted involves serial coverage of states and regions, on the one level and the nation on another using basic descriptive statistics and GIS. Because patterns of water use and access in a single nation may not be a true reflection region wide and in the states. Collecting data on water use on multiple levels in the study area through various sources offers reliable path to gage the prevailing trends. In the process, the analysis focused on a mix scale with highlights on water trends in individual states recurrently and the region as a whole over time. With the various stages involving a gathering segment under different periods, there is also the handling and the actual data analysis on various scales. See the flow chart for a summary of the process and the steps involved.Considering that the information assembled as a result of the implementation of these tasks formed the basis for the results and the discussions and the conclusions presented. The steps entailed the initial grouping of data sets under different periods starting from 2000, 2010, 2013, and 2016 followed by the transformation of the information into relative forms of percentages through descriptive statistics at the state, national and regional scale. While this process helped show the tabular portrait of various forms of water use with the trends and challenges in Nigeria and the various states and regions. The GIS component illustrated the visual representation of water use or hydrological indicators, water stressors, the trends and the patterns and programs. Additionally, the emergent spatial patterns in the country were identified under different dimensions (represented in white, yellow, blue, green, grey, pink) denoting various levels of activities based on water projects and the issues as manifested by the epidemic outbreaks, pollution threats, deaths and infections from water related ailments. The remaining steps involved spatial analysis and output (maps-tables-text) covering the study period, using Arc GIS 10.4 and SPSS 20.0. Given that the spatial units of analysis covered 36 states in the country. GIS as used here remained vital for mapping and analyzing the geographic data. They are versatile tools for studying many types of information and for managing several kinds of resources essential to the sustainability of water resources in a country, its regions and states. Assessing the situation in Nigeria using such tools is a vital contribution to water management strategies.
Appendix- 3
2.1.2. Benefits of GIS Methodology (Contd.)The GIS mapping highlighted the spatial distribution of water use parameters, the trends, initiatives, issues and the threats to quality access in various states and regions of Nigeria and the proximity of the states under a common geographic grid. In the current study, the availability of temporal spatial data and analysis played a vital role in facilitating the analysis of water use and the potentials in terms of hydrological resources in Nigeria and deficits over time. The assemblage of the information and analysis using the mix-scale methodology as an emerging approach devoted to the study area, not only quickened the data processing stage of the study, but it unveiled a view of the tapestry of water use and the challenges to quality access and different scenarios in a way not seen before in Nigeria. It is essential for decision making through timely access and effective water management. In the study area, this involved the generation of maps that identified various indicators such as evolution of the first water works in the country, water programs, spots of industrial pollution and waste discharges, pollution sources, water stress, water epidemics, and deaths from contamination. Visualizing the vulnerability of the nation to a projected water stress and the propensity of the regions, and states to water pollution and the outbreak of epidemics, along with dispersal of various water programs, not only helped focus the scope of GIS analytics and water management planning with records of common trends in affected areas, but it furnished information on the pace at which the hydrologic potentials and management issues of the country are evolving. For the purposes of planning, spatial analysis offered a visual documentation of the genesis and the state of water programs, the issues impeding quality access through pollution, epidemic outbreaks and the fatalities at precise locations on different aspects of water management challenges across regions and the states and the nation. With the capability to generate temporal spatial information, this perspective serves the needs of decision makers in weighing the gravity of looming exposures to water stress patterns, and the impacts of degradation on major head waters and hydrological units of the country.
Appendix - 4
4.1. Recommendations 4.1.1. Improve Water PolicyNigeria’s water policy for decades has suffered from ineffectiveness, poor regulatory enforcement of standards and limited use of command and control measure to ensure efficiency, conservation, metering, quality and access nationwide. Accordingly, the state of Nigeria’s surface water environments beginning from Lagos Lagoon and the major rivers in the North most notably Kano and Kaduna, Benue and the ones in the coastal areas like Warri and the Southeastern region with widespread presence of industrial and human waste, buttresses the dismal state of the policy framework. Added to that, the federal policy on water along with states and local initiatives coupled with multilateral involvement has little to show for the hype surrounding it. Even though state water agencies were established to develop and manage water supply facilities within their respective jurisdictions to meet sound financial objectives, piped sewerage is almost non-existent with the exception of some places in Lagos and Abuja. Still, the operational efficiency of most of the State Water Agencies (SWAs) is low and unaccounted for. Given the ambiguity surrounding the working structure, SWAs often find it difficult to be operationally autonomous from the state government. In lieu of the anomalies, the country will benefit from an improved policy anchored in the observance of command and control measure, polluter pay principle and best management practices, sustainable water use and conservation, willingness to pay and the metering of water supply among consumers. 4.1.2. Regular MonitoringSeeing the increasing dangers of pollution and projected water stress and poor sanitation, water agencies need to undertake steady monitoring to gage the extent of water resource usage in their jurisdiction. Regular appraisal of the level of water usage and the emergent risks linked with demand are important aspects of sound water management for the wellbeing of millions of Nigerian citizens and their surrounding ecology. If the Federal government of Nigeria has been furnishing the public periodic update on its annual water budget in terms of surface and ground water availability and the actual quality and the potential hazards of misuse, the haphazard sinking of bore holes, dumping of wastes into rivers and poor management practices and unhealthy sanitary conditions, leading to recurrent outbreak of water borne epidemics, and the eventual loss of lives in various states and the limited access to safe water would have been prevented. Those moves have potentials to augment best management practices essential for access to safe water, conservation and life saving measures in rural communities threatened by epidemics and projected exposure to water stress and deficits in 2020-2025. For efficient management of the resource, the research suggests steady tracking of water resources budget comprising of ground and surface water and other sources. 4.1.3. Provide Data Infrastructure and Design Water Resources Information System During commencement of this study, there was no local or federal data clearing house on water and ground water resource assets such as aquifers and the impacts of population growth on them. The available facts on groundwater resource use and degradation were fragmented in different locations and sometimes in foreign repositories. A country as large as Nigeria should start managing information on its hydrological assets. Given its strategic nature, water data is a guarded item and security asset in hydro-politics and should be treated so. As a remedy, it is suggested that Nigeria improve existing environmental technologies and strengthen public access to data on water use, deficits and contamination and the risks from climate change stressors. This should improve the capacity to undertake risk analysis and monitoring of water use and the threats from contamination sources in the country. There is also a need for more GIS data on water use and the impacts of human activities. Without access to such a spatially referenced system, decision makers and water managers and the carriers of water, serving communities would not know the location and severity of degraded areas adjacent to ground and surface water deposits. This would sharpen the readiness of regulators in reviewing policy violations while ensuring compliance with GIS as a management tool in future endeavors.4.1.4. Sustainable Use, Conservation and Regional Cooperation From the current experience of Nigeria and the fact that it is endowed with enormous sources of surface and ground water, no part of the country or regions are immune from the menace of water stress and the potential threats of depletion and pollution. Realizing that about 200,000 toddlers die from water borne epidemics like cholera annually in the county and a large city as big as Lagos still gets much of its drinking and fresh water supply from neighboring Ogun River, in Ogun state beyond its borders because its fresh water sources including the Lagoon and others are so highly tainted with industrial toxics and human waste. It is clear that access to safe water not only extends beyond local boundaries, but no state can manage water resources solely successfully in the absence of involvement and cooperation among neighbors. As a result, there is a need for sustainable water use built on conservation and regional cooperation involving known users such as states, farmers, households, industry and institutions and public works and municipalities who often influence the use of water in most areas. Regional cooperation as demonstrated in such interstate agreements improves common attitude on water supply in the spirit of sustainability and conservation principles of reuse and recycling. This would go a long in curbing the decadence and confusion impeding the working structure of water management and improve quality and access in the country.
Acronyms
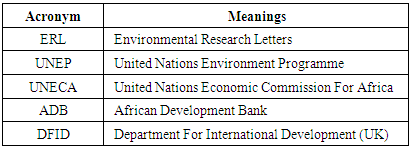
References
| [1] | Ishaku, H. (2010). Community Participation: Alternative Approach to Water Supply in Rural Communities. Paper Presented at 15th International Conference on built Environment in Developing Countries. Pulau, Pinang:1-2 December, 1-13. |
| [2] | Ishiaku. H. (2011 August), Water Supply Dilemma in Rural Areas: Locking Towards the Sky for an Answer: Journal of Water Resources and Protection. 3: 8:596-606. |
| [3] | United States Agency for International Development (USAID). (2010). Nigeria: Water and Sanitation Profile. Washington, DC: USAID, 1-4. |
| [4] | Ali, K. A. (2012) Development of Water Supply Infrastructure in Nigeria: Challenges and Prospects. Lecture Delivered at the Nigerian Society of Engineers October Lecture. October, 4. |
| [5] | Vanguard (2014 November). Lagos Has 300 million Gallons of Water Deficit Per day By LCWC Boss. Retrieved On 14th November 2014 from http:www.vanguardr.com/2014/09/lagos-300m-gallons-water-deficit-per-day-lswc-boss/. |
| [6] | Ibukun, Y. (2015 January). Nigeria Water Shortage Is Bigger Killer Than Boko Haram: Cities. Bloomberg. Retrieved On January 14th 2015 From https://www.bloomberg.com/news/articles/2015-01-26/nigerian-water-shortage-is-bigger-killer-than-boko-haram-citiesm. |
| [7] | Muta’aHellandendu, J. (2012 August). Health Implications of Water Scarcity In Nigeria. European Scientific Journal 8:18: 111-117. |
| [8] | Okeola, O.G. (2014). Ground Water Resources In The Nigeria’s Quest For United Nations Millennium Development Goals MDGS and Beyond. Journal of Sustainable Development in Africa. 16:4:58-62. |
| [9] | Ebiare, E. (2010). Water Quality Monitoring: Case Study of Nigeria’s Industrial Cities. Journal of American Science .6:4: 22-28. |
| [10] | Taiwo, A.M. (April, 2012.) Surface Water Quality Monitoring in Nigeria: Situational Analysis and Future management Strategy pollution. Water Quality Monitoring and Assessment. Intech, 301-320. |
| [11] | Onugbu Abraham (2009). Case Study Challenges of Inter-Sectoral Monitoring of Development In The Provision of Water and Sanitation Services of Nigeria Knowledge Management For Development Journal 5:3:272-278. |
| [12] | Bademosi, A. (Dec 14, 2015). MDGs: Nigeria Failed 75% Target On Access to Water. Nigerian Tribune. |
| [13] | Pulitzer Center. (2011September).Nigeria's Water and Sanitation Sector: Leaks and Plugs. Washington, D:C: Crisis Reporting Center. |
| [14] | Merem E.C. (2014 June). Analyzing Water Issues in The State of Mississippi. British Journal of Applied Science & Technology 4: 2: 3179-3216. |
| [15] | Merem, E.C. (2016). Assessing the Environmental Impacts of Agricultural Subsidy in the Mississippi Delta Region Using GIS. International Journal of Agriculture and Forestry. 6:1:1-21. |
| [16] | Merem E.C (2015 March). Analyzing Environmental Issues In The Lower Savannah Watershed, In Georgia and South Carolina. American Journal of Environmental Engineering. 5:1. 1-20. |
| [17] | Merem, E.C. (2012 September). Using Geospatial Information Systems in Assessing Water Quality In The Mid-Atlantic Region Agricultural Watershed of Maryland. The International Journal of Ecosystem. 2:5: 112-139. |
| [18] | Merem, E.C. (2012 October). The Applications of Geo-Info Systems to gauge The Susceptibility of Coastal Areas in Louisiana and Mississippi. The American Journal of Geographic Information Systems. (AGIS) 1:3:46-65. |
| [19] | Merem, E.C. & Twumasi, Y.A. (2011 June 23rd). The Applications of GIS in the Analysis of the Impacts of Human Activities on South Texas Watersheds International Journal of Environmental Research and Public Health 8:6: 2418-2446. |
| [20] | Merem, E.C. & Twumasi, Y.A. (2008 December 31st). Using Spatial Information Technologies as Monitoring Devices In International Watershed Conservation along the Senegal River Basin of WestAfrica The International Journal of Environmental Research and Public Health, 5:5: 464-476. |
| [21] | Merem, E.C. & Twumasi, Y.A (2008 March).Geospatial Information Systems Analysis of Regional Environmental Change Along The Savannah River Basin of Georgia; International Journal of Environmental Research and Public Health. 5: 1:281-294. |
| [22] | Merem, E.C. & Twumasi, Y.A.(2006).GIS and Remote Sensing Applications in The Assessment of Change Within a Coastal Environment in The Niger Delta Region of Nigeria. The International Journal of Environmental Health and Public Health. 3:1:98-106 14. |
| [23] | Biswass, S. (2002). Remote Sensing and GIS Based Approach For Watershed Conservation. Journal of Survey Engineering. 3:108-124. |
| [24] | Prakash, AK. (2007). Deciding Alternative Land Use Options in a Watershed Using GIS. Journal of Irrigation Drainage Engineering. 133:162-174. |
| [25] | Usery, EL. (2004). Geophysical Data Resampling and Resolution Effects on Watershed Modelling: A Case study Using Agricultural Non-Point Source Pollution Model. Journal of Geophysical Systems. 6:289-306. |
| [26] | Kwalie, M. (2005). Watershed Characteristics and Fabrics. The Application of Remote Sensing and Geographic Information Systems. Lakes and Reservoirs Resource Management. 10:85-92. |
| [27] | Lovejoy. S. B. (1997). Watershed Management for Water quality Protection: Are GIS and Simulation Models the Answer? Journal of Soil and Water Conservation. 52:2:103. |
| [28] | Helmer, R. (1997). Water Pollution Control A Guide to The Use of Water Quality Management Principles, Case Study IV: Nigeria. Narobi, Kenya: United Nation Environment Program (UNEP/WHO). |
| [29] | Oteri, A.U.(2003 April). Salt Intrusion into Coastal Aquifers In Nigeria. Paper Presented In second International Conference On Salt Intrusion and Coastal Aquifers: Monitoring, Modeling and Management, Merida, Yucatan: Mexico 1-6. |
| [30] | Irokalibe, G. (2008). Water Management in Federal and Federal Type Countries: Nigerian Perspectives. Pretoria, SA: Environmental Law Research Institute, South African Institute of International Affairs. pp 1-33. |
| [31] | Ezabasilli, A.C.C .(2014 February). Water Resources Management and Strategies in Nigeria. AFREV STECH 3:1: 35-53. |
| [32] | Akpor, O.B. (2011). Challenges In Meeting The MDGs The Nigerian Drinking Water Supply and Distribution Sector. Journal of Environmental Science Technology.4:5:480-489- 20. |
| [33] | Merem, E.C. (January 2012). The Use of Geospatial Information Systems In The Analysis of Pollution Trends in Southern Mississippi Region. American Journal of Environmental Science and Engineering 1-1-14-29. |
| [34] | Merem, E.C. &Twumasi, Y.A.(2005 December c). GIS Based Analysis of Growth Management and Environmental Decline of Central Mississippi Region. Geographic InformationSciences. 11: 2:130-137. |
| [35] | Merem, E.C. (2012 September). Using Geospatial Information Systems in Assessing Water Quality In The Mid-Atlantic Region Agricultural Watershed of Maryland. The International Journal of Ecosystem. 2:5: 112-139. |
| [36] | Merem, E.C. & Twumasi, Y.A. (January 2012). The Use of Geospatial Information Systems in the Analysis of Pollution Trends in Southern Mississippi Region. American Journal of Environmental Science and Engineering 1-1-14-29. |
| [37] | Merem, E.C. (2016 March). Assessing the Ecological Effects of Mining in West: The Case of Nigeria African Proceedings of 24th AEHS Conference, San Diego: CA. |
| [38] | Okoye, J.K. (2007 March). Background Study on Water and Energy Issues in Nigeria to Inform The National Consultative Conference On Dams and Development. Abuja, FCT: Federal Ministry of Agriculture and Water Resources 1-92. |
| [39] | Ochekpe, S. (2013). Mid Term Report on Water Sector Transformation 2011-2013. Presented at The 2013 Ministerial Platform, Federal Ministry of Water Resources. Abuja, FCT: National Press Center Radio House. |
| [40] | Ogunmesan, T. (January 2016). Water Expert Advocates Regulation of Drilling Industry, Nigerian Tribune. |
| [41] | Building Nigeria’s Response to Climate Change (BNRCC), (2008). The Recent Global and Local Action on Climate Change. Paper Presented at the Annual Workshop of Nigerian Environmental Study Team (NEST): Abuja, FCT: Nigeria; 8-9th October, 2008. p2-4. |
| [42] | Ajai, O. (2012). Law, Water and Sustainable Development Framework of Nigerian Law. Law Environment and Development Journal 1:8:89. |
| [43] | Adah, P.D. (2013). Challenges of Urban Water Management in Nigeria: The Way Forward, Journal of Environmental Sciences and Resource Management, 5:1.111 - 121. |

 Abstract
 Reference
 Full-Text PDF
 Full-text HTML