-
Paper Information
- Next Paper
- Previous Paper
- Paper Submission
-
Journal Information
- About This Journal
- Editorial Board
- Current Issue
- Archive
- Author Guidelines
- Contact Us
Geosciences
p-ISSN: 2163-1697 e-ISSN: 2163-1719
2017; 7(1): 7-19
doi:10.5923/j.geo.20170701.02

Time-Lapse Seismic Acquisition in the Niger Delta: Challenges and Successes
 Abstract
 Reference
 Full-Text PDF
 Full-text HTML
G. I. Alaminiokuma, W. N. Ofuyah
Department of Earth Sciences, Federal University of Petroleum Resources Effurun, Warri, Nigeria
Correspondence to: G. I. Alaminiokuma, Department of Earth Sciences, Federal University of Petroleum Resources Effurun, Warri, Nigeria.
| Email: |  |
Copyright © 2017 Scientific & Academic Publishing. All Rights Reserved.
This work is licensed under the Creative Commons Attribution International License (CC BY).
http://creativecommons.org/licenses/by/4.0/

Time-lapse seismic technique (4D seismic survey) has been employed to a certain extent in the Niger Delta to acquire high quality seismic data. This has helped to minimize differences in the seismic data with previous 3D and positively affected factors related to production, preserved and resolved differences in the reservoirs that are due to production, improved acquisition parameters and processing techniques. 4D seismic survey, when integrated with other subsurface information, can unify reservoir performance data and optimize geological models. In view of the overwhelming benefits of 4D seismic survey techniques, it is recommended that multinational oil and gas prospecting companies carry out a reshoot of all their previously shot fields to be able to utilize the robust capabilities of these techniques.
Keywords: Time-Lapse, 2D Seismic, 3D Seismic, 4D Seismic, Reservoir, Challenges, Successes and Niger Delta
Cite this paper: G. I. Alaminiokuma, W. N. Ofuyah, Time-Lapse Seismic Acquisition in the Niger Delta: Challenges and Successes, Geosciences, Vol. 7 No. 1, 2017, pp. 7-19. doi: 10.5923/j.geo.20170701.02.
Article Outline
1. Introduction
- A time lapse seismic survey compares two or more seismic surveys conducted at different vintages of hydrocarbon production. Although, many time-lapse studies involve three-dimensional (3D) seismic data, some studies compare seismic lines (Two-dimensional (2D) seismic data) and wellbore seismic data (one–dimensional (1D)). [1]. Known also as four-dimensional (4D, the fourth dimension being time) or repeat 3D surveys when 3D data are used, these seismic surveys help in the understanding of reservoir architecture and map the movement of fluids in reservoirs over time [2].Dimensions of Seismic surveyOne-dimensional (1D)In one-dimensional or 1D seismic survey (check-shot survey or vertical seismic profile or Well shot), Geophones are placed at various depths down a borehole to record responses to shots fired at surface. It used for the determination of sonic velocities of strata penetrated by hole, to allow more precise time-to-depth conversion of nearby 2D, 3D, and 4D data [3].Two-dimensional (2D) In two-dimensional (2D) seismic survey, both the sound source and the sound detectors (numbering up to a hundred or more per shot) are moved along a straight line. The resultant product can be thought of as a vertical sonic cross-section of the subsurface beneath the survey line. It is constructed by summing many compressional (pressure) wave reflections from the various sound source and sound detector locations at the halfway sound path points beneath each location (common depth point stacking). 2D seismic data are normally used to obtain a regional overview in an area because such data are relatively cheap to acquire but have imaging deficiencies. However, for more detailed mapping, 3D seismic data are required [3].Three-dimensional (3D) The general aim of three-dimensional (3D) survey is to achieve a higher degree of resolution of the subsurface geology than is achievable by 2D survey. 3D survey methods involve collecting field data in such a way that recorded arrivals are not restricted to rays that have travelled in a single vertical plane. Three-dimensional surveying samples a volume of the subsurface rather than an area contained in a vertical plane, as in 2D surveying. In three-dimensional surveying the common midpoint principle applies similarly, but each CMP gather involves an areal rather than a linear distribution of shot points and detector locations [4].On land, 3D data are normally collected using the crossed-array method in which shots and detectors are distributed along orthogonal sets of lines (in-lines and cross-lines) to establish a grid of recording points. At sea, 3D data may be collected along closely-spaced parallel tracks with the hydrophone streamer feathered to tow obliquely to the ship’s track such that it sweeps across a swathe of the sea floor as the vessel proceeds along its track. By ensuring that the swathes associated with adjacent tracks overlap, data may be assembled to provide areal coverage of subsurface reflectors. Alternative method can also be used. High-quality position fixing is a prerequisite of three dimensional marine surveys in order that the locations of all shot–detector mid-points are accurately determined. The areal reflector coverage obtained in three dimensional surveying provides the additional information necessary to permit full three-dimensional migration in which reflection points can be migrated in any azimuthal direction. This ability to fully migrate three dimensional survey data further enhances the value of such surveys over two-dimensional surveys in areas of complex structure. The essential difference between 2D and 3D migration may be illustrated by imagining a point reflector embedded in a homogeneous medium. On a seismic section derived from a 2D survey, the point reflector is imaged as a diffraction hyperbola, and migration involves summing amplitudes along the hyperbolic curve and plotting the resultant event at the apex of the hyperbola, The actual three-dimensional pattern associated with a point reflector is a hyperboloid of rotation, the diffraction hyperbola recorded in a two-dimensional survey representing a vertical slice through this hyperboloid. In a 3D survey, reflections are recorded from a surface area of the hyperboloid and three-dimensional migration involves summing amplitudes over the surface area to define the apex of the hyperboloid. A practical way of achieving this aim with crossed array data from a three-dimensional land survey is the two-pass method .The product of three-dimensional seismic surveying is a volume of data representing reflection coverage from an area of each subsurface reflector [4].Four dimensional (4D) Four dimensional (4D) reflection seismic survey is the exact repetition of a 3D survey at two or more time intervals. The primary application of 4D is mapping the movement of fluid interfaces in producing oil and gas reservoirs. The planning process of a 4D survey is more involved than planning a regular exploration 3D survey: Pre-survey evaluation and design studies are critical in determining 4D survey acquisition, processing, and inversion parameters. The practical implementation of 4D surveying is far from simple [5]. The essential measurements made by a seismic survey are the values of amplitudes of seismic waves at specific locations and times after a seismic source has been fired. Any factor which affects the location, amplitude or timing of seismic waves must be allowed for when comparing two sets of data recorded in different surveys. Obvious effects would be different geophones in different locations, for each survey. Other effects are much more subtle. The seasonal change in level of the water table may be enough to affect the travel time of seismic waves in the near-surface such that all deep reflections will be systematically mis-timed between two surveys in different seasons. As an oil field develops, the increased plant (pumps, drill-rigs, vehicles) changes (and increases) the background seismic noise with time. In the processing of the raw data to make the final seismic sections for comparison, many different mathematical operations change the amplitudes of the data. Each of these must be rigorously checked and identical processing must be carried out for each separate dataset [4]. The primary properties of the reservoir which change with time as hydrocarbon extraction proceeds are the pore fluid pressure, the nature of the pore fluids, and the temperature. Each of these may have an effect on the seismic response. Changes in fluid pressure will affect the state of stress in the rock matrix combined with temperature, will directly affect factors such as the exsolution of gas from hydrocarbon fluids. This ability to monitor producing reservoirs has major importance in allowing sophisticated control of reservoir engineering and production operations. Interpretation of 4D seismic data (i.e., mainly the differences between base- and monitor-survey data) focuses on fluid substitution in a reservoir: fluid flow imaging, fluid movement monitoring, fluid contact mapping or injection front mapping [6].Time-lapse (4D) seismic provides a vital tool for reservoir monitoring and also serves as a multi-disciplinary platform for efficient reservoir development [7]. It is a proven technology to observe fluid movement over the life of the reservoir which can help increase production and optimize field management. 4D seismic provides an opportunity to image the fluid flow in volumetric region not sampled by the wells [8]. Fluid flow is thus directly mapped by the seismic data rather than solely predicted by the fluid simulation [9]. Time-lapse seismic surveys, when integrated with other subsurface information, unify reservoir performance data, enhance injection operations and optimize geological models. This paper thoroughly investigates the application of 4D seismic data acquisition with special emphasis on the challenges and successes achieved since the inception of this method in the Niger Delta. A venture into 4D seismic, encouraged by this study, will assist exploration and production companies in deciding the entire field economics and where best to situate and drill wells for optimal production within the Niger Delta.
2. Historical Perspective of Time-Lapse Seismic Acquisition in the Niger Delta
- Time-lapse seismic acquisition has been successfully conducted in only a few among the many oil and gas fields (offshore and onshore) in the Niger Delta. Onshore (Land/Swamp) The first onshore 4D seismic survey in Nigeria was conducted in 2001 by China National Petroleum Corporation/Bureau of Geophysical Prospecting (CNPC/BGP) International Nigeria Limited for Shell Petroleum Development Company (SPDC) Nigeria Limited, Port Harcourt in the Nembe Creek, Oil Mining Lease 29 (OML 29), an area covering 192 km2 in the Niger Delta. The baseline 3D seismic survey of the Nembe Creek was conducted in 1998 and crude oil has been produced from the reservoirs till date. 4D seismic survey was conducted in IMO RIVER 4D prospect, OML-11/17 in 2003 by United Geophysical Nigeria Limited/Integrated Data Services Limited (UGNL/IDSL) Joint Venture (JV) for SPDC in the Niger Delta. This prospect which covers 175 km2 cuts across Etche and Omuma Local Government Areas of Rivers State and Ukwa-West Local Government Area of Abia State. 4D seismic survey was also conducted in 2003 by CNPC/BGP in OML 18, a swamp prospect comprising Cawthorne Channel and Akaso/Krakrama. Previous 3D seismic survey in this field was conducted by Western Geophysical Company in 1989. More so, CNPC/BGP conducted 4D seismic survey in Emerengi field, (OML 28) owned by SPDC in 2007/2008. In 2010, 4D seismic survey was also conducted by CNPC/BP for SPDC in Soku field, an area covering 500km2. 4D seismic acquisition was recently conducted in Ogume prospect in 2013 by CNPC/BGP for SPDC. The first 3D seismic in this field was conducted by UGNL/IDSL JV in 1998 in an area covering 155 Km2.Offshore (Deep-water) [10]. reported that Nigerian’s first 4D seismic acquisition in deep-water oil and gas operations was achieved at SNEPCO-operated Bonga field, 120km south-west of the Niger Delta. During this acquisition, images of the subsurface were captured with the aid of state-of-the art marine seismic acquisition vessels stationed in the field. According to [11], the aim was to provide a much improved understanding of the on-going reservoir drainage performance after two years of production and enable better well placements such that the Bonga field life –cycle production will be maximised. The first (baseline) seismic survey (3D survey) in the Bonga field was conducted in 2000. The results guided the siting and drilling of wells and relevant activities prior to start-up of production in November 2005. After about two years of production, 4D survey results show how reservoir conditions and fluid content have changed.The 4D seismic survey in Ofon field operated by Nigerian National Petroleum Corporation (NNPC) and TOTAL Exploration and Production (E & P) JV and located in OML 102, offshore Nigeria in 40 meters water depth, was a 3D Ocean Bottom Cable (OBC) 2C seismic recorded in 2004. Four ocean bottom cables were employed per swath. Shots were taken along the cables with maximum offsets of 4000 m and nominal stacking fold of 120 for a 12.5m x 25m bin size. The baseline survey in Ofon Field was a 3D marine dataset recorded between 1990 and 1992 by DIGICON with a dual source and one streamer configuration, a nominal stacking fold of 30, a cable length of 3000m, and an acquisition bin of 6.25m x 25m [12]. 4D seismic survey was shot in 1996 in Meren Field operated by Chevron and located in shallow water (50 feet deep) in south east of Lagos, Nigeria, about 10 miles offshore, while the baseline seismic survey was a 1987 Chevron legacy 3D survey. A detailed 4D seismic interpretation of the Meren E50 reservoir sand in Block 2, based on horizon amplitude extractions from the 1987 and 1996 cross-equalized seismic cubes were consistent with well production histories at 22 of the 24 wells [13].
3. Challenges
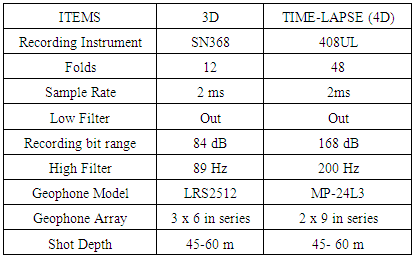
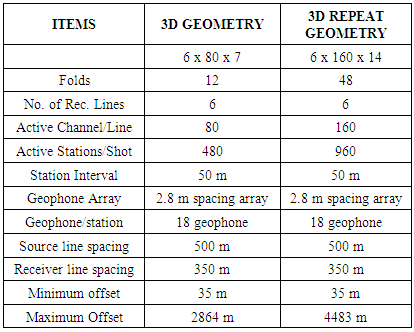
- The application of 4D seismic acquisition in Nigerian oilfields to enable accurate qualification and quantification of by-passed and remaining hydrocarbon for the future has been faced with some challenges slowing down the progress. The most important of these challenges are herein discussed.Different Instruments and Acquisition ParametersIn conducting a repeat-3D survey, different instruments are needed to properly cover the entire prospect and go even deeper than the previous depth attained in the initial 3D survey. However, improved models of instruments that are capable of handling and revealing more subsurface details are procured at a higher cost as previous instruments used for the initial 3D survey may be discarded.A typical example of how different instruments pose challenges in 4D seismic survey in Cawthorne Channel in the Niger Delta is shown in Table 1 [14]. In this example, different instruments were used in the light of improvement in technology. These different instruments have different impulse responses that will impact on recorded seismic data. Figure 1 is a typical example of the impulse responses of different recording instruments.
|
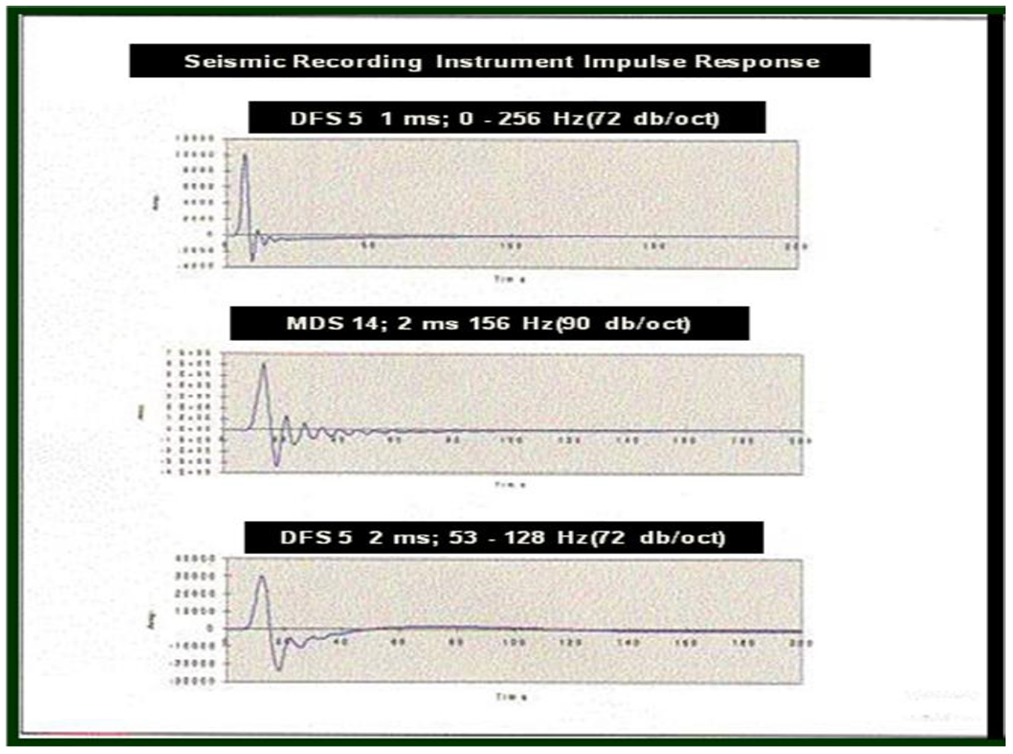 | Figure 1. Different Instruments Impulse Responses [14] |
 | Figure 2. Environmental Footprint Change (1985 – 1995) [14] |
 | Figure 3. Seismic Section showing Footprint (noise) resulting from Environmental challenges [14] |
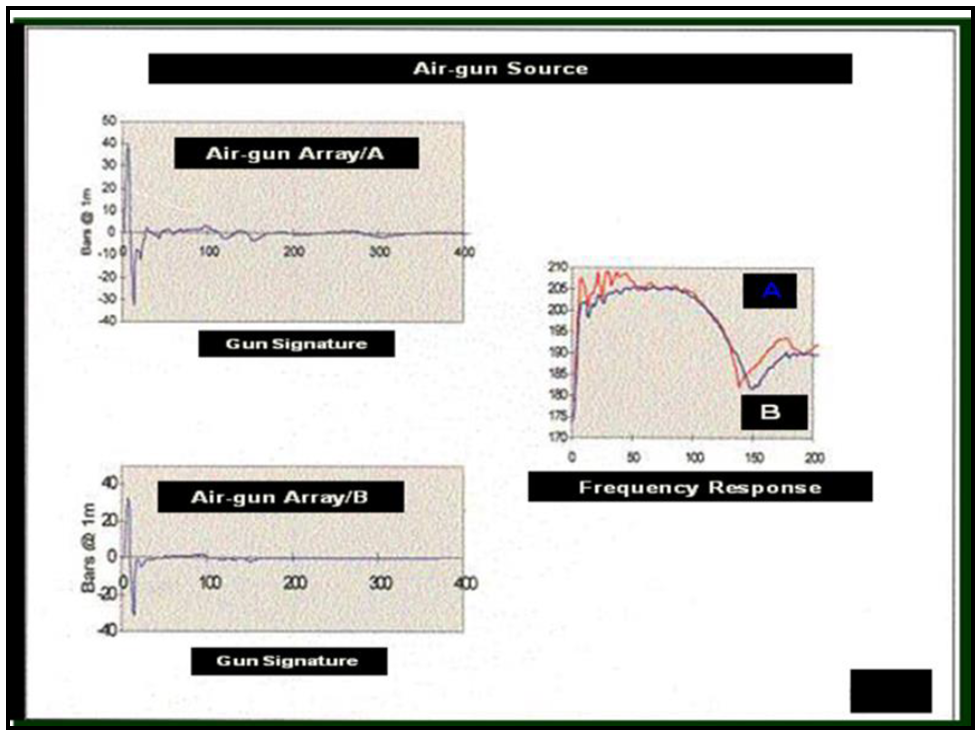 | Figure 4a. Impulse response due to different Airgun Arrays [14] |
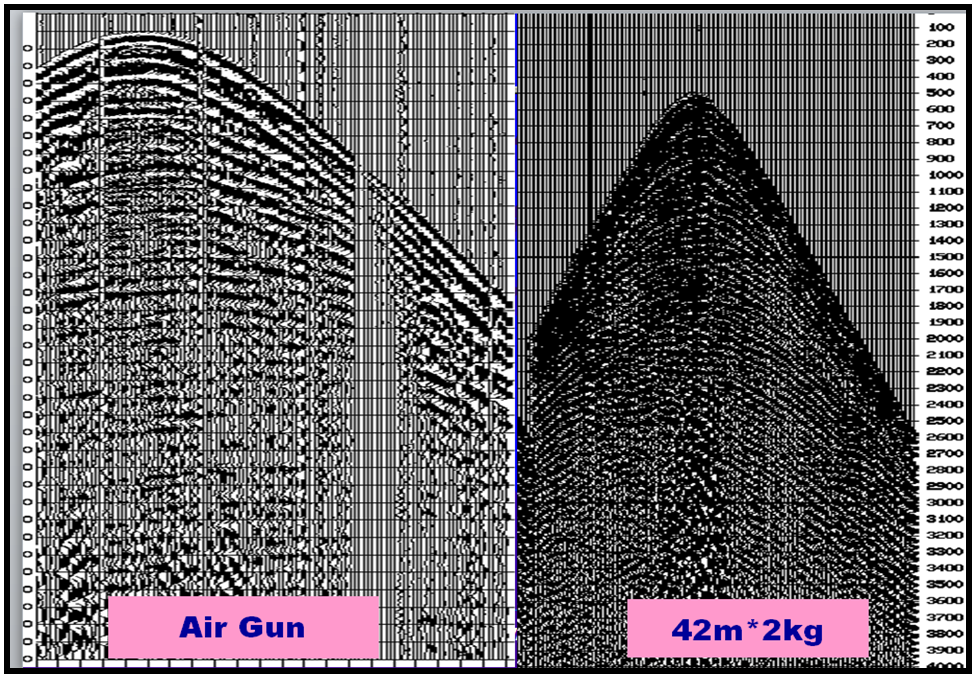 | Figure 4b. Seismic Sections showing Signal Responses due to Airgun and Dynamite Energy Sources [14] |
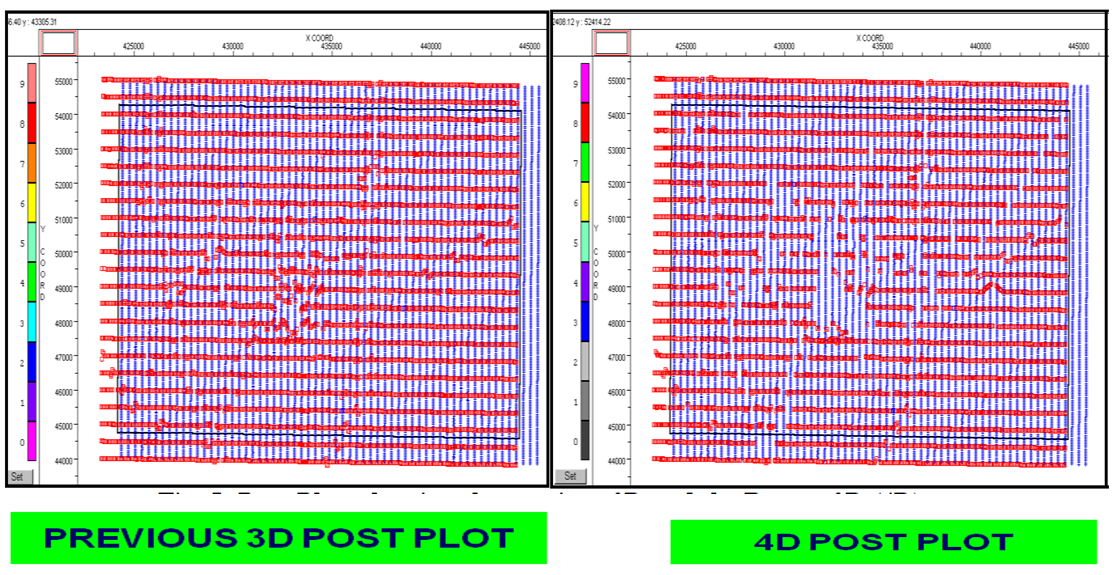 | Figure 5. Post-Plots showing the previous 3D and the Repeat 3D (4D) [14] |
4. Successes
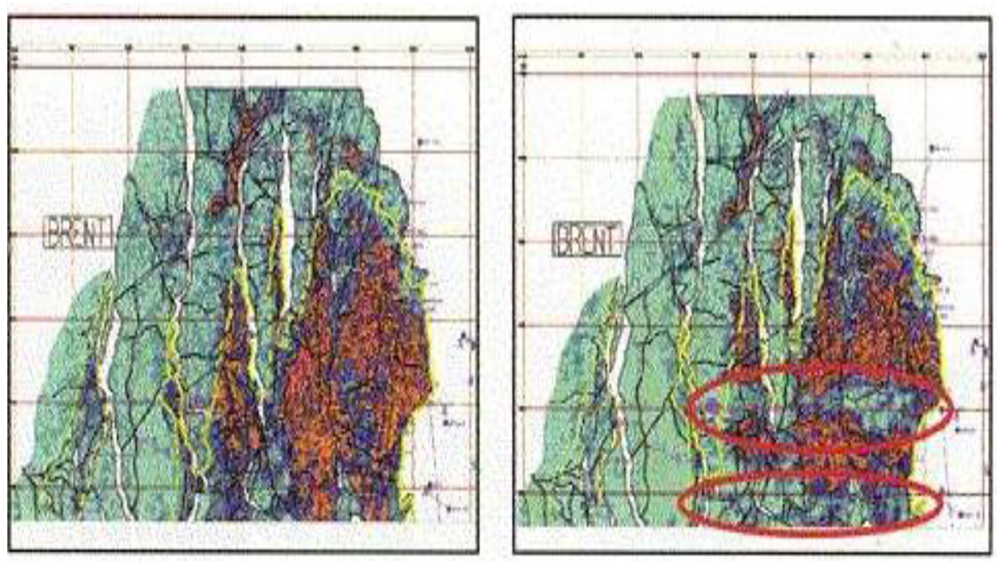
- [10]. reported that the time lapse seismic technology can save cost that runs into hundreds of millions of Dollars and also, that it would improve oil recovery between 10 and 15%.Detailed Structural MapsMost multi-national oil companies in Nigeria such as SPDC, TOTAL, Chevron and Mobil Producing have reported improved structural definition as one of the main benefits of time lapse seismic [12, 13]. 4D seismic presents detailed fault contour maps, often showing the rapid varying fault throws; faults die-out and build-up over short distances. A critical look at the circled parts of the seismic section in Nembe Creek (Figure 6) shows that horizons and faults are clearly highlighted in the 3D re-shoot. Similar observations can be made in Cawthorne Channel Akaso-Krakrama 3D reshoot (Figure 7).
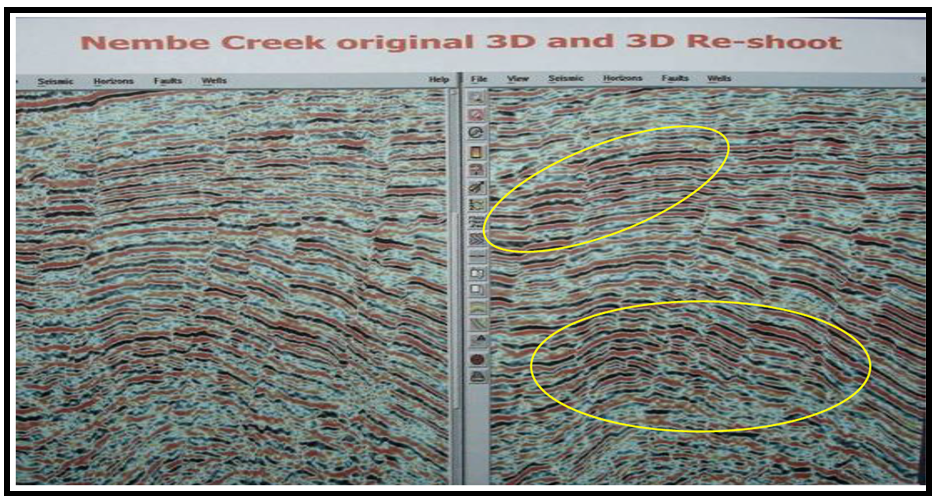 | Figure 6. Detailed structural section after 4D Survey in Nembe Creek, Niger Delta [14] |
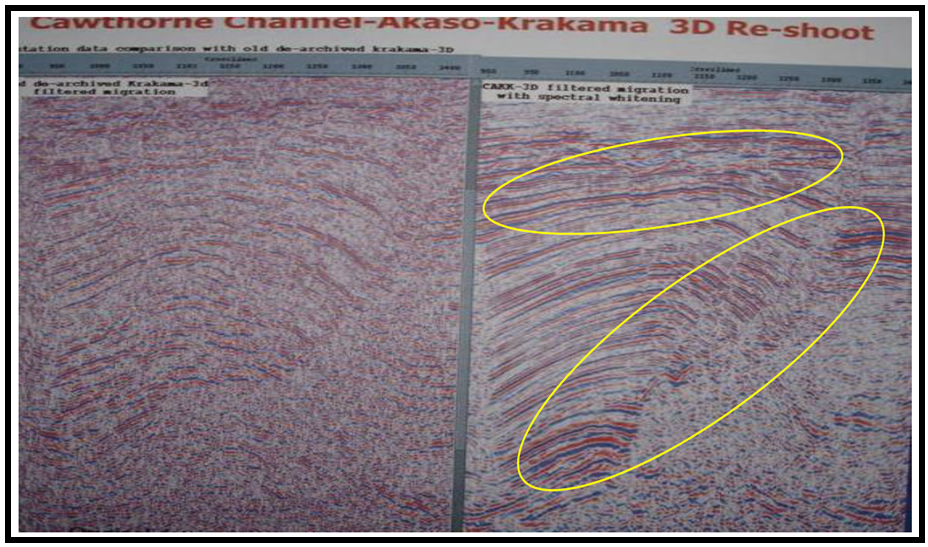 | Figure 7. Detailed structural section after 4D Survey in Cawthorne Channel-Akaso-Krakrama, Niger Delta [14] |
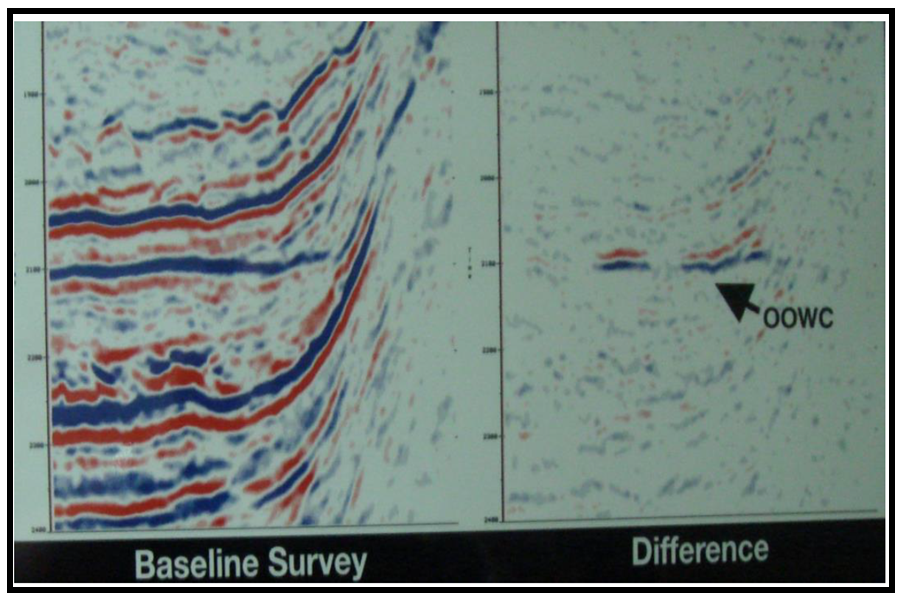 | Figure 8. Improved prediction of reservoir (oil-water contact) 4D Seismic Shooting in the Nembe Creek, Niger Delta [14] |
 | Figure 9. 4D seismic-based map of saturation made for a part of the Statfjord field (i.e. a map showing the relative proportions of oil and water) [18] |
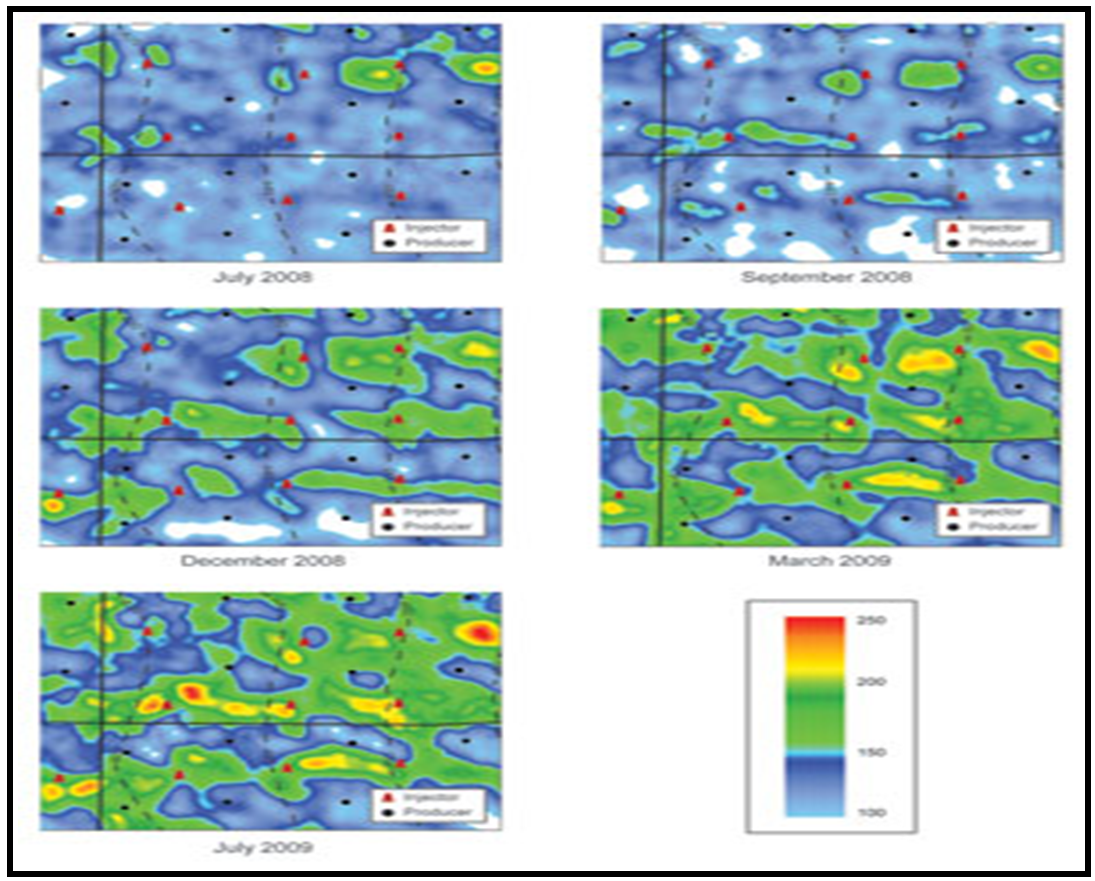 | Figure 10. Time-lapse study of a CO2 flood with fine time steps in Salt Creek, a mature oilfield located in Wyoming’s Powder River Basin. The pattern response was not uniform and there were differences from pattern to pattern [19] |
|
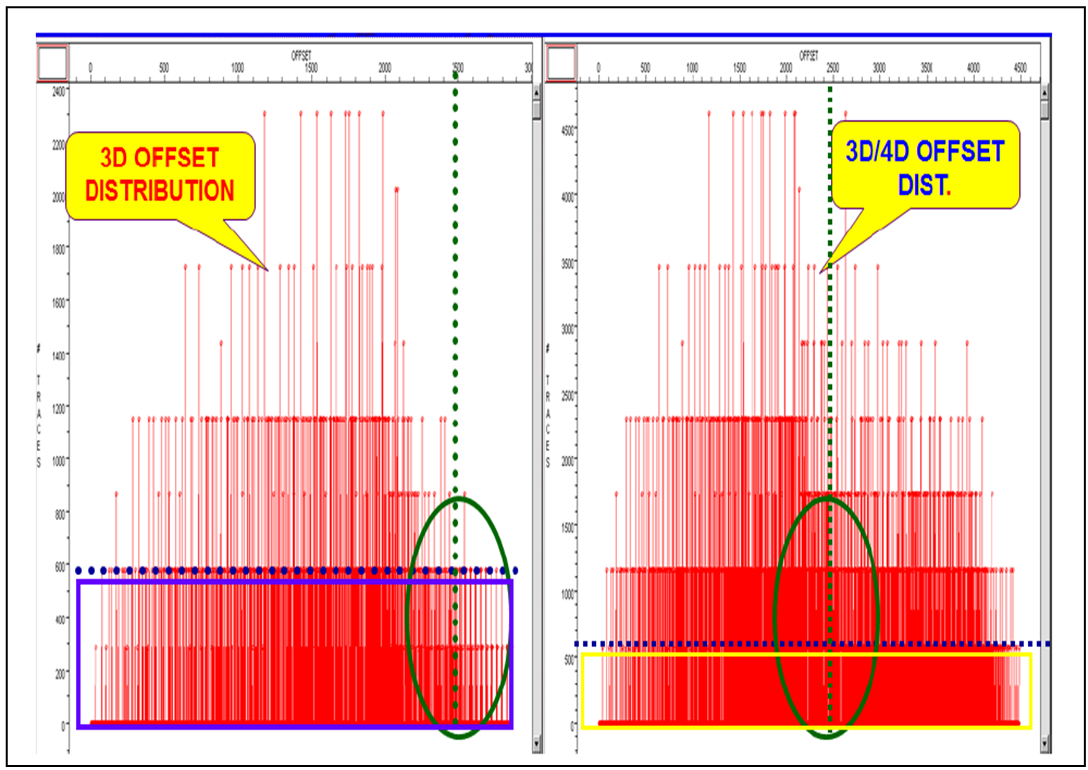 | Figure 11. Offset Distribution in 3D and 4D geometries [14] |
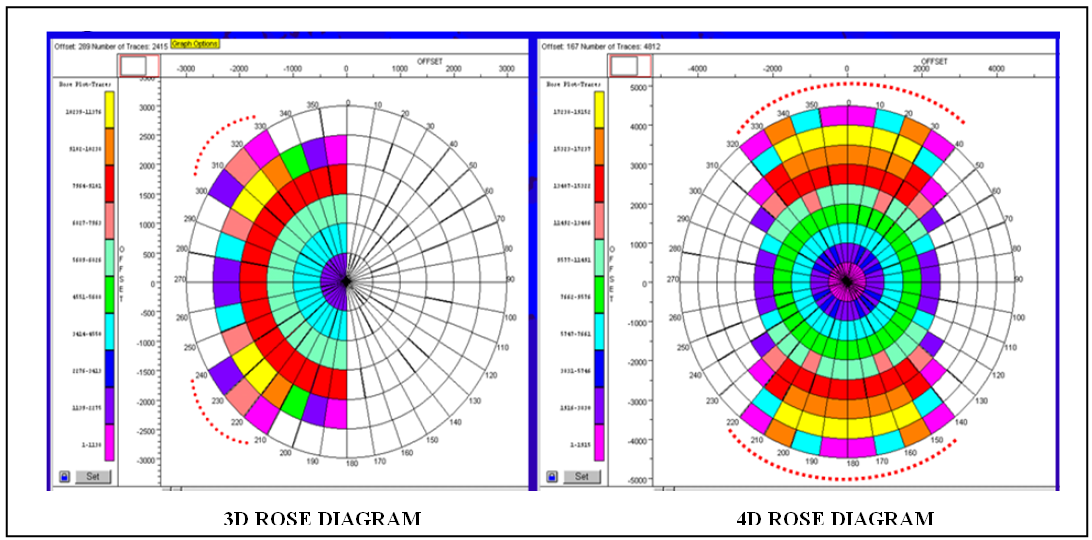 | Figure 12. Rose Diagrams showing improvement in the offset range [14] |
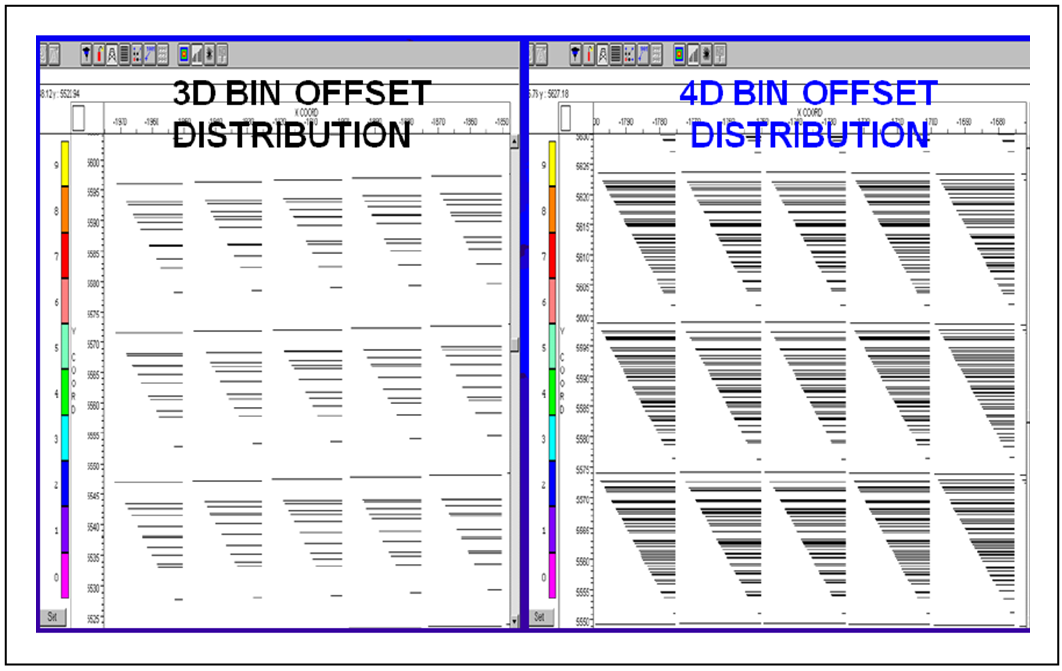 | Figure 13. Bin Offset Distribution [14] |
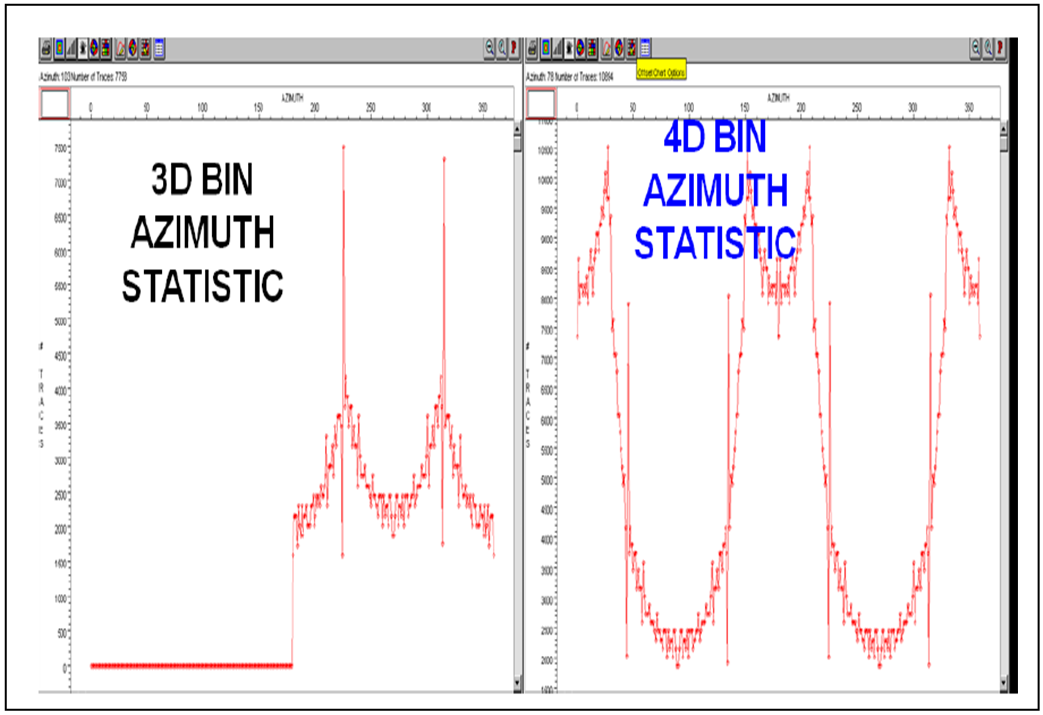 | Figure 14. Bin Azimuth Statistics [14] |
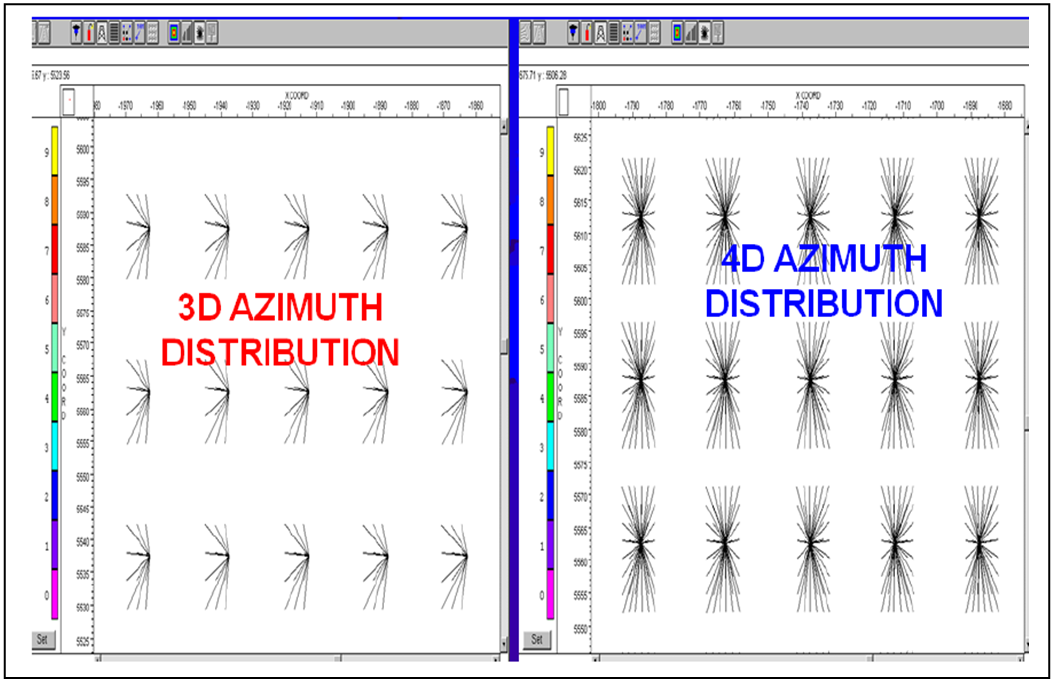 | Figure 15. Azimuth Distribution [14] |
5. Conclusions
- 4D seismic survey (time-lapse technique) has been applied in the Niger Delta and is still currently being applied to acquire high quality seismic data. This is critical in enhanced processing and interpretation. It facilitates improved structural and stratigraphic analyses of the data leading to precise reservoir description. Time-lapse acquisition has been applied to minimize differences in the seismic data with previous 3D seismic acquisition. This has positively affected factors unrelated to production, preserved and resolved those differences in the reservoir that are due to production, acquisition parameters, and processing technique.Previous 3D seismic survey geometry had lower coverage, small offset range, narrow azimuth, non-symmetric azimuth distribution and lower S/N ratio, but this proven technology has been able to resolve and improve on all these problems and even proceeded to observe fluid movement over the life of the reservoir which can help increase production and optimize field management.When integrated with other subsurface information, 4D seismic can unify reservoir performance data and optimize geologic models.
6. Recommendations
- In order to fully utilize the robust capabilities and overwhelming benefits of 4D seismic survey despite the challenges, it is recommended that multinational oil and gas prospecting companies carry out a reshoot of all their previously acquired 2D and 3D fields which are mature and have attained their oil peaks in Niger Delta., Nigeria.4D seismic survey is also recommended for new fields in Niger Delta since according to Johnston, 2013, planning for 4D seismic early in a field’s life helps minimize the number of initial development wells, optimize phased developments wells, and permits early field intervention and upgrades to the depletion, and reservoir-management strategies.