Girma Moges 1, Vijaya Bhole 2
1Department of Geography and Environmental Studies, College of Social Sciences, Dire Dawa University, Dire-Dawa, Ethiopia
2Department of Geography and Geo-informatics, University College of Sciences, Osmania University, Hyderabad, India
Correspondence to: Girma Moges , Department of Geography and Environmental Studies, College of Social Sciences, Dire Dawa University, Dire-Dawa, Ethiopia.
| Email: |  |
Copyright © 2016 Scientific & Academic Publishing. All Rights Reserved.
This work is licensed under the Creative Commons Attribution International License (CC BY).
http://creativecommons.org/licenses/by/4.0/

Abstract
This study mainly aimed to assess downstream changes in morphology, grain sizes and flow/hydraulic characteristics and to identify major geomorphic process operating in river Goro. Flow/hydraulic parameters relevant to this study at bankfull flow condition were derived from cross-sectional data measured using Total Station and grain size data obtained through standard laboratory analysis. The study revealed that the shape of most surveyed cross-sections do not perfectly match with well-known models of channel cross-sectional shape (rectangular, trapezoidal or parabolic). The study river is relatively narrow and deeper in its upper and lower reaches, but wide and shallower in its middle reach with average width to depth ratio of 43.9, 82.5 and 39.4 in the upper, middle and lower reaches respectively. Assuming distance is the only factor that affect downstream fining, this study found “Stenberg’s law’ works well for River Goro whereby grain size exponentially decreases downstream of river Goro with a finning coefficient of minus 0.046 (significant at 95% confidence level, R2 = 0.527). The values of grain size fining coefficient ranges between -0.074 and -0.017 (significant at 95% confidence level). However, the value R2 indicates that distance explains only 52.7% of the variation in grain sizes downstream of river Goro. Other variables that affect downstream trends of grain size include channel width, discharge and channelbed slope, of which the later dominantly affects the variation in grain size downstream river Goro. The downstream trend of discharge is very similar to the downstream trend of cross-sectional area. In contrast to other findings reported in literatures, river Goro attained its maximum discharge (581.7m3/s) in the lower reach at distance nearly 4.1km after it left mountainous/hilly/ topography of the watershed. The study river exhibits subcritical flow regime (with average value of Froude number (F) calculated for the whole river = 0.57), which is true for most natural channels. The average boundary shear stress of the channel is 352.1 N/m2. The downstream variation in boundary shear stress mainly explained by channelbed slope and depth of the channel each account for 56.8% and 21.2% respectively. The total stream power of river Goro ranges between 19,326.6 watts/m (minimum) and 93,690 watts/m (maximum). 61.1% and 21.5% of the downstream variation in total stream power is explained by bankfull discharge and channelbed slope respectively. Unlike other researchers who reported highest stream power in middle reaches, the maximum stream power of the study river is documented in the lower reach, where both channelbed slope and discharge are simultaneously higher than the values of the same variables of other cross-sections in the reach. The study also revealed erosion as the major channel process in the study river where the magnitude increases downstream. Suspension is identified as the most dominant sediment transport mode of river Goro at its bankfull flow. The mean grain size transported in the form of suspension ranges between coarse sand (0.71mm) and very fine gravel (2.72mm). Moreover, the river transports boulders up to its downstream reach where no tributary joins the main channel. Maximum boulder size entrained and transported by bankfull flow ranges between 374mm and 749mm.
Keywords:
Channel, Grain size, Hydraulic parameters, Geomorphic processes, Boulder entrainment, Ephemeral River
Cite this paper: Girma Moges , Vijaya Bhole , Change in Channel Morphology, Grain Size and Hydraulic Parameters Downstream of Goro, an Ephemeral River in Dire-Dawa, Ethiopia, Geosciences, Vol. 6 No. 2, 2016, pp. 45-73. doi: 10.5923/j.geo.20160602.03.
1. Introduction
Ephemeral rivers are major geomorphic agents in designing and carving the landforms found in Dryland and semi-arid areas [1]. The bed of ephemeral rivers is mostly dry throughout the year and characterized by flashy intermittent flow for most of the year. Erratic and intensive rainfall with short durations is the main source of water for ephemeral rivers. Even though their intermittent behavior eases to investigate them directly, there are only few researches on the morphometric characteristics, morphology, channel geometry, hydraulic characteristics, sediment transport, channel adjustment behaviors and associated geomorphic processes of ephemeral rivers at both spatial and temporal scales. Beside few in number, most of the available researches on ephemeral rivers deal on downstream changes in sediment load, grain (bed material) size and channel morphology based on measured flow and sediment data. However, most ephemeral rivers lack measured flow and sediment data because of either little attention given to them or their inaccessibility, attributed to their location in remote areas, to install instruments required to measure flow and sediment data. So studying changes in morphological variables and sediment parameters downstream of dryland rivers won the attention of fluvial geomorphologists since longitudinal variation in these variables are the only source of data and information to study fluvial processes and hydraulic characteristics of dryland rivers. Many dry land rivers exhibit downstream changes in discharge, sediment load, morphology (planforms, bedslope, shape and size of the channel), and grain size attributed to factors such as river long profile [2, 3], infrequent flood, lose in flow transmission along the bed, presence of tributaries joining the main river, drainage pattern, type of bank sediment, presence or absence of bank vegetation [4, 5]. In natural channels, morphological variables, grain size parameters and hydraulic parameters are interrelated and operate simultaneously in a channel so that difficult to categorize exclusively as independent or dependent variables. For instance, the variation of discharge, sediment load, and channel slope of a channel affect its planform configuration. Grain size affects the shape of channel profile. Longitudinal profile is one of the most vital variables in channel morphology that we should consider in downstream channel studies because it affects bed forms, morphological variables and the operation of hydraulic variables directly or indirectly. In the absence of long profile data, the downstream change in channel gradient provide enormous information about underlying bedrock, climatic and tectonic events, watershed relief and sediment load [2, 3]. Therefore, it is possible to explain sediment transport behavior of ephemeral rivers qualitatively by observing their profile tendencies. Long profile of ephemeral rivers usually appears concave down if loss of discharge along the course of the channel due to flow infiltration through the channel bed and is an indication of low sediment transport capacity. Otherwise, long profiles appear concave up if there is more amount of flow downstream [6]. This situation affects the depth, width, slope, flow velocity and grain sizes of the channel, resulted from mutual or other types of adjustments. The change in long profile or slope of the channel greatly affects the type of process dominantly operating in the channel (transportation, degradation or aggradation) which in turn affects the type and configuration of channel planforms and grain size distribution. However, very few studies are available on the trends and the relationship among the above variables and associate channel processes downstream of ephemeral rivers.According to Merritt and Wohl [7], changes in width, depth and bed slope fluctuate downstream of dryland rivers and appear more irregular especially in the floodout areas. The researchers also indicated that channel aggradation and degradation dominate the wider, braided reaches and the narrow reaches respectively. According to these researchers, channel degradation was due to confined flow within the channel, whereas aggradation attributed to vegetative bars and greater roughness that enhance sediment deposition when the discharge flows over top of the vegetated bars. On the other hand Kemp [8], claimed that discharge, channel sizes and bed material sizes decreases in downstream direction. Sediment grain size is the other variable that affects the hydraulic and geomorphic processes in a channel. The distribution of grain size influences channel processes such as entrainment, transportation and deposition. The clues of these processes can be referred from grain size properties [9-11]. The distributions of grain sizes along the channel vary with other variables related to channel morphology and hydraulics. Grain size change less rapidly than hydraulic variables mainly attributed to the concavity of stream long profile, other channel factors and size and condition of the whole watershed [12]. For instance, Renard, et’al [6] found that the mean and standard deviation of grain sizes decrease with increasing watershed area. Usually, conservation activities in the catchment reduce sediment supply to streams so that the sediment that is not available for transportation compensated by scouring of bed and riverbanks. On the other hand, an increase in sediment supply in excess of transport capacity results in channel aggradation. However, aggradation persistently occurs only until a new slope and velocity established new grade condition. “Sternberg’s Law” is the most influential model, which states that particles decrease in size exponentially downstream with distance in “proportion to mechanical work necessary to inflict friction along the river.” Later most researches also indicate that grain size degreases downstream of natural rivers due to sorting and abrasion [8, 13-16]. The other factors responsible for the downstream fining of grain sizes are slope [16] and decreasing flow velocity due to decreasing slope that limits the channel only to the energy capable of transporting smaller size particles [17]. However, other researcher reported that downstream fining of grain sizes may be disturbed by other factors like presence of tributaries, hillslope erosion, downstream variability in shear stress and flow velocity, river lithology and distance covered by particle travel [18, 14]. Of course, there are differences and objections among the above researchers on the influences of each factor on downstream distribution of grain sizes. For instance, Shulist [16] reported channel slope as the major factor that affect grain size distribution downstream because it provide a particular amount of velocity required for a particular grain size to be transported. On the other hand, according to Leopold and Maddock [15], slope is not the only factor rather other hydraulic factors (channel width, depth and velocity) play major role in downstream fining. Recently Rădoane, et’al [2, 13] argued that not only the profile concavity and channel slope, tributaries also affect grain size distribution. For instance, the joining of a tributary to the trunk river would disrupt the theoretical decrease of bed material size downstream because tributaries might bring sediment grains with heterogeneous sizes inherited from different parent materials of the source area weathered in different conditions of physical and chemical processes. Therefore, grain size may not decrease downstream of a channel because of the entrance of tributaries to the main channel which carry coarser grain materials that disrupt the downstream finning. Generally, the review on grain size indicates that several factors affect the downstream changes in grain size. These factors include the nature of stream profile, bedrock geology, abrasion and hydraulic sorting, decreasing in bed slope that causes decreasing in flow velocity, channel width and depth, downstream distance, channel concavity and boundary shear stress. However, there is no universally accepted downstream trend in grain size applicable to explain all types of rivers. In most developing countries, knowledge of river processes in the case of ephemeral rivers is very limited. A better knowledge on the hydraulic characteristics, sediment transport behavior, channel morphology and route migration of rivers is very decisive before investing any money on them for irrigation activities, building flood mitigation structures or other engineering works, so that we can reduce significant loss of finance by reducing vulnerability of those engineering works to the response of ephemeral streams. Unlike perennial rivers, ephemeral rivers maintain little attention apart from their significant impact on human settlement and economic activities. For instance, hydrologic dataset for ephemeral streams is scarce; many of the theories, concepts, methodologies and models used in various researches to describe channel processes and responses as well as channel dynamics, are mostly applicable to perennial rivers. Geomorphic processes and characteristics of ephemeral streams in general and channel morphology (size & shape of channel cross-section and planforms), flow characteristics, hydraulic properties, grain size distribution and channel geometry in particular are not yet well studied. Moreover, little is known about sediment transport processes and particle entrainment of ephemeral streams in spatial and temporal dimension [19, 20, 5, 21, 12]. So far, only a couple of studies are available on geomorphic and hydraulic characteristics of ephemeral rivers in Ethiopia though these types of rivers drain over very large (mainly the lowlands) part of the country. This study will add information on ephemeral streams so that scientists and researchers of the area may use the data throughout their efforts in developing models appropriate to simulate and predict hydrological behaviors of ephemeral rivers. In addition, most researches on ephemeral streams conducted in another area with environmental setting different from Dire-Dawa area. Therefore, it is necessary to investigate the nature of channel morphology, bed material size and hydraulic parameters downstream and to highlight major geomorphic processes and characteristics of ephemeral rivers in Ethiopia, of which river Goro is one of them. River Goro is selected as a subject of this study because of three main reasons. Firstly, it starts at the highlands of southern Dire-Dawa and ends within the administration at the outskirt of the town so that it is viable for geomorphic investigation of the whole river as single river system with limited finance. Secondly, no Geomorphological study has yet been conducted on river Goro. Thirdly, Goro has little attention by the researcher as most resources and research works are directing to Detchatu by which the administration experienced with huge flood related damages. But, hydraulic properties and channel processes of Goro should be investigated in advance in order to take any measures since its flooding impact on downstream settlement area is recently observed though its magnitude is less than Detchatu’s. The general objective of this study is to identify major geomorphic process operating in river Goro based on quantitative and qualitative account of downstream changes in its morphology, grain sizes and hydraulic characteristics. The specific objectives include: (1) To explain river Goro interms of downstream changes in its shape and size of channel cross-sections; (2) To quantify the rate of change in grain size downstream of river Goro; (3) To assess downstream hydraulic characteristics of river Goro; and (4) To identify major geomorphic processes (mode of sediment transport and boulder entrainment) in river Goro.
2. Materials and Methods
2.1. Study Area
Goro Watershed is located in Dire-Dawa administration, Ethiopia (Figure 1). The longitude and latitude extent of the watershed ranges between 9.44 and 9.63 N and 41.78 and 41.88 E. The watershed inherits the climate of Dire-Dawa administration, which experiences desert and semi-desert climate. The mean annual average air temperature is 25.3°C. June and January are the warmest and coldest months of the year respectively. Generally, the temperature of the area is hot throughout the year and progressively increases northward. The high temperature may be attributed to high mean annual daily value of bright sunshine that equals to 8 hours. The rain fall of the area is seasonal and characterized by bimodal distribution with peak value in April and August. Spring and summer are major seasons in which the area receives about 80% of the annual rainfall separated by a short dry spell in June. The mean annual rainfall of the administration is 657mm. The value of mean monthly rainfall ranges between 5.7mm and 119mm in December and April respectively [22].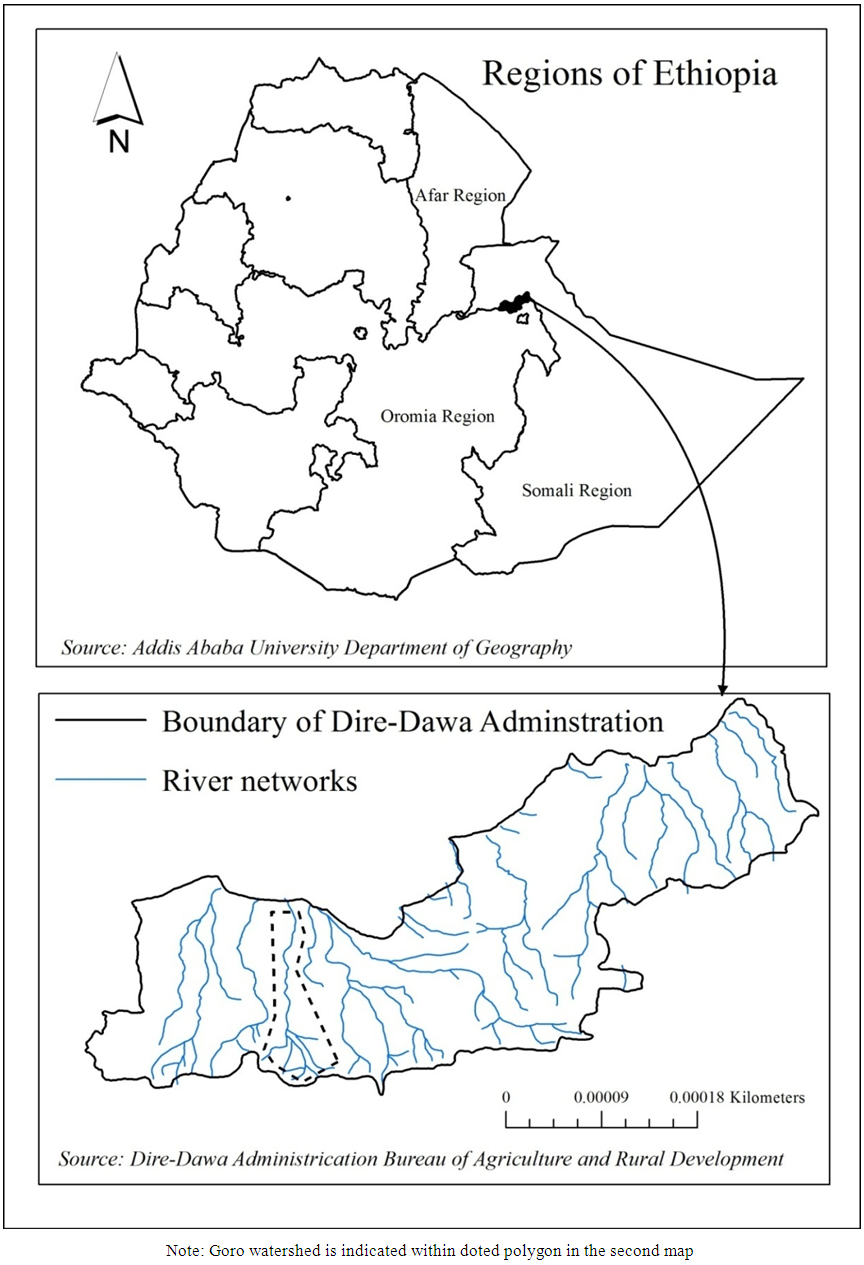 | Figure 1. Location of the study area |
River Goro is a fourth order stream (based on Strahler’s method of stream ordering) with dendritic stream pattern. The watershed is an elongated shaped with relatively wider areal coverage in the head water region, but narrows downstream after the confluence, from which the main trunk of the stream starts (Figure 2). The river is sinuous and narrower in its middle reach. Precambrian and Paleozoic rocks cover the largest proportion of the bed rocks in the upper and middle reaches of river Goro where each rock types accounts for 48.7% and 41.54% of the total area of the watershed respectively [23].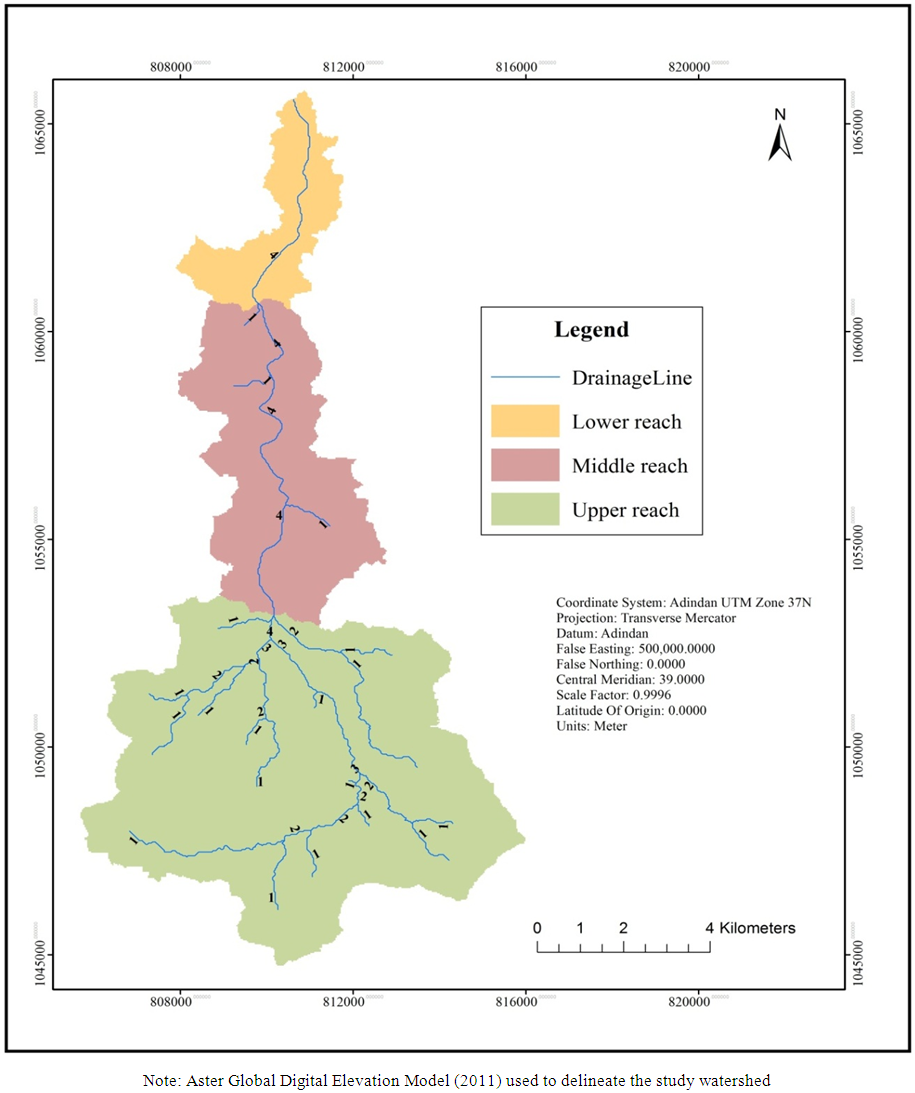 | Figure 2. Channel Networks and reaches in Goro watershed |
2.2. Channel Geometry Data
Since Goro has no any measured data, channel survey was conducted in October, 2013 to measure basic cross-section data and to collect grain size samples which are important input of formulae used to compute flow/hydraulic parameters of the study river at bankfull flow condition. The preliminary identification of cross-section sites using Google earth, topo-maps and aerial photos was substantiated by field observations. According to the research need and aim, the researcher started from a fixed point upstream from where the first cross-section (x01) was measured. Then measurement site for the next cross sections was determined at interval equivalent to 10 widths of the first (previous) cross-section downstream. A total of 14 cross-sections were surveyed (Figure 3) using Total Station. Straight reaches with: no or little obstruction on the river bed, devoid of tributary junctions, clear slope change between the flood plain and the channel (if the flood plain exists on measuring site), and a total length of 500meter along the center of channel were used as criteria to select site of cross-sections precisely. As it was observed from the Google earth map and confirmed through field observation, the second zone of the river is more sinuous (Figure 3). In such cases only few cross-sections were selected to avoid difficulties related to meander geometry. Usually, it is difficult to identify bankfull stages of ephemeral rivers based on their geomorphic setup because of inconsistent definition given to bankfull stage, that vary according to the height of a river bed relative to the height of the surrounding major depositional landforms like flood plain, “channel benches” and “levees” [8]. Moreover, defining bankfull stage in the field may be difficult in situations when the channel reach has: (1) wide, flat bed, (2) collapsed, vertical banks resulted from its poor cohesive materials, (3) no channel vegetation to trace the scar of the last flood height [20]. 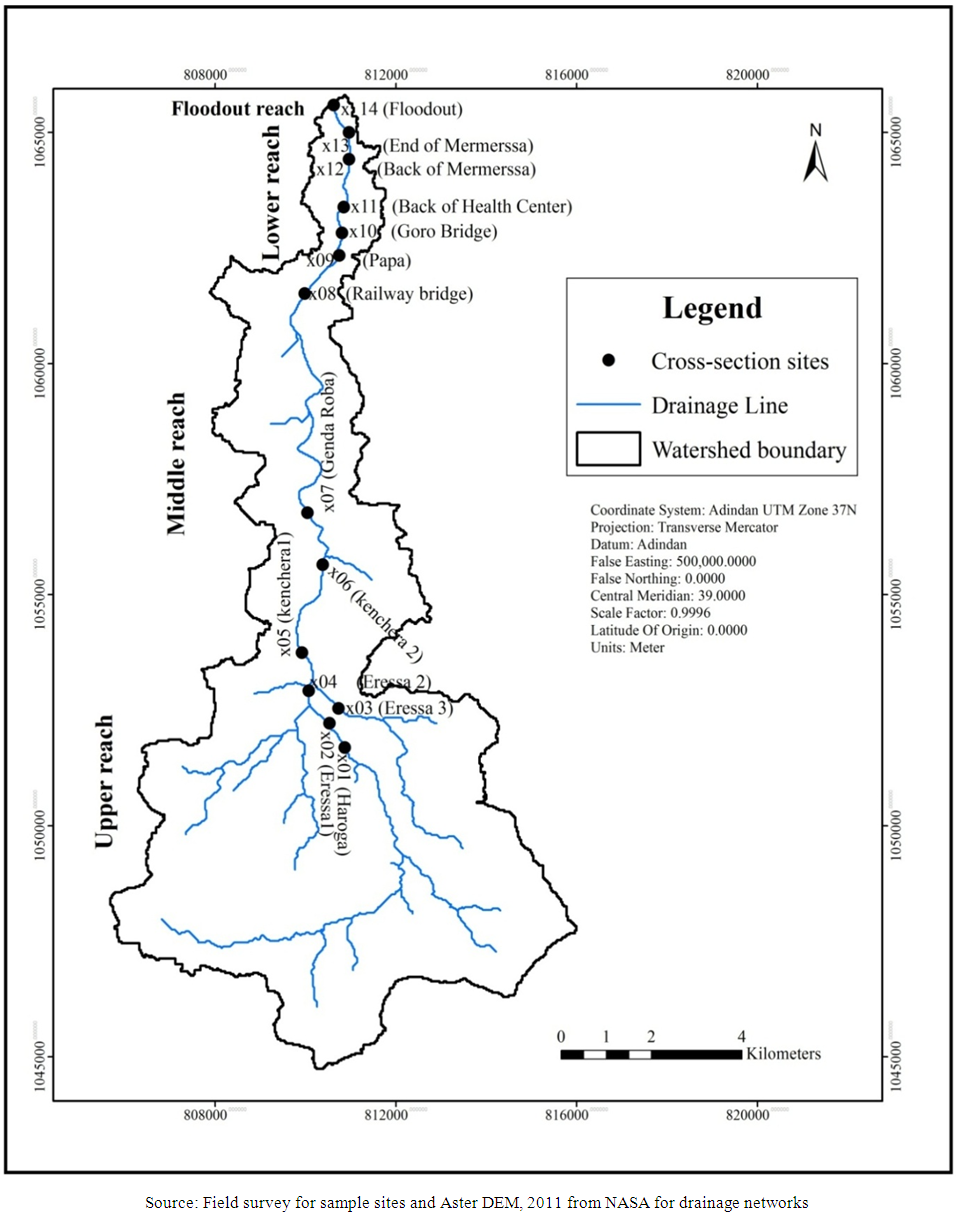 | Figure 3. Morphological zones and cross-section sites of River Goro |
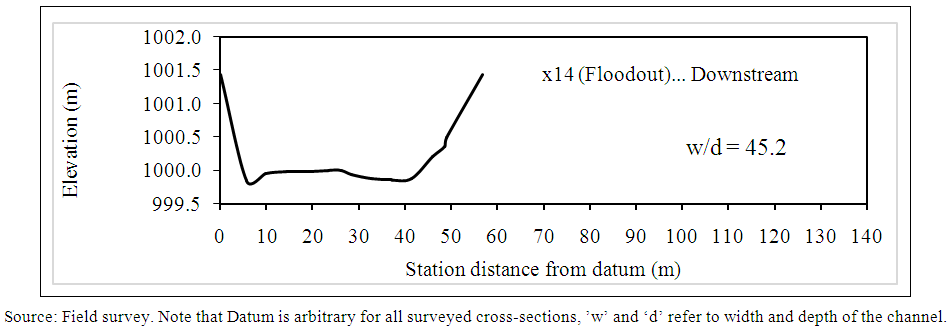
Based on channel situations observed during field survey, methods adopted from Kemp and Billi [8, 20] and used to identify bankfull stages of the surveyed cross-sections include: marked change in slope between the flood plain and the channel; reconstruction of “collapsed bank materials”, scars of last flood event left on bank vegetation and man-made structures; and taking the average height of channel banks in the reach if the flood plain found obstructed by off-channel deposits attributed to overbank flooding effects or animal and human intervention. The Total Station was set at the center of the reach where the reader can view reflectors, which were erected at the center of the channel upstream and downstream of the cross-section cutline. Four professional surveyors from the department of Surveying, Institute of Technology, Dire-Dawa University, participated during field survey. Finally, channel geometry data relevant for this study were calculated from coordinate and elevation values of points surveyed bank to bank straight along the cross-section cutline (Table 1).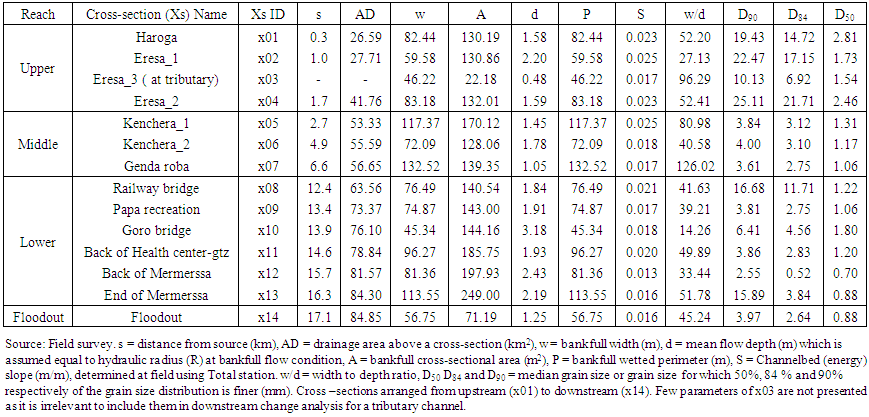 | Table 1. Values of geometric variables and percentile grain size for the surveyed cross-sections |
2.3. Grain Size Data
As indicated in (Equations 5 -7), D50, D84 and D90 are required to determine average flow velocity. For this reason, bed material samples were taken 10-20m upstream of the cross-section line to avoid sediment trampling and alteration while measuring the cross-section. This method is the most appropriate to select sampling sites according to the geomorphological and sedimentological characteristic of the study river and the aims of the research as confirmed by other authors that have worked on similar river (Billi, personal communication). Volumetric sampling was preferred to other methods of grain size sampling to avoid bias for the most upper sediment. An iron cup with 10 centimeters height and 8 centimeters radius was used to grab the grain samples up to a depth of 0.5cm from the surface of the channel bed. The specific sample sites on the channel were identified based on the occurrence of homogeneous grains sizes using visual inspection. Three samples with equal volume at a quarter right, the middle and a quarter left of a cross-section were taken following straight line across the channel. Then the samples were mixed to bring one representative composite sample for a cross-section in the main channel thus a total of 14 composite samples were taken to laboratory for grain size analysis. Each composite sample exposed to sample splitter and conning and quartering to gain 200 grams of sieve sample with representative grains of all possible sizes for final sieving. A 200 gram sample taken from the composite samples dry sieved using a standard set of sieves (specified as STD ISO 3310, BS410) arranged on one (1) phi scale ranging from 4Phi (finest) to -4Phi (the coarser). Sieves arranged on half (0.5) phi provide more accurate result than those arranged on one phi. However, it was not possible to sieve at the interval of 1/2 phi because of the absence and damage of sieves with diameter that equals with phi values 0.5 (positive and negative), 1.5, 2.5 and 3.5. Then sieves arranged on Ro-Tap (mechanical shaker with timer) in descending order of mesh size and were exposed for 10 minutes shaking until grains separately retained on each sieves according to their size. The materials retained on each sieve and on the bottom pan weighed using a balance with sensitivity of 0.1grams. Finally, the weight of material or sediment in each size fraction and the proportion of sample that was lost during sieving (the total summed on the sieve data sheet from the total 200 grams initially poured into the sieves) were calculated. Finally, D50, and D84 and D90 were determined using the graphical method (based on lognormal distribution) after drawing cumulative frequency curve of percentage grain size retained on each sieves for each samples in phi units and the result is presented in millimeter (Table 1).
2.4. Flow/Hydraulic Parameters
As already explained in the previous sections, the study river has no established gauges to measure flow parameters. For this reason, various empirical formulae were used to calculate flow parameters and hydraulic variables of river Goro. a. Velocity and DischargeBankfull flow was considered because hydraulic variables and channel geometry adjust to it to provide significant channel geomorphology. Bankfull discharge refers to the “maximum discharge that flows within the channel without overtopping the banks.” It is widely recognized to denote the flow that has the frequency of 1 to 2.33 years (Leopold, et’al, 1964 and Williams, 1978) in [24]. Assuming steady uniform flow conditions, the mean flow velocity was calculated using Che’zy’s formula (Equation 1) developed in 1969 [19]. | (1) |
where, V = mean flow velocity (m/s), C = channel roughness constant, R = the hydraulic radius (m), S = energy slope assumed parallel and equal to the gradient of the channel bed (m/m). The constant C is proportional to the Darcy–Weisbach friction factor ‘f ‘and written as follows where, g is the acceleration due to gravity (9.81ms-2).  | (2) |
There are many equations used to calculate ‘f’ as reported from literatures. However, many of those equations did not specifically address the conditions of ephemeral streams. The following equations used in this study to estimate the value of ‘f’ and flow velocity (in SI units). Then the average value of the results was used to calculate other flow parameters. Though its applicability was not tested for ephemeral stream, Equation 3 was selected for this study because it uses channel depth and channelbed slope both of which are the most important determinants of flow velocity. Equation 4 and Equation 5 were selected because they originally developed for sandbed streams. The selection of Equation 6 is based on its applicability for gravel and sand bed streams [19]. Moreover, Thomson and Cambell equation was used since the equation predicted velocity values closer to measured data of Gereb Oda River, an ephemeral river found in North Eastern part of Ethiopia [25]. All formulae (Equations 1 to 10) were adopted from Billi [19, 25]) and the result presented in (Table 2).  | (3) |
 | (4) |
 | (5) |
 | (6) |
 | (7) |
where, f = the Darcy–Weisbach roughness coefficient; d = mean flow depth or channel depth (m); S = channel bed slope (m/m); g = gravity (9.81m/s2); R= hydraulic radius (m); D50 = grain size for which 50% of the grain size distribution is finer (mm); D84 = grain size for which 84% of the grain size distribution is finer (mm); ks = Nikuradse roughness length (2D90). Discharge for each cross-section was calculated using the continuity equation (Equation 8) where, Q = bankfull discharge (m3/s); A = Bankfull channel cross-sectional area (m2).  | (8) |
b. Froude Number (F)Froude number is an index widely used to measure the flow behavior where the relative influence of inertia and gravity forces taken in to account. In order to know the type of flow based on the concept of critical flow across the cross-section of each study reach, F at bankfull discharge was calculated using Equation 9. Taking the average result of Froude number calculated for each velocity (Equations 3-7), the type of flow was identified whether as critical flow (for F=1), supper critical/rapid flow (for F >1) or sub-critical/tranquil flow (for F <1). | (9) |
c. Average Boundary Shear stress (τ0)In this study, shear stress refers to the force applied by flowing water that drags or erodes channel surface downstream along with it at bankfull discharge. This force, which denoted by average boundary shear stress  acting on the wetted perimeter of the channel, is a function of specific weight of the flowing fluid (γ), wetted perimeter (P), hydraulic radius(R), cross-sectional area (A) and channel bed slope(S). However, under uniform flow assumption the force that cause flow (γARS) is equal to the force of resistance to flow
  Therefore,
  for the study channel was computed using Equation 10, which is commonly known as Du Boys equation.
  | (10) |
where,  = average boundary shear stress
  the specific weight of fresh water under normal condition
  R=hydraulic radius (m) = A/P, S = channelbed slope (m/m). d. Stream PowerStream power tells us about the potential of water flowing in the channel to perform geomorphic works. For this reason, total stream power (Ω) in watts/m and specific stream power (ω) in watts/m2 were calculated for the study river using Equations 11 and 12 (Knighton, 1999 in [20]. Total stream power simply tells us the rate of energy dissipation along the bed and banks of the river per unit downstream length of the channel whereas specific stream power refers to the power of the stream per unit width of the channel.
  | (11) |
 | (12) |
e. Channel Roughness (n)Channel roughness affects geomorphic processes in a channel. However, the study river, Goro, has no roughness values based on measured flow data. Manning’s n value was computed for each surveyed cross-sections using Equations 13-15. These formulae were selected based on their applicability in sandbed rivers. In addition, the formulae consider D84, D90 and hydraulic radius (R=d) which largely affect the channel roughness. Finally, the average value of the three equations was used as ‘n’ value of respective cross-section.  | (13) |
 | (14) |
 | (15) |
f. Boulder EntrainmentThe researcher undertook boulder measurements to predict if there is boulder entrainment in the study river at bankfull critical shear stress,  (assumed equal to average boundary shear stress,
  ). During field survey, the researcher identified 10 boulders laid within the channel reach where cross-section survey conducted. Then using pocket meter, each boulder measured along its b-axis, which is equivalent to its retaining sieve size. Then the average value of the ten measurements was considered as maximum boulder size (D) for a cross-section. Boulder prediction equations adopted from [20] were used to predict the size of maximum boulder entrained at bankfull flow in the study river (Equations 16-20). Finally, boulder size predicted by each models compared with the boulder size measured at the field.
 | (16) |
 | (17) |
 | (18) |
 | (19) |
 | (20) |
g. Mode of Sediment TransportThe ratio of settling velocity  to shear velocity
  of the sediment particles was used to identify mode of sediment transport in the study river, Goro. If the ratio value is less than unity (1), the particles lifted above the bed of the channel and travel in suspension because shear velocity is greater than settling velocity so that the flow capable to carry material as suspended load. On the other hand, sediment particles travel along the channelbed in saltation or rolling if the shear velocity is less than the settling velocity (the ratio value is more than one) whereby sediment transportation is in the form of bedload. We can say mode of sediment transportation is in transition between suspension and bedload if the ratio value of settling velocity to shear velocity is one (1). Settling velocity of sediment particles
  and shear velocity
  were determined using Equation 21 and Equation 22 proposed by Ferguson & Church [28] and Pike, et’al, 2010 in [18] respectively.
  | (21) |
 | (22) |
where, r = submerged specific gravity (1.65 for quantize grains like sand), g = acceleration due to gravity  D = diameter of the grain (mm) assumed spherical, u = kinematic viscosity of the fluid
  kg/m/s for water at 20 degree centigrade),
  = constant (18 for natural grains)
  = constant (1 for natural grain).
  = average boundary shear stress,
  = the fluid density of water
3. Result and Discussion
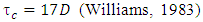
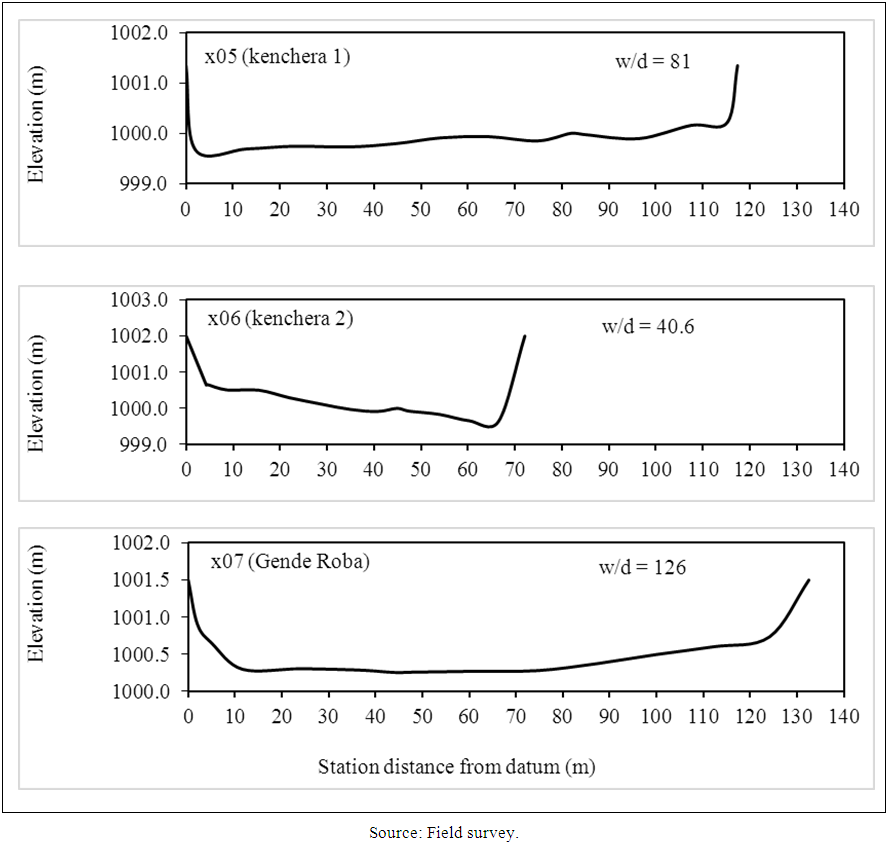
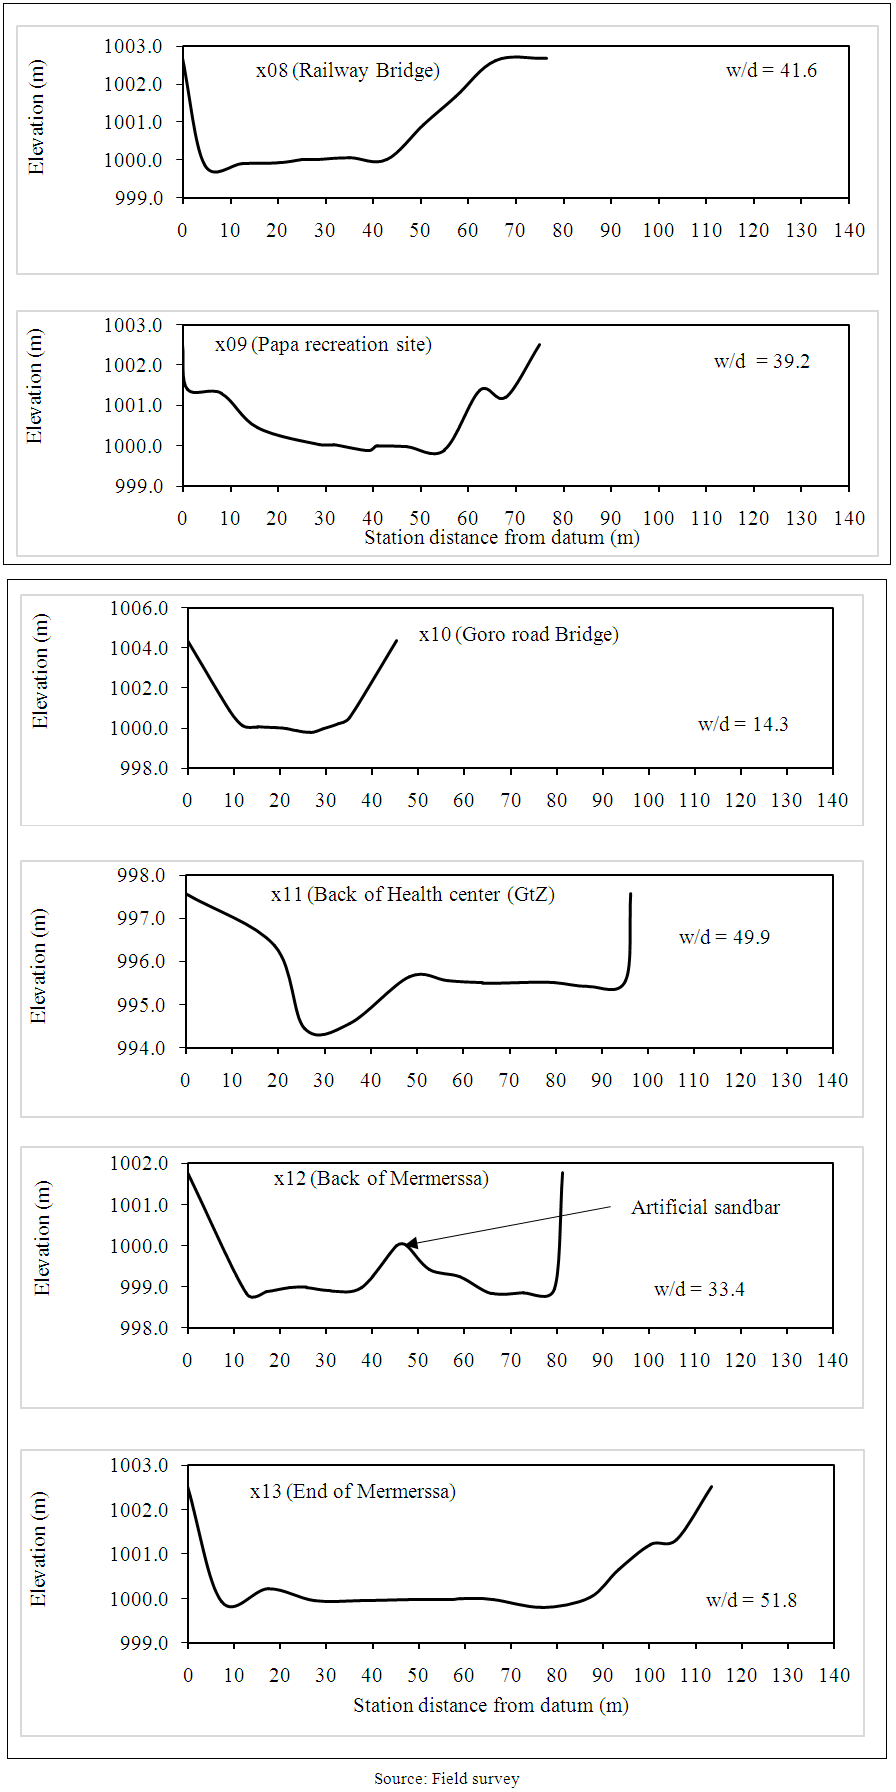
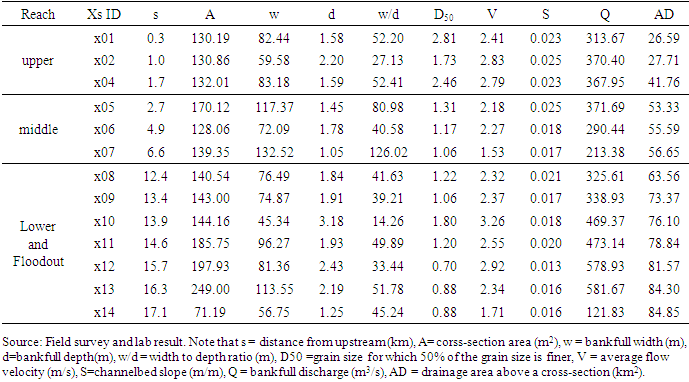
3.1. Shape and Size of Channel Cross-Sections
Channel cross-section is one of the channel morphology components, which play its role on the hydraulics and operating geomorphic processes of a channel. As indicated in Figure 4 to Figure 7, except x08 (railway bridge), x10 (road bridge) and x14 (floodout), which are nearly trapezoidal in shape, the shape of all other cross-sections do not perfectly match with the well-known models of channel cross-sectional shape (rectangular, trapezoidal or parabolic). Width to depth ratio is widely used to compare cross-sections interms of their shape. In the upper reach of river Goro, channel width, which was 82.44m, decreases by 28 % within 1km downstream where x02 (Eressa 1) is located, and later maintained the previous width after 1.7 km. This indicates that there is no substantial flow lose through infiltration or the amount of water infiltrated between x01 and x02 is compensated by the water comes from tributaries that joins the main channel upstream of x02 (Figure 3) that might resulted in increasing of discharge at x02 where the channel slope on the same location becomes steeper (see Table 2). However, the flow at x02 is constricted by hard rock, vegetated banks and artificial bank stabilization structures built by farmers (see Plate 1) so that the channel adjusts itself by increasing its depth at x02 (Eressa 1) and the average bank height increases from 1.5m at x01 to 2.3m at x02. | Figure 4. Shape of surveyed cross-sections in the upper reach |
 | Figure 5. Shape of surveyed cross-sections in the middle reach |
 | Figure 6. Shapes of surveyed cross-sections in the lower reach |
 | Figure 7. Shapes of a cross-section at floodout reach |
Table 2. Size of surveyed cross-sections with hydraulic variables
 |
| |
|
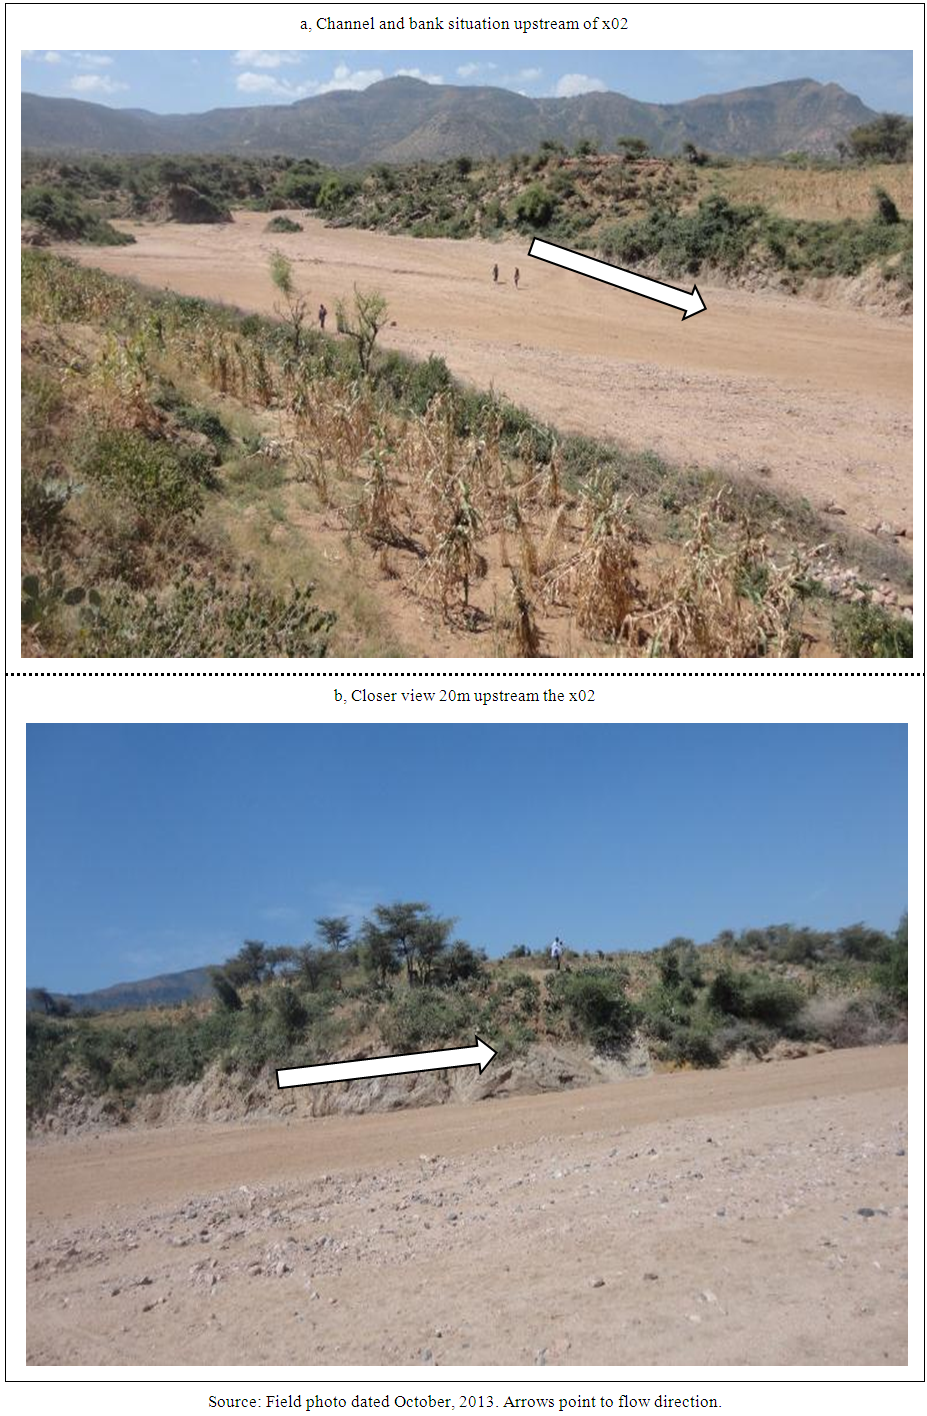 | Plate 1. Channel condition in the upper half the reach surveyed for x02 |
The catchment area of river Goro above x05 (500m downstream of the confluence) is 53.3km2, the value, which interestingly is within 50 to 100km2 as reported by Billi [20]. The channel becomes rapidly wide after the confluence where the width to depth ratio is greater than 80 at x05 that might be attributed to increasing in discharge due to the joining of tributaries at immediate upstream. Channel width increase in the middle reach of river Goro (x05 to 07) while discharge continuously decreased downstream. Decreasing of discharge in the same reach may be attributed to decreasing in channel slope that might enhanced flow loss through infiltration and bed aggradation therefore the depth of the channel which was 1.5m at Kenchera1(x05) decreased to 1.1m at Genda Roba ( x07) where width to depth ratio is 126 (Table 2). Most part of the river course between x07 and 08 is characterized by deep gorges bounded by hard rock hills (Plate 2). The hills are very steep, stony, devoid of vegetation covers that aggravate hillslope erosion. The amount of discharge starts to increase after x08 (rail way bridge) after which river Goro leaves the rugged topography and joins the lowland broad area, where the town of Dire-Dawa is established. Even though alluvial fan deposit is expected at a site immediately after a river leaves the upstream hilly gorges, there was no such type of depositional landform observed for the case of the study channel during field survey because the area (probably formerly formed alluvial fan) is already occupied by urban settlement. In this area, the study river found with narrower and deeper channel (with width to depth ratio ranges between 14.3m and 51.8) confined by artificial structures (like retaining walls, gabions and bank stabilization structures) and other urban builtups. This indicates the shift in the type of geomorphic processes (from channel aggradation to channel degradation) which is uncommon in lower reach of most rivers, but true for river Goro, especially after rivers left upstream gorges. The reason might be the revitalization of channel erosion instead of deposition due to increasing in discharge accompanied by increasing channelbed slope, which enhances the erosive power of the water flowing in a confined channel mainly after x08 (railway bridge) to x11(back of health center). The channel cross-section at the back of Mermerssa (x12) maintains channel width similar to the width of the upper most cross-section, Haroga (x01). Finally, at the apex of the distributary reach (x14) width of the channel decreased with bank height less than 1meter. The reason is probably due to the loss of flow through the channel bed and banks. In addition, there is less intensity of bank vegetation and human influence on the channel in the floodout reach compared with upstream cross-sections. As a result, the river spreads and diverts its flow (particularly floodwater or bankfull flow that has channel-forming capability) over the banks.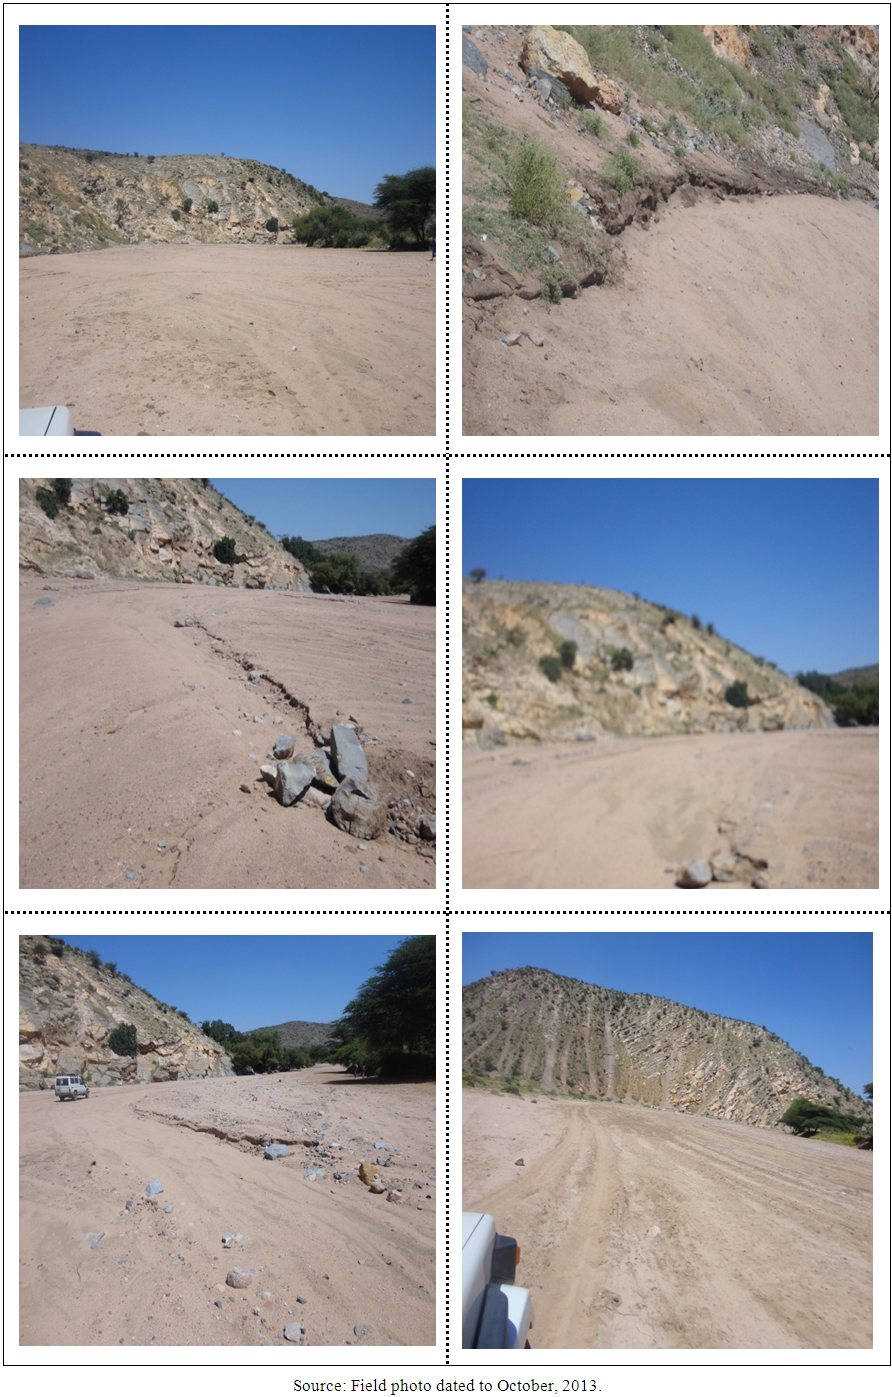 | Plate 2. Channel and bank situation in the reach between x07 (Genda Roba) and x08 (Railway bridge) |
Generally, speaking river Goro is narrow and deeper in its upper and lower reaches while wider and shallower in its middle reach. This generalization is only based on the representative surveyed cross-sections selected mainly based on the relative straightness of the reach where cross-section survey was conducted.
3.2. Downstream Change in Grain Size
The most representative grain size is required to see the downstream trends of grain size. In this study median grain size (D50) is considered to understand the downstream trend of grain size along the course of river Goro. Downstream fining in grain size usually explained quantitatively with respect to distance along the channel based on “Stenberg’s law.” This law, which is the most prominent and widely known in grain size study. According to “Stenberg’s law,” grain size decreases exponentially with distance downstream of a channel (Equation 23). This study checked to what extent the model works for river Goro taking the most representative grain size, median grain size (D50) as dependent variable and distance as independent variable.  | (23) |
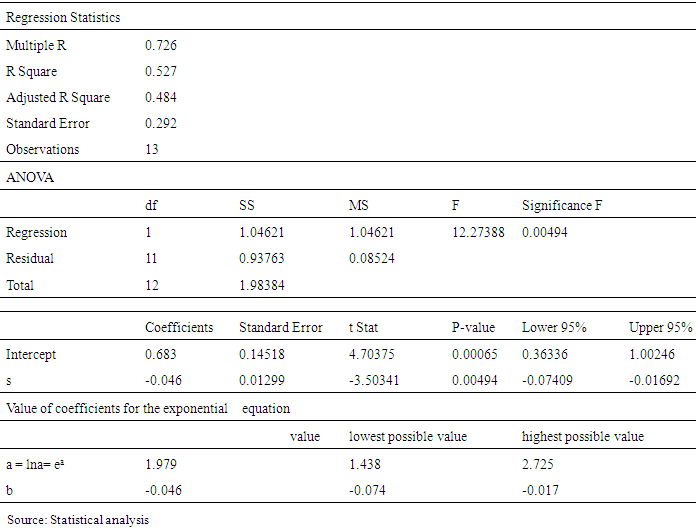
where, a and b are coefficients determined by regression, e = constant (2.718), s = downstream distance. The equation was changed to linear natural logarithm form to perform regression and get the values of coefficients. As indicated in Table 3 there is strong relationship between D50 and downstream distance, s (value of correlation coefficient, R = 0.73 significant at 95% confidence level as the value of F test is less than 5%). The study found that “Stenberg’s law” works well for River Goro. The equation that relates D50 and downstream distance for the study river is in the form of Equation 24, which can be interpreted as grain size decreases downstream of the study river with a finning coefficient of -0.046 at 95% level of confidence.Table 3. Regression statistics for D50 and downstream distance(s)
 |
| |
|
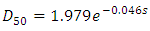 | (24) |
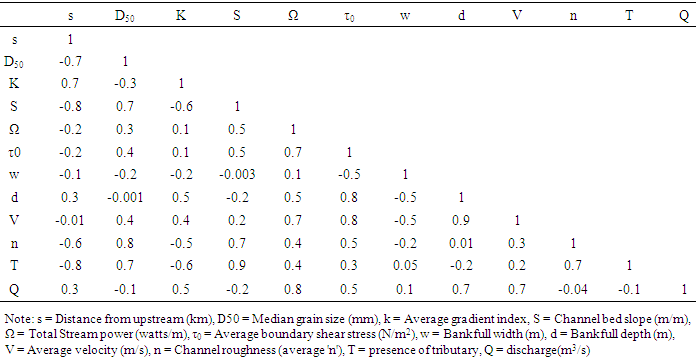
More than 95% of the time, the value of the coefficient (a) ranges between 1.438 and 2.725. Assuming other things constant and considering distance is the only factor that affect downstream fining, the value of the fining coefficient (b) for river Goro ranges between -0.074 and -0.017 (with more than 95% confidence level). However, the value for the coefficient of determination indicates that distance explains only 52.7% of the variation in grain sizes downstream of river Goro. This points us the presence of other determinants, which influence downstream trend in grain size along the study river. As already mentioned in the introduction section of this paper, numerous factors affect downstream trend of grain size along a river. Some of those factors considered in this study include concavity of channel profile, slope of the channel, total stream power, average boundary shear stress, channel width, channel depth, flow velocity, presence of tributaries and channel roughness. A location on stream of high concavity is expected to have relatively smaller grain size. However, it was difficult to determine concavity for a single surveyed reach for which data collected only from a location at the center of a reach. For this reason, average gradient index of each surveyed reaches was determined using GDEM data analyzed at watershed level. Though it may not tell us the exact concavity value of a reach, average gradient index helps us to explain whether a reach is concave or not in qualitative terms comparing one reach from the other. According to Hack [3], the change in gradient index reflects underlying geology, intrusion of tributaries and stream power or competence in transporting available grain size. For this reason, average gradient index (K) of each surveyed reaches was determined using GDEM data analyzed at watershed level (to substantiate the explanation for the concavity of the profile) after calculating gradient indexes for sites between locations where channel profile show sharp changes using Equation 25 introduced by[3].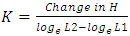 | (25) |
where K = Gradient Index, H = difference in elevation between the ends of a reach on which a point is located; L1 and L2 = distances from the watershed divide to the downstream and upstream ends of a reach respectively.Generally, median grain size, slope of the channel, average gradient index, shear stress, stream power, channel width, channel depth, velocity, channel roughness, presence of tributaries and discharge systematically varied at relatively similar distance from upstream reach of river Goro. This situation roughly indicates the existence of relationship among the variables and with distance downstream of Goro. Pearson product moment correlation coefficient (r) was used to measure the strength of relationship among 11 variables. The table of correlation matrix (Table 4) reveals that median grain size, average gradient index, channel bed slope, channel roughness and presence of tributaries have strong relation with downstream distance. Average gradient index has positive relation with distance downstream of Goro, which means that gradient of the stream increases downstream so that the river is more concave in its downstream section compared with its upstream reach. The negative correlation between presence of tributaries and downstream distance is obvious because the number of tributaries becomes smaller and smaller while we go to the mouth of the trunk river. However, the variable is included in the analysis because tributaries usually disrupt the normal fining of grain sizes along the main channel by introducing new differently sized sediments from different source area.Table 4. Correlation matrix table
 |
| |
|
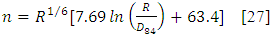
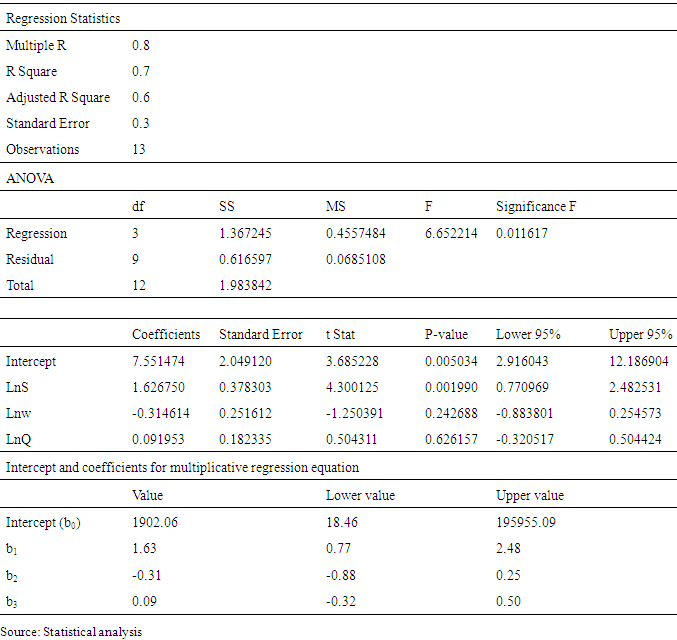
Except bankfull channel depth (that has medium correlation with distance downstream), other hydraulic variables such as total stream power, average boundary shear stress, bankfull channel width and average velocity have a very weak correlation with downstream distance that implies these variables donot have linear relationship with downstream distance. Discharge usually controls the downstream trends of most hydraulic and morphologic variables. In this study, discharge is negatively correlated to downstream distance because the correlation analysis includes downstream reach of River Goro, floodout area, where channel slope decline that led water to be distributed over wider. But, it does not mean that discharge in the upper reach is greater than discharge in the lower reach. Rather as per the data presented in (Table 6), discharge consistently increases downstream up to the end of Mermerssa, where urban settlement nearly ends up. The amount of downstream discharge affects the amount of sediment transported along the channel, but its influence works well in collaboration with flow velocity, depth, width, hydraulic radius and roughness of the channel. Stream power and shear stress positively related with discharge downstream of the study river where both of them increase. Generally, (Table 4) indicates the existence of relationship between median grain size and all other morphologic and hydraulic variables each play its own role on the variability of grain size downstream along river Goro.However, it is impossible to undertake multiple regression of D50 (as dependent variable) over other variables because most of the independent variables are collinear, that would have adverse impacts on the effectiveness of the model in predicting the downstream changes in grain size. For this reason, channelbed slope, width and discharge were selected as predictors (independent variables) because they have very low relationship among each other (less collinear). In addition, the consideration of variability in discharge and channel slope indirectly addresses variation other variables such as flow velocity, the power of the flowing water and shear stress. A river channel usually adjusts its width with the amount of discharge (sediment and water). Therefore, width of the channel was considered as one of the independent variables because it potentially affects the channel roughness condition and velocity, both in turn affect grain size distribution. Finally, multiple regression was conducted in order to see the effect of slope, width and discharge on the downstream trend of grain sizes. It is widely accepted to perform multiple regression analysis in the form of the following equation.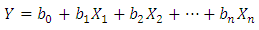 | (26) |
where, Y represents dependent variable; X1, X2 ... Xn are independent variables; b0 is constant of the regression; and b1, b2 ... bn are regression coefficients of independent variables. However, Equation 26 is a “linear additive regression model,” which is not usually applicable in hydraulics [26]. The same author proposed “linear multiplicative regression model” to handle variables of channel hydraulics in regression technique. Similarly, the considered variables of the surveyed reaches of river Goro were related using the following “multiplicative regression model.”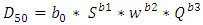 | (27) |
where, D50 = median grain size for which 50% of the grain size is finer (mm), S = channel bed slope of the surveyed reach (m/m), W = bankfull channel width (m), Q = bankfull discharge (m3/s), b0 = intercept of the multiplicative regression  in Equation 28),
  = exponents of respective variables.Then Equation 27 converted to linear natural logarithmic expression (Equation 28) to undertake multiple regression and to obtain the values of coefficients and exponents.
  | (28) |
The summary of regression statistics (Table 5) indicates that the regression is statistically significant (where the value of F significance is 0.01, which is less than 0.05). The equation that relates median grain size and assumed predator variables (channelbed slope, channel width and discharge) for the study river is: | (29) |
Table 5. Regression statistics of median grain size over channelbed slope, bankfull width and bankfull discharge
 |
| |
|
The intercept of the regression equation and the exponent of channelbed slope are statistically significant at 95% and 99.8% confidence level respectively. Whereas, the exponents of bankfull channel width and bankfull discharge are not statistically significant. This shows us channelbed slope is the most determinant variable compared with width and discharge even though the three variables collectively explain about 60% (Adjusted R2 = 0.6) of the downstream variation in grain size (Table 5).From Equation 29, we can also learn that increasing in the slope of the channelbed potentially enhanced the capacity of the river in transporting larger grain size by increasing stream power and velocity. As we have seen earlier, discharge continuously increased downstream in most reaches of the study river upto the floodout area. The amount of discharge in the lower reach ranges between 508 m3/s and 580 m3/s. Almost all part of the lower reach is within urban area. Urban areas are known for their impervious nature so that every drop of water has high chance to be turned in to run off that might increase discharge of the study river in the vicinity. The downstream increasing trend in its average gradient index (Table 6) implies the increasing capacity or competence of the study river in transporting suspended sediment up to the end of its lower reach. Though grain size shows a fining trend with exception of few anomalies at railway bridge and road bridges (Table 6), the rate of downstream fining is not rapid rather consistent between cross-sections. Therefore, Equation 29 appropriately explains that channel slope should increases wherever necessary to provide the required velocity so as to accommodate the increasing influx of discharge (water and suspended load). In other words downstream variation in grain size of the study river largely attributed to slope of the channel. For instance, decreasing in channel slope may lead to decrease the velocity required to transport larger sized particles. However, the natural frictions due to hydraulic radius is minimized downstream particularly in the lower reach so that the river can easily maintained its sediment transport with the available velocity.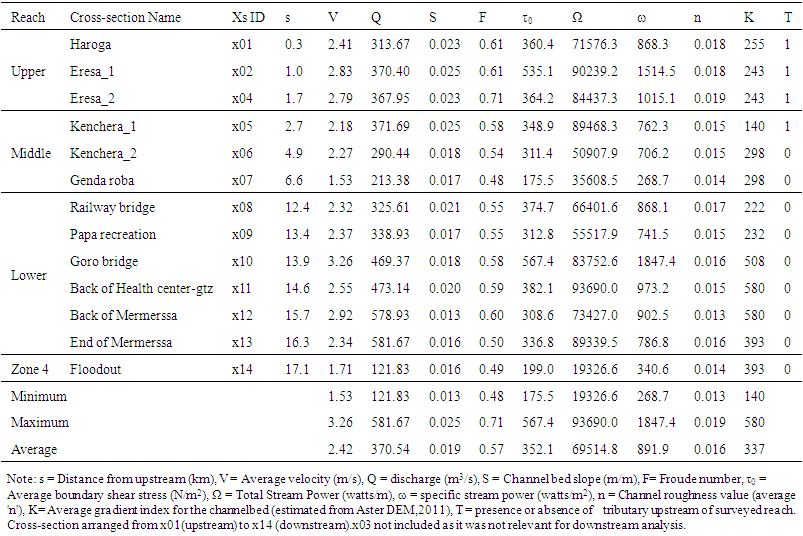 | Table 6. Flow /hydraulic parameters of river Goro |
3.3. Flow/Hydraulic Parameters Downstream of River Goro
In the previous sections, we have seen morphological, sediment size and hydraulic characteristics of the study river more or less with downstream distance. Moreover, we have also tried to point out the possible reasons affecting the downstream trends of channel morphology variables and grain size in the study river. However, the channel morphology, sediment size and hydraulics of a channel are interrelated to each other if one tries to analyze them together. For instance, morphology of the channel (the slope, form and size of the channel cross-section) affects the flow behavior and sediment influx, which in turn affect the hydraulic characteristics. As far as the cause changes downstream, the effect inevitably change too. This section mainly discusses about the change in hydraulic characteristics downstream of river Goro in response to changes in cross-sectional size of the surveyed cross-sections. Of course, it is very difficult to distinguish which hydraulic variable comes one after the other because all geomorphic and hydraulic variables in a river system operate together and channel forms simultaneously respond and adjust themselves to the operating processes. Tabular and graphical presentations used to support qualitative explanations of the topic under discussion.a. Velocity and DischargeThe minimum, maximum and average bankfull discharge of river Goro is 121.8m3/s, 581.7m3/s and 370.5m3/s respectively. The trend of discharge downstream of Goro is very similar to the downstream trend of cross-sectional area (Figure 8). In the upper reach, there is no much variation in discharge though it shows a decreasing trend. However, in the middle reach the trend of discharge is not similar with the trend of cross-sectional area where the former and the later show a decreasing and an increasing trend respectively. This is associated with the decreasing trend of channel bed slope that cause velocity to decrease so that a slowly flowing water infiltrated in to the channel bed, which is covered by porous bed material, sand. In the lower reach, discharge exhibited downstream increasing trend particularly starting from x08 (railway bridge) immediately after the main trunk leaves the rugged terrain and join the low land plain urban area. In his study on ephemeral rivers in Kobo basin, North eastern part of Ethiopia, Billi [20] has found that maximum discharge attained in the reach near to the end of the mountain catchment. In contrast to his finding, river Goro reaches to its maximum discharge downstream at the end of Mermerssa (x13), where the intensity of urban land use (particularly density of settlement) starts to decrease. The increasing in discharge may be associated with the surface flow from urban area, which is characterized by lower infiltration of rain storms compared with the non-urbanized catchment.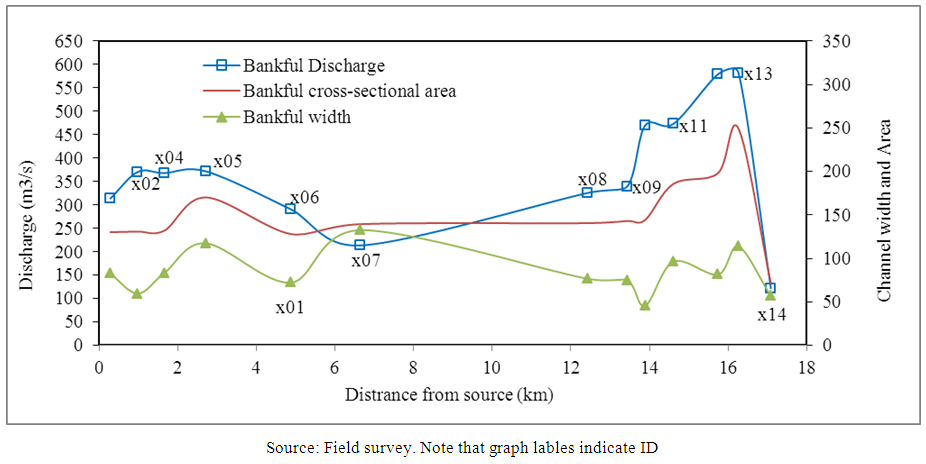 | Figure 8. Trends of width, cross-section area and discharge downstream of Goro |
The minimum, maximum and average flow velocity for the whole of river Goro is 1.5m/s, 3.3m/s and 2.4m/s respectively. The flow velocity that ranges between 2.4m/s and 2.8m/s shows a decreasing trend in the upper reach. This indicates that velocity is less variable downstream of the upper reach because of the fact that smaller variation in channelbed slope. Moreover, the increasing in channel depth donot significantly affected velocity throughout the same reach. The increasing in the depth of the channel is compensated by a minor increase in channel bed slope at x02 (Eressa 1), which enhanced the capacity of that cross-section to transfer the flow influx and energy downstream. At the middle reach, velocity continues to decrease. Though decreasing in velocity was expected in the lower reach of the channel where many man-made structures (like bridges, gabions, physical bank stabilizing structures), it has generally exhibited a variable trend especially up to the end of Mermerssa (x13) after which discharge starts to splay out and form distributary channels. The variation in velocity is because of significant variation in channelbed slope and roughness from cross-section to cross-section found in the lower reach. Generally, in the lower reach of Goro velocity changes downstream in accordance with changing in channelbed slope, channel depth, grain size and roughness (Figure 9 and Table 6).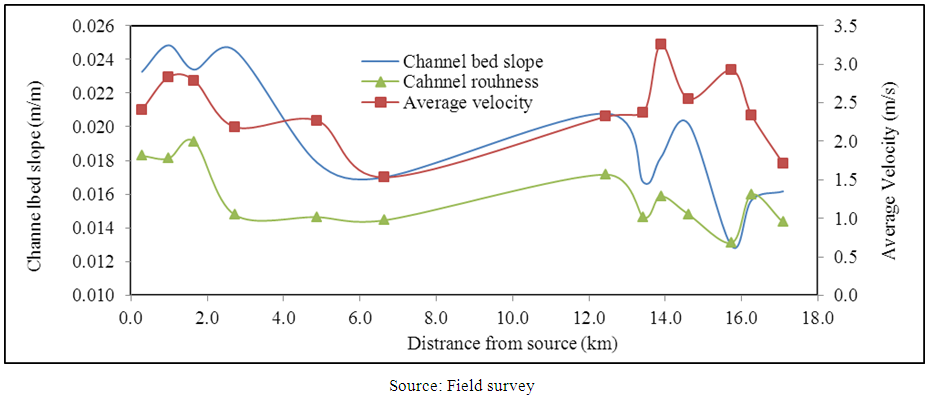 | Figure 9. Downstream trends of channel bed slope, average velocity and roughness |
b. Flow typeAs indicated in Table 6, river Goro exhibits subcritical flow regime since its Froude number (F) is less than one, which is true for most natural channels. The minimum, maximum and average value of F is 0.48, 0.71 and 0.57 respectively. This indicates that the water along the study channel is flowing at relatively higher depth with slow velocity whereby the flow is commonly known as “tranquil” flow regime. In other words, the depth of the channel highly controls the specific energy of the channel. The other important point noted here is that critical depth changes linearly with the change in bankfull depth downstream of Goro. Knowing critical depth of a channel is very important for channel management so that the concerned bodies may use this data for depth related management. Therefore, using least square line of fit, it was found that critical depth, dc of river Goro changes at the rate of 0.7 times its bankfull depth, d (value of R2 = 0.96, Figure 10).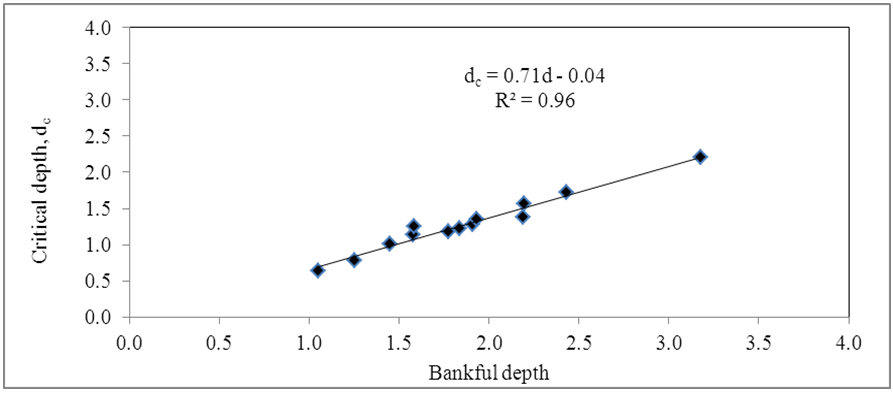 | Figure 10. Relation of critical depth to bankfull depth |
c. Boundary shear stressIn the context of open channel flow shear stress refers to the force applied by the flowing water on the channelbed over which it flows. As indicated in the methodology of this paper, the average boundary shear stress at bankfull discharge is the product of the specific weight of water, channel bed slope and hydraulic radius (equal to bankfull depth based on uniform flow assumption for surveyed reach in this study). Shear stress plays one of the most important roles in the movement of bedload and sediment transport in a channel. Sometimes it is known as the drag force, which refers to the force of flowing water that can drag the channel material along with it downstream. Materials on the channel start to move when this drag force exceeds the gravitational force that holds channel materials in place. The minimum, maximum and average boundary shear stress of the study river is 175.5, 567.4 and 352.1 N/m2 respectively. The downstream trend of average boundary shear stress is very similar to the downstream trend of channel depth (Figure 11). Starting with variable trend in the upper reach, average boundary shear stress shows a decreasing trend in the middle reach. Finally, in the lower reach, the trend line of shear stress goes up and down that shows variation in its downstream trend. As indicated in Table 6, boundary shears stress changes along with the change in cross-sectional morphology (particularly channel depth and channelbed slope). Based on the R2 value (computed from the multiple correlation coefficients between channelbed slope, channel depth and shear stress), the downstream percentage variation in average boundary shear stress explained by channelbed slope and depth of the channel account for 56.8% and 21.2% respectively. This indicates us channel depth is the dominant factor that affects the variation of boundary shear stress downstream of Goro.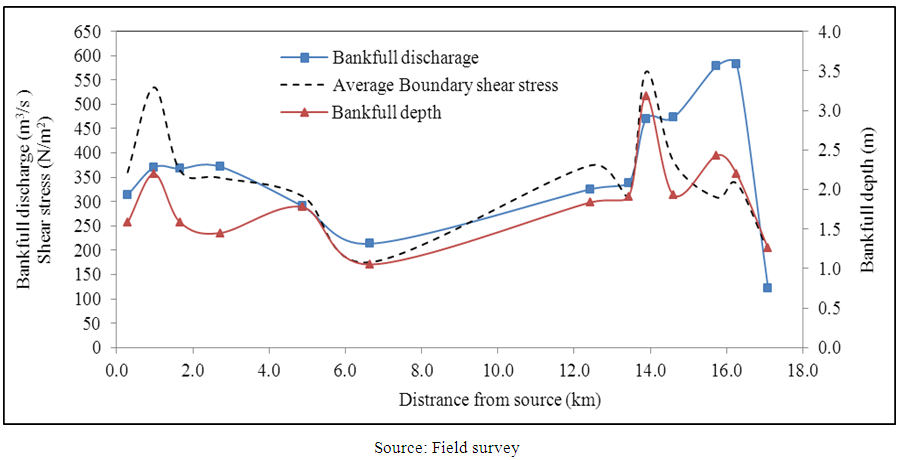 | Figure 11. Downstream trends of bankfull discharge, cross-section depth and boundary shear stress |
d. Stream powerThe total stream power of river Goro ranges between 19,326.6 watts/m (minimum) and 93,690 watts/m (maximum). The maximum total stream power documented in the lower reach, particularly at x11 (back of health center, GtZ), where both channelbed slope and discharge are simultaneously higher than the values of the same variables of other cross-sections in the reach. The minimum total stream power is documented immediately after the outlet of the watershed where the flow is expected to disperse. The average total stream power for the whole reach is 69514.8watts/m.Many authors, who studied the downstream distribution of stream power along channels, argued that stream power should be higher at the middle of the channel and slope is the major responsible factor for its variation at reach level (Knighton, 1999, and Fonstad, 2003; Reinfelds et al., 2003; Jain et al., 2006 in [29]. However, this study found the highest stream power in the lower reach. The downstream trend of total stream power is almost similar to the downstream trend of discharge and channel bed slope in all reaches because total stream power is a multiplicative function of specific weight of water, discharge and slope of the channel. Forinstance, in the upper and middle reach, total stream power shows a decreasing trend as similar trend as discharge exhibits. Compared with the upper and middle reaches total stream power is higher in lower reach where discharge shows an increasing trend. The variation in slope of the channel is also responsible factor in explaining the variation in total stream power in the lower reach while discharge keeps increase in most of the cross-sections of the same reach. Forinstance, total stream power decreases at x09(papa) along with minor decreasing in channelbed slope and it increases at x11 (GtZ) together with minor increase in channelbed slope. However, later at x13(end of Mermerssa), it is clearly indicated that the channel achieved a 21.6% increase in total stream power with increasing in discharge and channelbed slope by 27.4% and 21.1% respectively. Had slope been the dominant factor in explaining the variation in total stream power, stream power would not have been decreased by 78.4% at x14 (floodout) where the channelbed slope remain unchanged. On the other hand, discharge at x14 (floodout) decreased by 79.1%, which is nearly similar to the percentage decrease of total stream power. In addition, the coefficient of determination (R2) computed from multiple correlations between total stream power, slope and discharge revealed that 61.1% and 21.5% of the downstream variation in stream power is explained by bankfull discharge and slope respectively. Therefore, we can conclude that the downstream variation in total stream power of the study river is highly explained by the variation in the amount of discharge followed by the variation in channelbed slope.Since stream power has implication to the major operating channel processes, it gives clues on considerations to be taken in flood related risks and hazard assessment. Location in the channel where there is high stream power indicates the intensity of geomorphic works such as channel incision, scouring, and widening. Whereas, location with low stream power imply for the possible occurrence of channel deposition or channel aggradation. This study clearly indicates that the stream power is very high in the settlement area (lowland alluvial plain) as opposed to the report of Cooley [29]. Land use practices (particularly settlements) at the flood plain of the channel adjoining the lower reach of river Goro are susceptible to flooding since the downstream trend of channel width up to the end of Mermerssa indicates a widening trend. Moreover, during the field survey, the researcher observed that many young men established their livelihood on the channel sand. These people extract relatively fine sands from the riverbed and sell it to their customers, who need it for construction purpose. As per the discussion with the sand extractors, they revealed that they earn an average daily income of 300 to 400 Ethiopian Birr (USD 15 to 20 based on average exchange rates in October 2013). This potentially worthwhile business can attract other sand extractors. In addition, Dire-Dawa is recently expanding to the western and the northern direction (to which the study river is flowing). In accordance with the wide urban development in Dire-Dawa, the need for construction materials including sand is inevitable to increase. These factors may bring more demand of sand, which will encourage sand extraction from the riverbed. This situation may produce two important outputs related to the hydraulics of the channel. Firstly, decreasing in the volume of the channel sand may lead to the reduction of the natural flow friction; an increase in stream power or increase sediment starvation of the water flowing in the stream, which both may result in channel incision and bank failure. Secondly, sand extractors leave many holes and trenches on the channelbed in search of finer sand materials (see Plate 3). These man-made holes and trenches may deflect the natural, channelized flow direction of the stream to outside of the banks during bankfull flow. Holes and trenches may also act as flow resistances, which consequently reduce flow velocity and increase channel aggradation. All of these human induced hydraulic changes (associated with inchannel flow deflection and channel aggradation) potentially increase the risk of flooding adjoining lower reach of river Goro and further downstream area to where the urban settlement is expanding. The researcher recommends to use the river sand in ways that do not disturb the hydraulic processes of the river, otherwise it may bring potential flood hazard. So any channel management and sand extraction should be based on detail account and studies of the geomorphological, climatic and hydrologic variables relevant to the short term and long-term responses in geomorphic process and hydraulic characteristics of river Goro.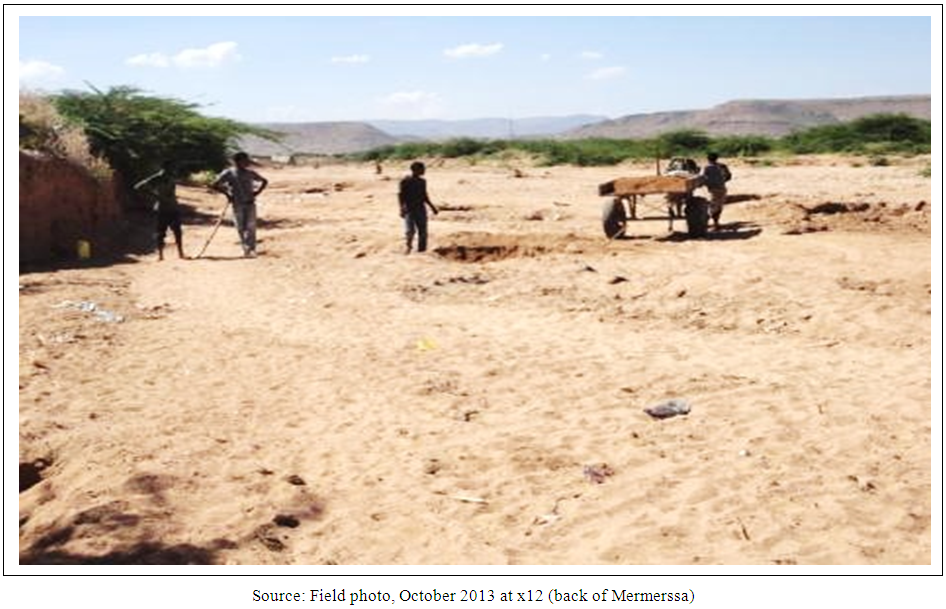 | Plate 3. Sand extraction in the lower reach of river Goro |
3.4. Major Geomorphic processes: Mode of Sediment Transport and Boulder Entrainment
a. Mode of sediment transportIn this study, the critical shear stress (i:e the stress required for the first initiation of a certain grain size) of the study channel is assumed equal to the average boundary shear stress at bankfull flow. The result in Table 7 indicates that suspension is the most dominant mode of sediment transport in River Goro at bankfull flow. Using mean grain size (determined after sieve analysis) Modified Udden-Wentworth (1957) was used to identify the category of grain sizes transported by the study river. The result in (Table 7) indicates that the mean grain size transported in the form of suspension ranges between coarse sand (0.71 mm) and very fine gravel (2.72 mm).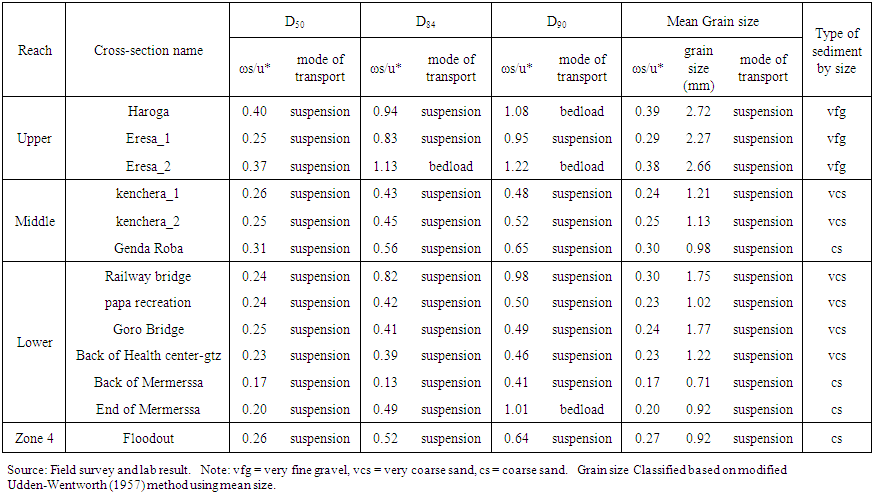 | Table 7. Mode of grain size transport of River Goro for selected percentile grain sizes |
Erosion and transportation are major geomorphic processes operating in the study river. In (Figure 12), the table at the left side indicates the average velocity (cm/s) and grain size classes for each surveyed cross-sections. The diagram in the right side is the Hjulström diagram that relates velocity, grain size, erosion velocity and deposition velocity for natural rivers. In the Hjulström diagram, the upper curve and lower curve indicate the critical erosion velocity and the critical deposition velocity (fall velocity) respectively. The critical erosion velocity curve displays the minimum velocity needed to erode and transport a particle size, where its diameter specified on X- axis of the diagram. On the other hand, the settling velocity curve indicates the minimum velocity at which particles with different sizes deposited by a river. The areas between the curves and shaded with different colors indicate the type of process that will be involved for particles that are found in those shaded areas. The minimum and maximum flow velocity for the whole Goro is 153.1cm/s and 325.6 cm/s of respectively. Flow velocity of the study river in all surveyed cross-sections lie above 100 cm/s. If we draw straight line from the velocity axis of the Hjulström diagram for all velocities of the study cross-sections, we pass only through shaded areas that represent transportation and erosion. From this, we can learn that River Goro can transports grain sizes classes ranging between clay and cobbles throughout its course at bankfull discharge. This was confirmed, by field survey in cross-section 13 (end of Mermerssa) where cobbles and large gravels were seen lying on the channel bed (see Plate 4) though there was no other tributary that would bring and introduce these large sized grains to the main channel. Grain classes of the study river falls in erosional region of Hjulström diagram particularly in a region where velocity increases with increasing the grain size diameter. These condition exposed grain sizes mainly for erosion followed by transportation that goes in line with the analysis for the modes of sediment transport explained in previous paragraph. The dominancy of erosion as a major process over other processes operating in river Goro was also substantiated by field observation where valley widening (in upper and some part of middle reach) and valley deepening were observed channel responses. Valley deepening is more common in the lower reach where its flow area is highly constricted by artificial structures along the banks of the river.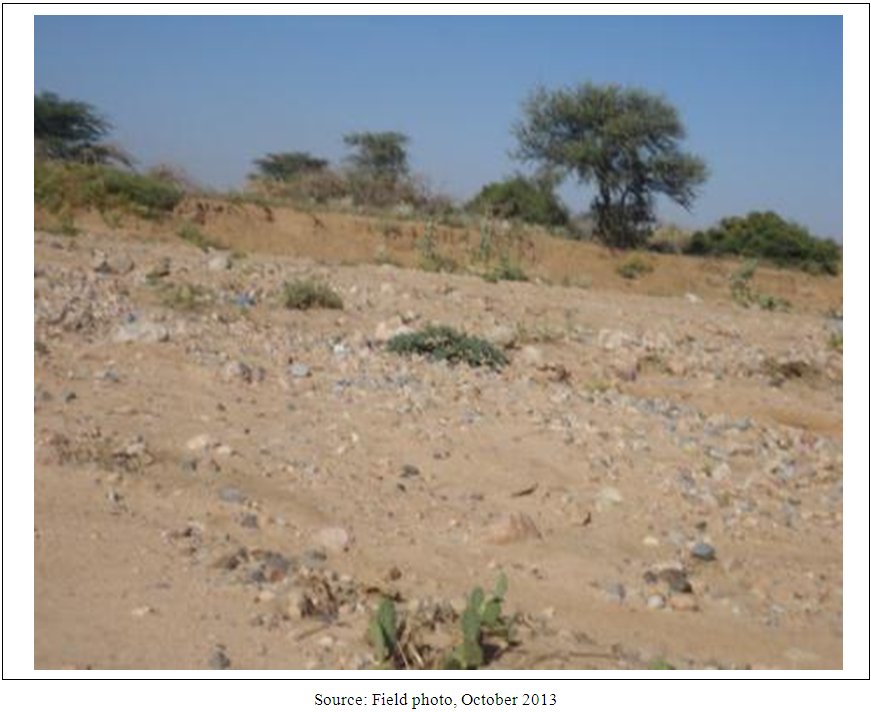 | Plate 4. Channel boulders and cobbles at downstream of river Goro (x13, End of Mermerssa) |
Generally, the dominance in erosion followed by transportation of sediments with wider ranges of grain size might cause river Goro to exhibit plain bed devoid of major observable bedforms in most of its reaches as confirmed by filed survey. Plate 4 indicates the capability of river Goro in transporting wider ranges of grain sizes including boulders. The next section discusses about boulder entrainment and transport capacity of the study river. 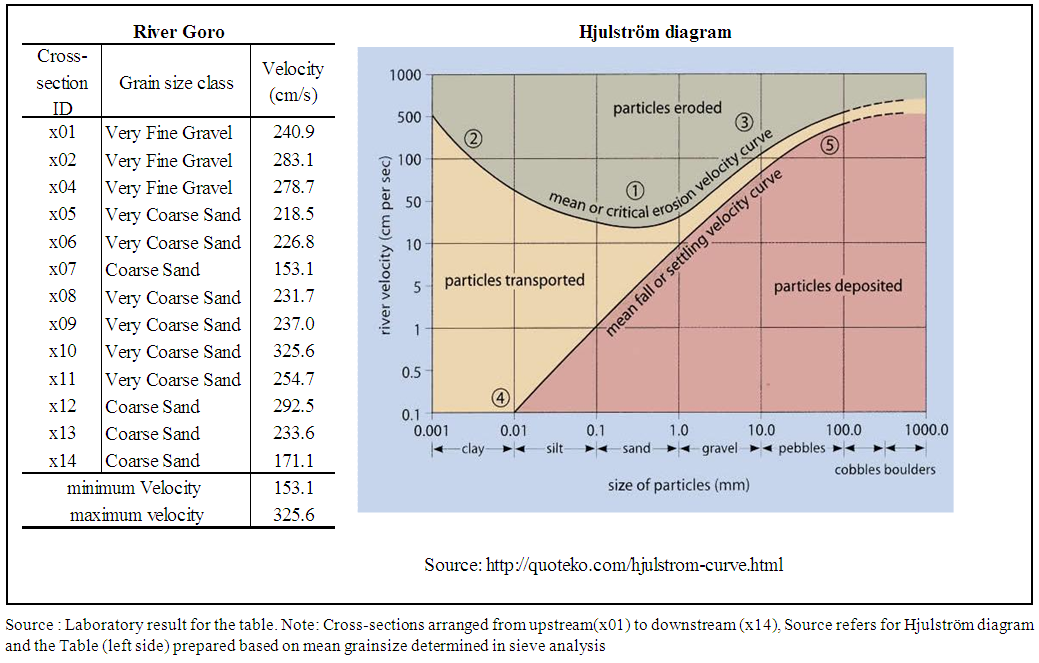 | Figure 12. Identification of major geomorphic processes based on Hjulström diagram |
b. Boulder entrainment and transport capacity of river GoroBoulder prediction equations proposed by five researchers (see Equation 16-20) were used to predict the size of maximum boulder entrained by the study river at its bankfull flow and to compare each model with the boulder size measured at the field. As indicated in Table 8, only Milhous’s equation predicted values very close to the size of boulders measured at the field. The variation among models in the predicting the maximum size of the boulder entrained and transported by river Goro probably attributed to the initial environmental situations (humid and temperate areas) for which the models were developed. None of the equations accounted rivers found in dryland areas [19].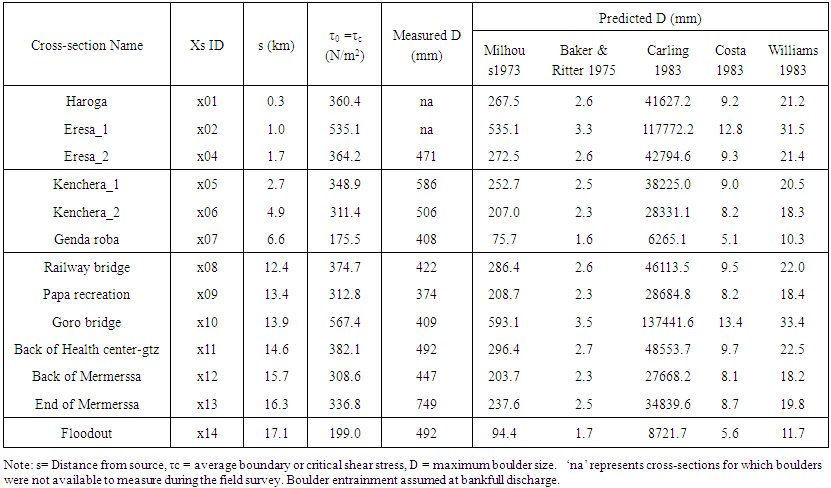 | Table 8. Measured and predicted boulders in River Goro |
Based on the measured boulders, maximum size entrained and transported by bankfull flow ranges between 374mm and 749mm. River Goro capable to transport big boulders up to its downstream reaches where no tributary joins the main trunk. Most boulders observed at downstream reaches are basalt and granite boulders, which are very much similar to those types of boulders observed in the middle reach where hillslope erosion is common (Plate 5a and Plate 5b). For about 8km between x06 (kenchera 2) and x08 (rail way bridge), the route of the channel is confined within bare, steep hills with exposed basalt and granite rocks. Because of natural and human induced weathering plus probably gravity pull along the steep hills, might force boulders to roll down to the channel bottom (Plate 5b). Such types of boulders are readily available to be entrained at bankfull flow and transported to downstream reach (Plate 5c, Plate 5d and Plate 5e).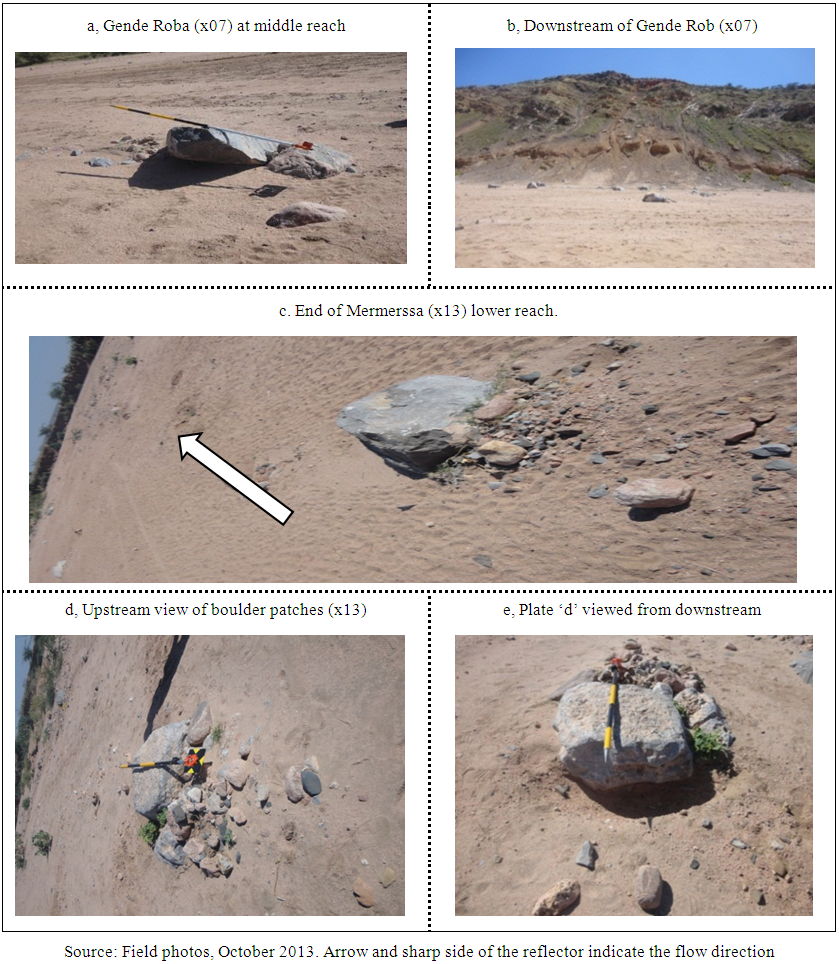 | Plate 5. Samples of boulders at middle and lower reaches of river Goro |
Generally, river Goro, transports big boulders nearly up to its mouth. This situation was one of the strange characteristics of river Goro, which deviated from the known facts and theories of fluvial processes. For this reason, the researcher personally communicated to a well-known professor of fluvial geomorphology, Paolo Billi, who worked many researches on the channel dynamics of ephemeral streams in Northeastern Ethiopia and East African countries to confirm the reality of the situation for further clarification. In his e-mail response, he said, according to his long experience, he is convinced that the flow of river Goro at bankfull discharge is able to move boulder much larger than what normally expected by fluvial geomorphologists and hydraulic engineers. In Kobo dry river, he had seen that “large blocks of a collapsed bridge traveled more than two kilometers in a couple of years.” Goro bridge (at x06) was collapsed by a flood event occurred in March,2016 (1 year after this research project was finished) and one of its large blocks was transported nearly 50m downstream within a week.
4. Conclusions
• Generally, upper reach of river Goro is wider than its middle and lower reaches. The establishment of urban settlement on the formerly formed alluvial fan might cause the lower reach to exhibit narrower and deeper channel with width to depth ratio ranges between 14.3m and 51.8. This indicates the shift in the type of geomorphic processes (from channel aggradation to channel degradation) as we go from upstream to downstream. Such reverse in geomorphic processes is uncommon in the lower course of most natural rivers, but true in river Goro, after they left upstream gorges. The reason might be the revitalization of channel erosion instead of deposition attributed to increasing in discharge after x08 (railway bridge) and channel route constricted by artificial structures on both sides of the river bank. The decrease in the size of the channel at the apex of the distributary reach (x14) must be attributed the loss of flow through the channel bed and/or banks because the channel at floodout reach is less influenced by the constricting effects of land use and other man-made structures compared with upstream cross-sections. • The median grain size of river Goro generally decreases downstream. River Goro well discerned “Stenberg’s law” whereby grain size decreases with increasing distance downstream with a finning coefficient of -0.046 (at 95% level of confidence). However, reach wise comparison in downstream trend of grain size indicates the presence of exceptions in few cross-sections (like x02, x08 and x13) where grain sizes deviated from the decreasing pattern because of the introduction of new sediments by tributaries and human induced disturbances on the channel materials. Other factors such as channelbed slope, bankfull width and discharge also explain downstream trends of grain size. Multiplicative regression equation developed to see the effect of slope, width and discharge on the distribution of grain sizes downstream of river Goro. The result revealed that variation in grain size downstream of the study river is largely attributed to channel bed slope. Equation 24 is recommended to predict median grain size downstream of river Goro with respect to distance if one wants to use it in the absence of measured grain size data. To use Equation 29 for the study river, we need further verification based on flow and sediment data measured directly at the field during bankfull flow. At this stage, it may not be viable to use this equation unless one wants to have rough estimation of grain sizes with respect to variation in discharge, channel slope and width. So one should take due consideration of the risks of errors and confidence limits for the exponents of width and discharge presented in regression statistics (Table 5) while using Equation 29 for river Goro.• Discharge increases with increasing cross-sectional area. In contrast to many findings that state discharge of most rivers reaches at maximum in reaches immediately after rivers left mountainous/hilly/ catchments, river Goro attain its maximum discharge downstream at the end of Mermerssa (x13), where the intensity of urban land use (particularly for settlement) starts to decrease. The reason might be associated with the surface flow from urban areas, which are characterized by lower infiltration compared with the non-urbanized catchments. Therefore, land use types also affect the location at which discharge of river could reach at maximum, which in turn affect the time of flow concentration and associated geomorphic processes. Velocity variation downstream of river Goro is because of significant variation in channel slope and roughness from cross-section to cross-section found in the lower reach. Generally, in the lower reach of Goro velocity changes in accordance with changing in channel bed slope, depth, grain size and roughness. Average boundary shears stress changes along with the change in cross-sectional morphology (channel width and channel bed slope). This study found that stream power is highest at the lower reach where discharge is high. The downstream trend of total stream power is almost similar with the downstream trend of discharge and channelbed slope in all cross-sections because total stream power is a multiplicative function of specific weight of water, discharge and slope of the channel. All of those expected human induced hydraulic changes explained in section 3.3d page 21 probably bring future flooding risks near the lower reach of river Goro and more downstream area to where the urban land use (especially settlement) is currently expanding. The researcher recommends to use the river sand in ways that do not disturb the natural hydraulic processes and channel adjustment behavior of the river to reduce potential flood hazard. So any channel management and sand extraction should be based on detail account and studies of the geomorphological, climatic and hydrologic variables relevant to the short term and long-term responses in geomorphic process and hydraulic characteristics of the study river.• Suspension is the most dominant mode of sediment transport in river Goro at bankfull flow. The mean grain size transported in the form of suspension ranges between coarse sand (0.71mm) and very fine gravel (2.72mm). Cobbles and boulders that have similar physical appearance and characteristics of rocks (parent rocks) found in vicinity of middle reach were also observed in the lower reach up to cross-section 13 (end of Mermerssa) which indicate river Goro entrains and transports large boulders. Milhous’s equation predicted size values very close to measured boulders. The maximum boulder size entrained and transported by river Goro at bankfull flow ranges between 374mm and 749mm. Generally, river Goro, transports big boulders nearly up to its mouth because of increasing trend in discharge, shear stress and stream power downstream. This study also proposes to use Milhous’s equation to estimate the maximum boulder size entrained and transported by river Goro and other similar rivers found in the same environments if engineers want to design structures to be built along the same channel under study or along other similar rivers. However, this equation is best utilizable only in the absence of measured flow and hydraulic data. If possible to measure flow data, the concerned engineers and other researchers may use Milhous’s equation with appropriate test for its validity and reliability. • Channel erosion is the dominant process in the study river particularly in its lower reach. This situation is one of the strange characteristics of river Goro, which deviated from the known facts and theories of fluvial processes. Researches, conducted on ephemeral rivers so far are spatially limited to few areas of the world and only a couple of studies are available in Ethiopia. Besides few in number, the available studies on ephemeral rivers gave little concerns on the geomorphic processes and hydraulic characteristics. Studies at watershed scale are required to understand the hydro-geomorphic behavior of ephemeral rivers in Ethiopia. Therefore, the researcher recommends others to take detail study emphasizing on the relation of morphometric parameters and channel hydraulic variables taking numerous ephemeral streams. It is also essential to compare ephemeral stream with perennial streams interms of their hydraulic characteristics, channel adjustment behavior and other geomorphic processes.
ACKNOWLEDGEMENTS
Our appreciation goes to all institutions and experts who directly and indirectly helped us for the success of this research. To mention them Department of Surveying and Department of Civil Engineering, DDIOT, Dire-Dawa University, Ethiopia; Department of Geography and Geo-informatics, OU, India; Embassy of the Federal Democratic Republic of Ethiopia, New Delhi; and Ministry of Education, Ethiopia. We also extend our sincere appreciation to Prof. Paolo Billi (University of Ferrara, Italy) for his kind professional advice he gave us through mail. Finally, we owe our deepest gratitude to Mr. Eskinder Ayele, Mr. Derese Kumssa and Mr. Addis Belete for their unreserved and all round support they provide us during field survey and data collection.
References
| [1] | UNEP. Status of Desertification and Implementation of the United Nations Plan of Action to Combat Desertification, Report of the Executive Director. United Nations Environment Programme. In Nirobi; 1992. |
| [2] | Rădoane M, Rădoane N, Dumitriu D. Geomorphological evolution of longitudinal river profiles in the Capathians. Geomorphology. 2003; 50: 293–306. |
| [3] | Hack JT. Stream Profile Analysis and Stream Gradient Index. Jour Res US Geol Surv. 1973; 1(4): 421–9. |
| [4] | Miall AD. The Geology of Fluvial Deposits: Sedimentary Facies, Basin Analysis and Petroleum Geology. Berlin, Hedenberg, New York: Springer; 2006. 599 p. |
| [5] | Tooth S. Process, form and change in dryland rivers: a review of recent research. Earth-Science Rev. 2000 Aug; 51(1-4): 67–107. |
| [6] | Renard Keneth.G; Laurrsen Emmett.M; Members and ASCE. Dynamic Behaviour Model of Ephemeral Stream. J Hydraul DIivision. 1975; 101(No:HYY5, May). |
| [7] | Merritt DM, Wohl EE. Downstream hydraulic geometry and channel adjustment during a flood along an ephemeral, arid-region drainage. Geomorphology. 2003 Jun; 52(3-4): 165–80. |
| [8] | Kemp J. Downstream channel changes on a contracting, anabranching river: The Lachlan, southeastern Australia. Geomorphology. Elsevier B.V.; 2010 Sep; 121(3-4): 231–44. |
| [9] | Bui E, Mazullo J, Wilding L. Using quartz grain size and shape analysis to distinguish between aeolian and fluvial deposits in the Dallol Bosso of Niger (West Africa). Earth Surf Process Landforms. 1990; 14: 157–66. |
| [10] | Friedman G. Differences in size distributions of populations of particles among sands of various origins. Sedimentology. 1979; 26: 3–32. |
| [11] | Folk R, Ward W. Brazos River bar: a study in the significance of grain size parameters. J Sediment Petrol. 1957; 3–26:3–26. |
| [12] | Leopold LB, Miller JP. Ephemeral streams - hyraulic factors and their relation to the drainage net. Prof Pap US Geol Surv. 1956; 282A. |
| [13] | Rădoane M, Rădoane N, Dumitriu D, Miclaus C. Downstream Variation in bed sediment size along the East Carpathian rivers: evidence of the role of sediment sources. Earth Surf Process Landforms. 2007; |
| [14] | Lewin J, Brewer P. Labratory Simulation of Clast Abrasion. Earth Surf Process Landforms. 2002; 27: 145–64. |
| [15] | Leopold LB, Maddock TJ. Hydraulic Geometry of Stream Channel and Some physiographic Implications: US Geol Surv Prof Pap. 1953; 252. |
| [16] | Shulists S. Rational Equation of Riverbed Profile. Am Geophys Union Trans.pt3. 1941; 622–9. |
| [17] | Mackin JH. Concept of the Graded River: Geol Soc Am Bull No. 1948; 59: 463–512. |
| [18] | Dietzen C. Controls on Downstream Changes in Grain Shape and Size in the Mameyes Rive, Puerto Rico. Pennsylvania; 2012. |
| [19] | Billi P. Bedforms and sediment transport processes in the ephemeral streams of Kobo basin, Northern Ethiopia. Catena. 2008 Sep; 75(1): 5–17. |
| [20] | Billi P. Morphology and sediment dynamics of ephemeral stream terminal distributary systems in the Kobo Basin (northern Welo, Ethiopia). Geomorphology. 2007 Mar; 85(1-2): 98–113. |
| [21] | Tooth S, Nanson GC. The role of vegetation in the formation of anabranching channels in an ephemeral river, Northern plains, arid central Australia. Hydrol Process. 2000; 14: 3099–117. |
| [22] | WWDSE. Dire Dawa Administrative council integrated Resource Development Master plan study project. Addis Ababa; 2003. |
| [23] | Girma M, Vijaya B. Morphometric Characteristics and the Relation of Stream Orders to Hydraulic Parameters of River Goro: An Ephemeral River in Dire-dawa, Ethiopia. Univers J Geosci. 2015; 3(1):13–27. |
| [24] | Kondolf GM, Piégay H. Tools in Fluvial Geomorphology: Problem Statement and Recent Practices. In: Kondolf GM, Piégay H, editors. Tools in Fluvial Geomorphology. Chichester,: John Wiley & Sons, Ltd; 2003. p. 0–471. |
| [25] | Billi P. Flash flood sediment transport in a steep sand-bed ephemeral stream. Int J Sediment Res. 2011; 26(2): 1–17. |
| [26] | Dingman LS. Fluvial Hydraulics. Oxford, New York: Oxford University Press; 2009. |
| [27] | Brunner GW. HEC_RAS, River Analysis System Hydraulics Reference Manual. USA: U.S. Army Corps of Engineers, Hydrologic Engineering Center; 2010. p. 411. |
| [28] | Ferguson R, Church M. A simple universal equation for grain settling velocity. Journal of Sedimentary Research. 2004. |
| [29] | Cooley SW. GIS4Geomorphology: [Internet]. 2014. Available from: http://www.gis4geomorphology.com. |

 Abstract
 Reference
 Full-Text PDF
 Full-text HTML