Oki A. O. , Akana T. S.
Department of Geology, Niger Delta University, Nigeria
Correspondence to: Oki A. O. , Department of Geology, Niger Delta University, Nigeria.
| Email: |  |
Copyright © 2016 Scientific & Academic Publishing. All Rights Reserved.
This work is licensed under the Creative Commons Attribution International License (CC BY).
http://creativecommons.org/licenses/by/4.0/

Abstract
This study x-rayed the geochemical characteristics of groundwater quality of the growing City of Yenagoa, the Bayelsa State capital. Water samples were collected from fifteen (15) boreholes. Analysis were carried out on physico-chemical parameters (pH, salinity, electrical conductivity, turbidity, total dissolved solids, alkalinity, hardness, nitrate, chloride, sulphate, bicarbonate, calcium, magnesium, sodium, potassium and iron). Results showed that most results fell within acceptable World Health Organisation (WHO) limits for potable water. pH in all BH samples were slightly acidic. In addition magnesium was above the limit in all BH samples after comparison with WHO (2006) standard. Data was subjected to Piper’s trilinear plot, result from the plot showed the Calcium and Chloride type water was present in the area. This means that the water from the area is good for domestic and industrial use. Although, treatment is required in some areas where the results did not conform to standard before use to prevent health risks.
Keywords:
Geochemistry, Aquifer quality, Piper plot, Yenagoa
Cite this paper: Oki A. O. , Akana T. S. , Quality Assessment of Groundwater in Yenagoa, Niger Delta, Nigeria, Geosciences, Vol. 6 No. 1, 2016, pp. 1-12. doi: 10.5923/j.geo.20160601.01.
1. Introduction
The challenge of ensuring usable water in sufficient quantities to meet the needs of human and ecosystems emerged as one of the primary issues of the 21st century. Poor water quality could cause serious health problems, reduce agricultural productivity and economic prosperity of communities. Problems of this nature have been increasing in scope, frequency, and severity because the demand for water continues to grow while supply of renewable water remains relatively fixed. While it is agreed that water is one of the most important resources with great implications for African development, the freshwater situation in Africa is unfortunately not encouraging. The situation is getting worse as a consequence of population growth, rapid urbanization, increasing agriculture and industrial activities, and lack of adequate capacity to manage freshwater resources. Bayelsa state is a wetland in Niger Delta with possible serious problems of availability of portable water. All the surface water bodies in the state are pollution-laden and hence there is the need to resort to groundwater for consumable water. Groundwater includes all water found beneath the surface of the Earth. It is derived primarily by percolation of atmospheric or surface water and contained in pore spaces of permeable reservoir rocks (Ayoade, 2003), this makes it a replenishable resource unlike other resources of the Earth. In any geological environment, groundwater chemistry is controlled by the chemistry of the infiltrating water, the chemistry of the porous media including the interstitial cement or matrix of the aquifer, the rate of groundwater flow and the permeability of the aquifer (Offodile, 2002). More than 85% of public water for consumption is sourced from groundwater (Ufoegbune et al, 2009), and this is used for domestic, industrial and agricultural purposes.
2. Study Area Description
This study investigates the quality of groundwater in selected densely populated areas of Yenagoa, the capital of Bayelsa state. Yenagoa lies within latitude 04°4N and 05°02N and longitude 006°15E and 006°24E (fig 1) and is situated in southern part of the Niger Delta of Nigeria. Water is contained in very thick and extensive sand and gravel aquifer within the Benin Formation in Yenagoa. The Benin Formation is the aquiferous layer and all boreholes in the area are drilled into it (Etu-Efeotor and Akpokodje, 1990; Offodile, 2002). Minor intercalations of shale layers give rise to multi-aquifer system, out of which two types have been identified (Etu-Efeotor, 1981). The first (Holocene age) is more prolific and extends to about 60-90m (unconfined) while the second (Oligocene) is less prolific and underlies the first. Multi-aquifer systems have also been identified from lithologic logs of boreholes from other parts of the Niger Delta by Edet (1993); Udom (2006).
3. Methodology
Sterilized water bottles were used to collect representative water samples from boreholes to prevent contamination in this format: BH 1 (Igbogene), BH 2 (Yenegwe), BH 3 (Akemfa), BH 4 (Agudama), BH 5 (Etegwe), BH 6 (Okutukutu), BH 7 (Opolo), BH 8 (Biogbolo), BH 9 (Kpansia), BH 10 (Okaka), BH 11 (Amarata), BH 12 (Swali), BH 13 (Ogbogoro), BH 14 (Ogu) and BH15 (Akaba). Water samples from boreholes were subjected to physico-chemical analysis and results were compared to the World Health Organization Standard for portable water to determine its suitability for domestic and industrial uses. Field analysis was done for pH, conductivity, turbidity and salinity, after which samples were taken to the laboratory within 12 hrs for further physico-chemical analysis. Fifteen samples were collected in the most densely populated towns in Yenegoa local government area at a sample spacing of at least 3 kilometers.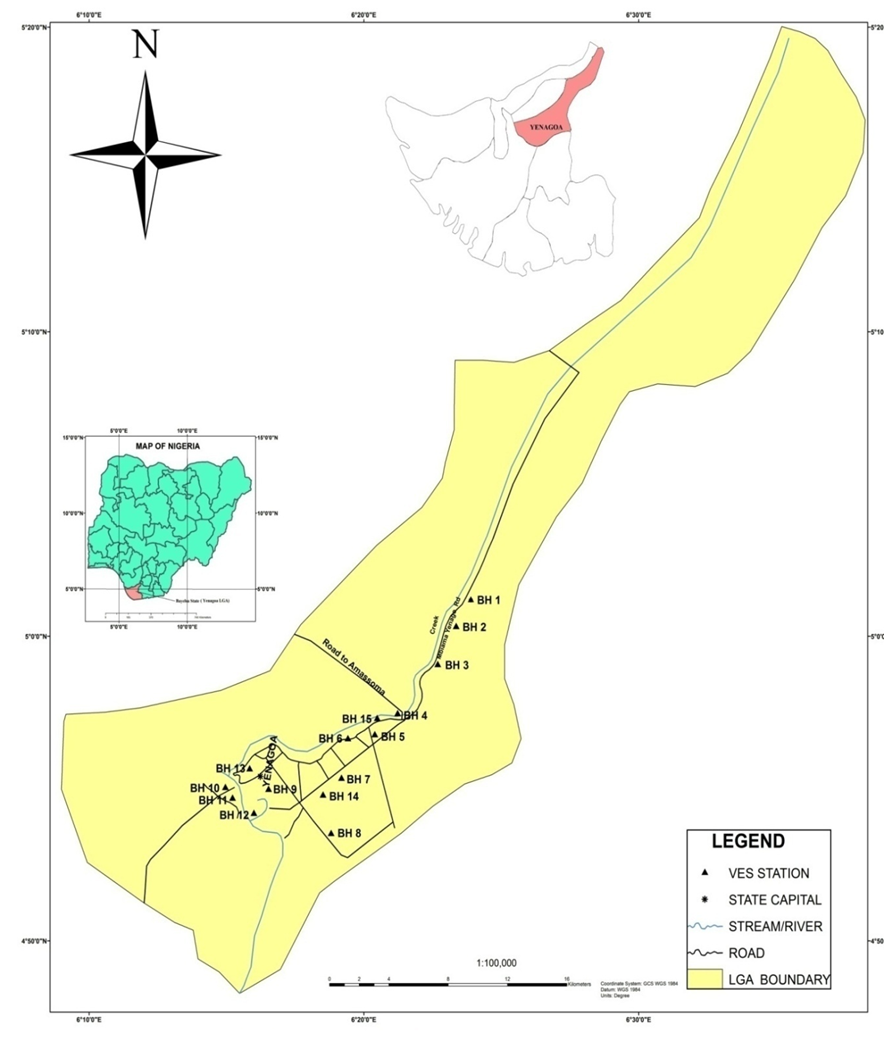 | Figure 1. Showing the sampling points on the map of Yenagoa |
4. Result and Discussions
The results of the physico-chemical parameters (table 1) are graphically represented in bar charts from one borehole to another across the study area: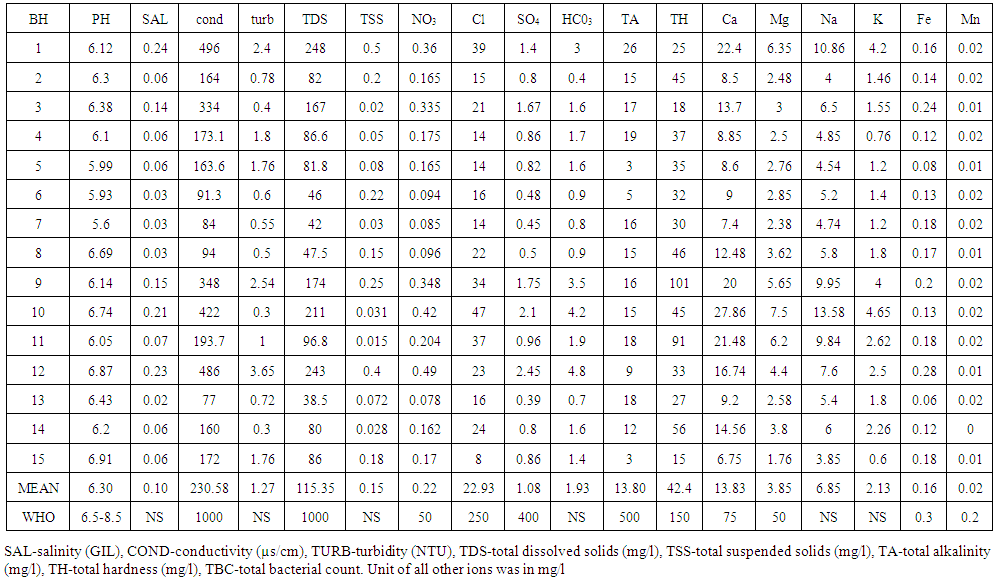 | Table 1. Result from analysis on samples in comparison to World Health Organisation (WHO) standard for portable water |
PH ValuePH value ranged from 5.6 – 6.91(fig 2) with an average value of 6.30. These values indicated that ground water in the area in slightly acidic, this could be attributed to the abundance of organic matters in the overlying soil and the presence of shale intercalations in the aquiferous coastal plain sands and also due to acid rain caused by prevalent gas flaring in the Niger Delta. However all the samples met the WHO standard for drinking water which is between 6.5 and 8.5.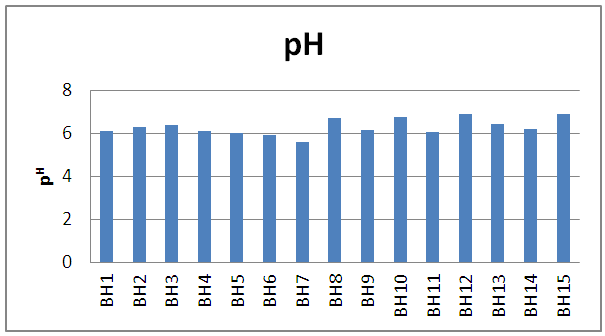 | Figure 2. Bar chart showing variation  across boreholes across boreholes |
SalinityThe Minimum value was 0.02gil and maximum value was 0.24gil (fig 3) with a mean value of 0.10gil. There is no stipulated limit for WHO standard for drinking water.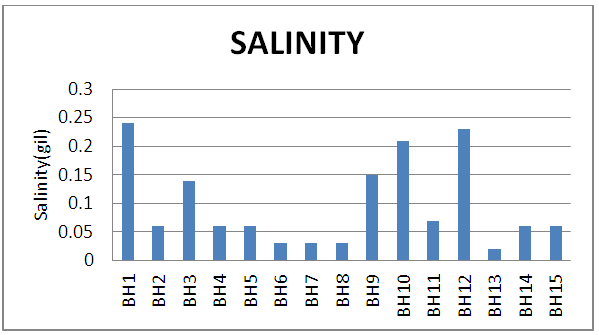 | Figure 3. Bar chart showing variation of salinity across boreholes |
ConductivityConductivity value ranged from 77µs/cm to 496 µs/cm (fig 4), with an average value of 230.6 µs/cm these values were below 1000µs/cm which was the WHO standard for portable water.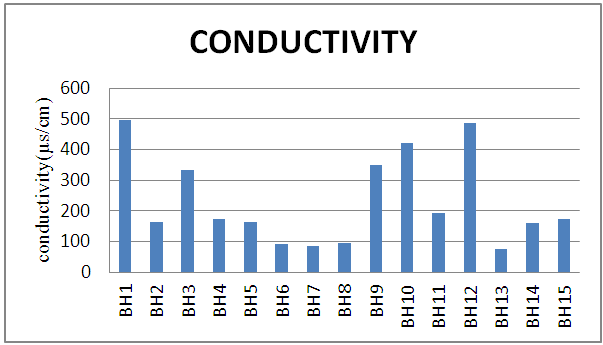 | Figure 4. Bar chart showing variation of conductivity across boreholes |
TurbidityThe turbidity value ranged from 0.3 NTU to 3.65NTU (fig 5) with an average as 1.27 NTU. There is no guideline for WHO standard for drinking water (2006), causes of high turbidity in water may include the presence of disease causing organism.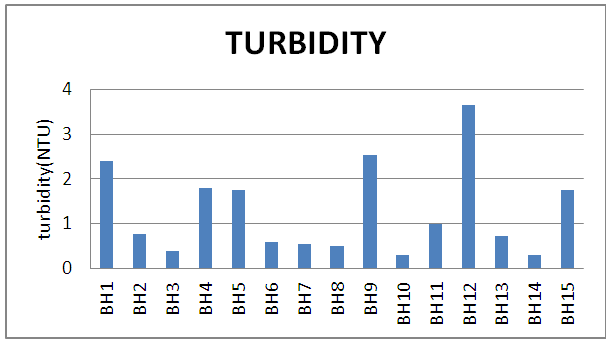 | Figure 5. Bar chart showing variation of turbidity across boreholes |
Total Dissolved Solids (TDS)The minimum value of total dissolved solids was 38.5mg/l and maximum value was 248mg/l (fig 6) with the mean value is 115.3mg/l. This values were far below the stipulated value of 1000mg/l by WHO (2006) for drinking water, as such, the water in Yenegoa is good for consumption and irrigation purposes.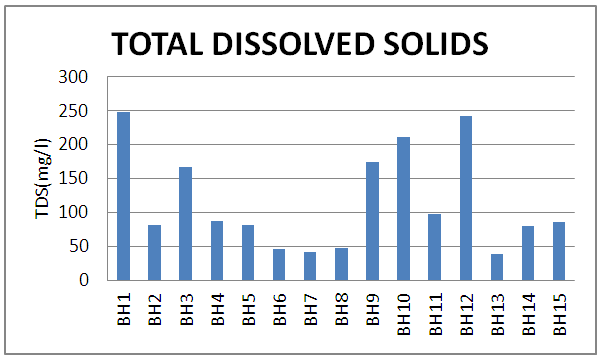 | Figure 6. Bar chart showing variation of total dissolved solids across boreholes |
Total Suspended Solids (TSS)The value of total suspended solids ranged from 0.015mg/l to 0.5mg/l (fig 7) with a mean value of 0.15mg/l. No limit is stated by WHO for this parameter.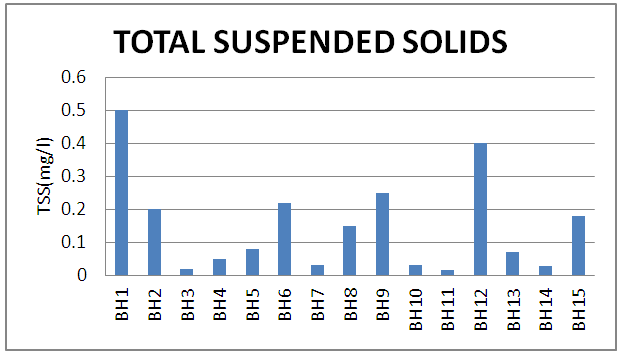 | Figure 7. Bar chart showing variation of total suspended solids across boreholes |
Nitrate (NO3)The minimum value of nitrate is 0. 078mg/l and maximum value was 0.49mg/l (fig 8). This was far below the stipulated value of 50mg/l by WHO (2006) standard for drinking water, hence, the water is recommended for irrigation purposes.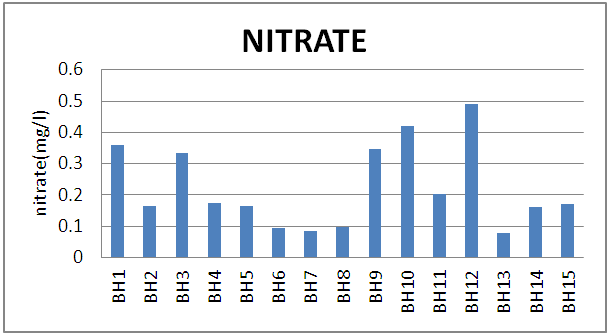 | Figure 8. Bar chart showing variation of nitrate across boreholes |
Chloride Ion (CL) ContentChloride in samples ranged from 8mg/l to 47mg/l (fig 9) with mean value of 22.9mg/l. All samples except BH 10 showed values less than 40mg/l stipulated by Trembley et al (1973) which indicate salt-water intrusion. WHO (2006) stipulated 250mg/l as the limit of chloride in drinking water. Primarily, the reason of the limit of chloride for most irrigation processes is placed at 200mg/l.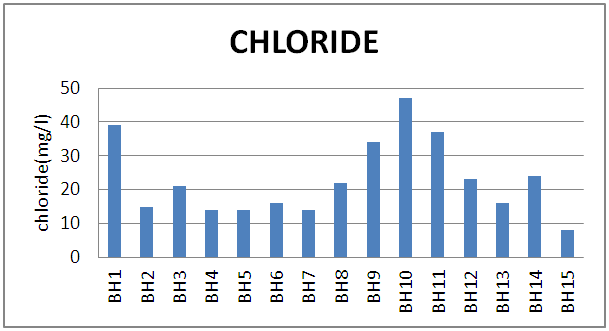 | Figure 9. Bar chart showing variation of chloride across boreholes |
Sulphate (SO4) ContentThe minimum value of sulphate was 0.39mg/l and the maximum value was 2.45mg/l (fig 10) with a mean value of 1.09mg/l. Sulphate concentration was low in the water compared to WHO stimulated limit of 400mg/l, showing that the water is safe for domestic and industrial purposes.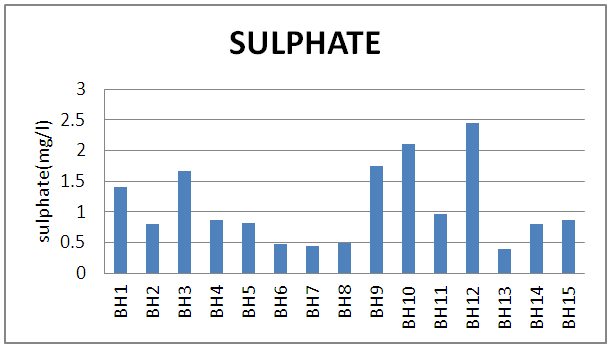 | Figure 10. Bar chart showing variation of sulphate across boreholes |
Bicarbonate (HCO3) ContentBicarbonate value ranged from 0.4mg/l to 4.8mg/l (fig 11) and with an average of 1.93gm/l. The source is primarily carbon dioxide in the atmosphere partly from gas and activity of biota in the soil. WHO (2006) presented no limit for this parameter in water and in processing wood chemicals. Upon heating, bicarbonate is changed into steam, carbonate and carbon (iv) oxide. High bicarbonate and alkalinity concentration are undesirable in many industries.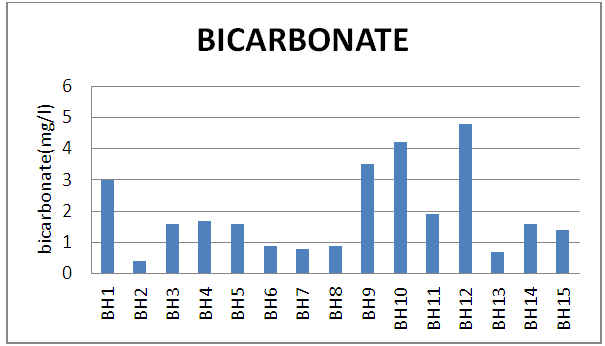 | Figure 11. Bar chart showing variation of bicarbonate across boreholes |
Total Alkalinity (TA)The total alkalinity value ranged from 3mg/l to 26mg/l (fig 12). Values were below 500mg/l which is the WHO (2006) stipulated limit for drinking water.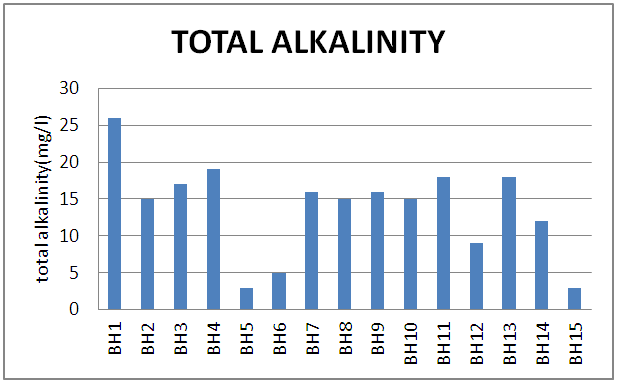 | Figure 12. Bar chart showing variation of total alkalinity across boreholes |
Total Hardness (TH)The value of total hardness range from 15mg/l to 101mg/l (fig 13) with a mean value 42.40gm/l. Values were below the stipulated 150mg/l limit by WHO, as such, water sample is safe for drinking.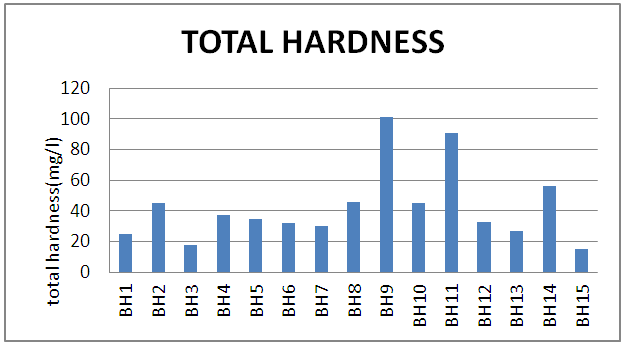 | Figure 13. Bar chart showing variation of total hardness across boreholes |
Calcium Content (Ca)The value of calcium ranged from 6.75mg/l to 27.86mg/l (fig 14) with a mean value of 13.8mg/l. Values were below the WHO (2006) limit of 75mg/l for safe drinking water.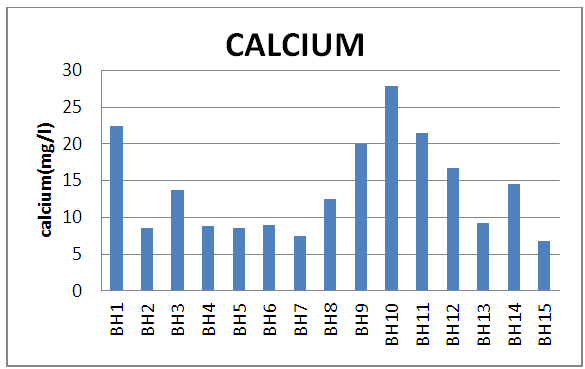 | Figure 14. Bar chart showing variation of calcium across boreholes |
Magnesium (Mg) The Magnesium value ranged from 1.76mg/l to 7.5mg/l (fig 15) with an average value of 3.85mg/l, all samples were above the stipulated value of 50 mg/l by WHO for water drinking.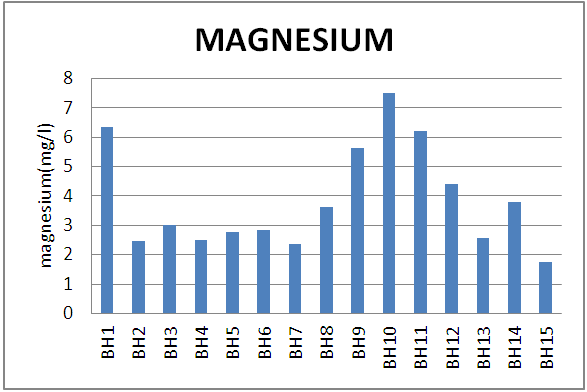 | Figure 15. Bar chart showing variation of magnesium across boreholes |
Sodium (Na)The value of Sodium ranged from 3.85mg/l to 13.58mg/l (fig 16) with an average value of 6.85mg/l. There is also no limit by WHO for this parameter. But excess sodium in water may be harmful. 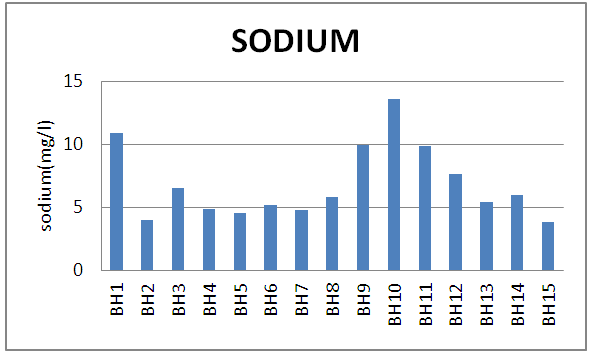 | Figure 16. Bar chart showing variation of sodium across boreholes |
Potassium (K)The range of value for Potassium in the water sample analysis is 0.6mg/l to 4.65mg/l (fig 17). There is no guideline for potassium in drinking water by WHO.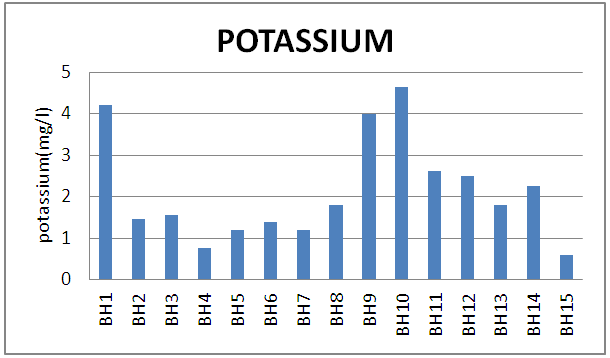 | Figure 17. Bar chart showing variation of potassium across boreholes |
Iron Content (Fe)The content of iron in the water samples ranged from 0.06mg/l to 0.28mg/l (fig 18) with an average value 0.02mg/l. These values are below the standard value for iron in drinking water by WHO (2006), as such, the water is suitable for drinking and most industrial purposes with an exception of consumption by boilers, they feed water which requires than less then 0.01mg/l.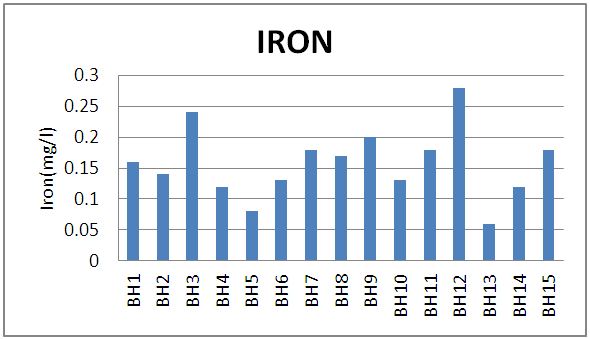 | Figure 18. Bar chart showing variation of iron across boreholes |
Manganese (Mn)Values ranged from 0.0mg/l to 0.02mg/l (fig 19). These values are far below the stated value of 0.20mg/l for manganese (WHO, 2006) standard for drinking water, as such, water is safe for drinking.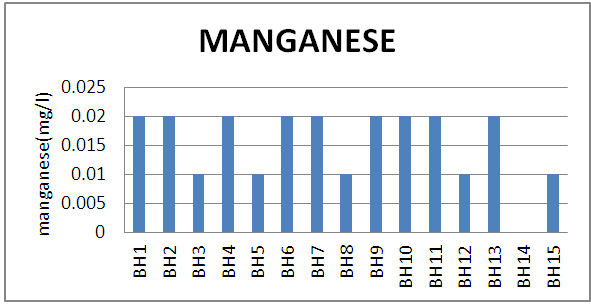 | Figure 19. Bar chart showing variation of manganese across boreholes |
A pie chart (fig 20) showed that the maximum cation found in the water samples was calcium (52%) and potassium is the lowest (8%) in the study area. Also, considering the concentration of anions, chloride was highest (88%), and the lowest was sulphate (4%). The concentrations of these major cations and anions falls within the allowable limits slated by WHO for portable water. | Figure 20. A pie chart showing the mean concentration of major cations and anions in the area |
5. Piper Trilinear Diagram
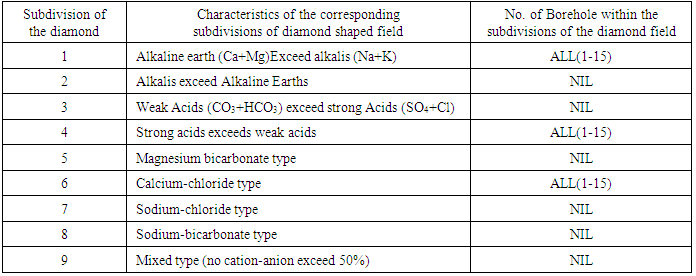
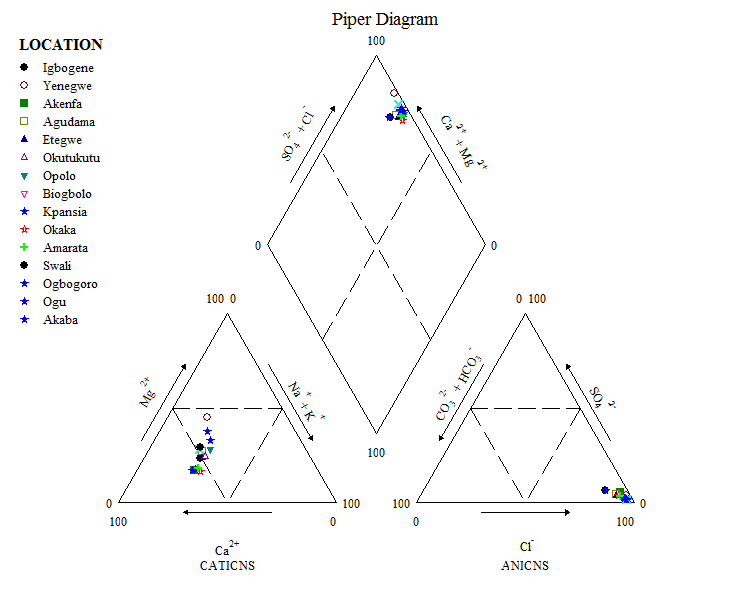
Trilinear plotting systems developed by Piper (1944) were used in the study of the water chemistry and quality. Piper diagrams are a combination of cation and anion triangles that lie on a common baseline. A diamond shape between them is used to replot the analysis as circles whose areas are proportional to their Total Dissolved Solids (TDS). The position of an analysis that is plotted on a Piper diagram can be used to make a tentative conclusion as to the origin of the water represented by the analysis. The diamond part of a piper diagram (fig 21) may be used to characterize different water types. Generally, groundwater can be divided into four basic types according to their placement near the four corners of the diamond. Water that plots at the top of the diamond is high in both Ca2+ + Mg2+ and Cl- + SO42-, which results in an area of permanent hardness. Water that plots near the left corner is rich in Ca2+ + Mg2+ and HCO3- and is the region of water of temporary hardness. Water plotted at the lower corner of the diamond is primarily composed of alkali carbonates (Na++ K+ and HCO3+CO32-). Water lying near the right-hand side of the diamond may be considered saline (Na++ K+ and Cl- + SO42+). The water types in the study area were thus designated according to the area in which they occur on the diagram segments as explained in the table (fig 22 and table 2). 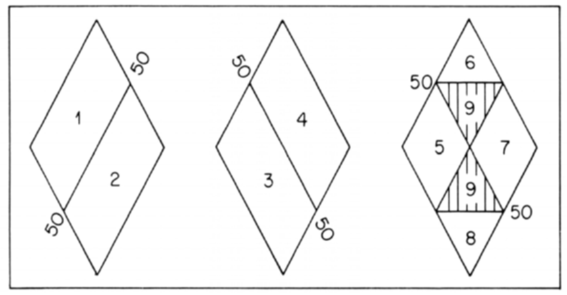 | Figure 21. Subdivisions of the diamond-shaped field of the Piper diagram |
Table 2. Characteristics of borehole water in Yenagoa on the basis of Piper trilinear diagram
 |
| |
|
 | Figure 22 |
6. Conclusions
Variations observed in the chemistry of water samples drawn from various boreholes may be attributed to various processes both natural and artificial, e.g., the chemistry of the aquifer material, the rate of groundwater flow, permeability of the aquifer, land use for irrigation and waste disposal e.t.c. Analysis showed that all parameters from all the borehole samples were within the WHO limits for potable water except pH and magnesium. pH in all BH samples showed water was slightly acidic, also magnesium was above the stipulated limit in all BH samples when compared with WHO (2006). The water type by Piper’s trilinear plot was characterized by calcium-chloride type hydro-chemical facie. Water hardness is caused primarily by the presence of cations such as calcium and magnesium and anions such as carbonate, bicarbonate and chlorides, this implied water in the area is relatively hard.Water analysis data should be collected continuously in the study area, the data would aid the building of hydro-geochemical models, which would in turn be used to make informed predictions about changes in groundwater quality. In areas where the chemistry of water does not fall within the permissible limit for potable water set by the World Health Organization (WHO) treatment was recommended.
References
| [1] | Ayoade, J. O. Tropical Hydrology and Water Resources. Macmillan Ltd. 2003; p. 276. |
| [2] | Edet, A.E. Groundwater Quality Assessment in parts of Eastern Niger Delta. Nigeria. Environ. Geol. 1993; 22(1): 41-46. |
| [3] | Etu-Efeotor, J.O. Preliminary Hydrogeochemical investigations of Sub-Surface waters in parts of the Niger Delta Nig. J. Min. Geol. 1981;18(1): 103-105. |
| [4] | Etu-Efeotor, J. O and Akpokogje. E. G. Aquifer systems of the Niger Delta. Journal of Mining and Geology.1990; 26 (2): 279 – 285. |
| [5] | Offodile, M. E. Groundwater study and development in Nigeria. Mecon Engineering Services Ltd, Jos, Nigeria. 2002; Pp 239 – 345. |
| [6] | Piper, A. M. A graphical procedure in the geochemical interpretation of water analysis. American Geophysical Union Transactions. 1944; 25: 914 – 923. |
| [7] | Tremblay, J. J., D Cruz, A and Auger, H. Salt water Intrusion in the Summerside Area, P. E. I. Groundwater. 1973;11: 42 – 49. |
| [8] | Udom, G.J. Quality status of groundwater in Yenagoa and its environs, Bayelsa State, Nigeria. J. Sci. Ind. Stud. 2006;4(1): 45-51. |
| [9] | Ufoegbune, G. C., Lamidi, K. I., Awomeso, J. A, Eruola, A. O., Eruola, A. O., Idowu, O. A and Adeofun, C. O. Hydro-geological characteristics and groundwater quality assessment in some selected communities of Abeokuta, Southwest Nigeria. Journal of Environmental Chemistry and Ecotoxicology. 2009; 1:010-022. |
| [10] | World Health Organization. Guidelines for Drinking Water Quality: Incorporating 1st and 2nd Addlenda. Vol.1 Recommendations 3rd Edition Geneva. 2006. |

 Abstract
 Reference
 Full-Text PDF
 Full-text HTML