-
Paper Information
- Previous Paper
- Paper Submission
-
Journal Information
- About This Journal
- Editorial Board
- Current Issue
- Archive
- Author Guidelines
- Contact Us
Geosciences
p-ISSN: 2163-1697 e-ISSN: 2163-1719
2015; 5(3): 100-112
doi:10.5923/j.geo.20150503.03
Seismic Discrimination of Subsurface Stratigraphy Using Wavelet Transform
 Abstract
 Reference
 Full-Text PDF
 Full-text HTML
Williams Ofuyah1, Saleh Saleh2, Edafe Ominigbo1
1Department of Earth Sciences, Federal University of Petroleum Resources, Effurun, Nigeria
2Department of Petroleum Engineering and Geoscience, Petroleum Training Institue, Effurun, Nigeria
Correspondence to: Williams Ofuyah, Department of Earth Sciences, Federal University of Petroleum Resources, Effurun, Nigeria.
| Email: |  |
Copyright © 2015 Scientific & Academic Publishing. All Rights Reserved.
Computation of pseudo-log attribute section similar to sedimentary section from seismic data facilitates prediction of reservoir seals, distribution of over-pressured intervals and zones, and avenues for hydrocarbon migration. Classic stratigraphic analysis involves interpretation of sedimentation models, measured well-log sections and cross sections, multivariant analysis, etc. These methods perform poorly under limitation in number of models, complex phenomena of noise, attenuation, gentle and gradual rather than rapid variations in lithology, other aberrations in seismic data and imprecise calibration and windowing problems in certain spectral techniques. In this paper, a new method and algorithm developed for computing spectral pseudo-maps using the Discrete Wavelet Transform in the interpretation of 3-D seismic data obtained from Niger Delta is discussed. The algorithm adopts the Discrete Wavelet Transform, Fast Fourier Transform convolution techniques and amplitude-velocity relations, and it is implementable on standard and general seismic interpretational platforms. It directly computes spectral pseudo-sections and maps of amplitude-derived interval velocity, and those of its derivatives like acoustic impedance, resistivity, porosity and density along an arbitrary seismic line connecting all six wells in survey for thin bed (16ms, 65 ft) analysis, and it is extendable to 3D.. The spectral pseudo- sections and maps obtained highlight regions of constant attributes, directly revealing distinct sequence boundaries, depositional patterns and lithofacies compartments. Both the possibilities, like identification of detailed stratigraphy in wavelet domain, in any zone of interest in the pseudo-sections by zooming-in, and sources of errors which are within tolerance limits are discussed and plotted. The main results here are the possibility of such computation for a thin bed reservoir, and the recognition of hydrocarbon fairways with high probability of successful exploration and development.
Keywords: Fourier Transform, Discrete Wavelet Transform, Convolution
Cite this paper: Williams Ofuyah, Saleh Saleh, Edafe Ominigbo, Seismic Discrimination of Subsurface Stratigraphy Using Wavelet Transform, Geosciences, Vol. 5 No. 3, 2015, pp. 100-112. doi: 10.5923/j.geo.20150503.03.
Article Outline
1. Introduction
- Spectral-pseudo section describes a new method and algorithm for seismic stratigraphic interpretation using wavelet transform. This algorithm allows detailed study of the seismic data to unravel the complex relationships of sedimentology and hydrocarbon distribution in the wavelet domain using amplitude–velocity relations and Discrete Wavelet Transform. Wavelet transformation naturally leads to several interpretation applications and at various scales. The term ‘wavelet’ in this context refers to a signal prototype and not the probing seismic wavelet.Transformation of seismic data to pseudo-log attribute section similar to sedimentary section facilitates prediction of reservoir, seals, distribution of over-pressured intervals and zones and avenues for hydrocarbon migration.Our aim is to improve stratigraphic and reservoir delineation and description when complex and subtle geologic features like thin-bed reservoirs, facies change, channels, micro-faults, reflection-free events, etc are involved. This is particularly necessary to improve the success ratio of field appraisal and identify potential exploration projects now that exploratory activities are shifting to the deep waters (offshore geologic basins of water depth > about 1300m). Here seafloor topography is rough, geology is complex and huge hydrocarbon accumulations in stratigraphic reservoir targets are being prospected. .The key inputs are the concepts and practices of seismic stratigraphy and the wavelet transforms.Seismic stratigraphy is the accurate geologic interpretation of seismic data. It spawns sequence stratigraphic, which is potentially applicable to seismic, log, and outcrop data, and the associated methods for defining basin evolution, reconstructing depositional histories and making qualitative predictions of lithology [1].The geometry (or character) of reflections, their amplitudes and velocities can be used to determine the stratigraphic setting, depositional history, lithology and hydrocarbon presence in an area. [2-5].The wavelet transform is an analysis filter and has a multi-scale nature and structure that localize changes much better than the heavily used Short-Time Fourier transform, with fixed resolution. Seismic resolution concerns itself with practical questions like how thick (or thin) a reservoir bed needs to be and still be visible seismically, and how wide (or narrow) does a unit have to be in order to be identified seismically. A thin bed, based on reflective properties is one whose thickness is less than about one-eight of the (predominant) wavelength computed using the velocity of the bed [6]. Wavelength generally increases with depth and since velocity increases, frequencies reduce. Spectral decomposition is required because the only variable affecting resolution that can be controlled is frequency, both in vertical (time-depth) and horizontal (trace-trace) directions.In this paper, we present the results of a new method and algorithm developed for computing spectral pseudo-section using the Discrete Wavelet transform in the interpretation of 3D seismic data obtained from Niger Delta. Classic stratigraphic analysis involves interpretation of sedimentation models [7], [8] measured well log sections and cross-sections, multi-variant analysis [9], etc. These methods perform poorly under limitation in number of models, complex phenomena of noise, alternation, gentle and gradual rather than rapid variations in lithology, other aberrations in seismic data and impressive calibration and windowing problems in certain spectral techniques like discrete and short-time transforms.The literature on the use of discrete wavelet transform in seismic work is limited. [10] showed how the wavelet transform can be used for velocity analysis. [11] examined the use of the continuous wavelet transforms for classification of scatterers in high resolution marine seismic data, and for attenuation estimation. However, he commented that’ examination of alternative wavelets that may be move diagnostic for classification of scattering should be pursued’. Some previous studies on the use of seismic amplitude for inferring stratigraphy and stratigraphic studies are [12] (Amplitude: its information content in: Lithology and Direct detection of hydrocarbons using geophysical methods; [13] (How Hydrocarbon reserves are estimated from seismic data in Lithology and Direct Detection of hydrocarbons using geophysical methods), [14] (Inferring Stratigraphy from seismic data), [4] (Inversion of seismograms and pseudo-velocity logs), [3] ( Synthetic sonic logs – A process for stratigraphic interpretation), [7], [8] (Sedimentation models), [1] (Seismic stratigraphy and small 2D seismic surveys). However, apart from the works of [10], [11], the methods above are reliable only when geological conditions are ideal, or favorable. The inputs to the method are seismic amplitude data, well data, where available, and a clear knowledge of signal analysis and thin-bed tuning phenomena. In the absence of well data, synthetics or Neural Network estimation can be used to produce pseudo-well log.Starting from the data volume provided (3D) in the Kingdom Suite software and its structural interpretation, an arbitrary line (2D) was created to tie entire wells in the survey. This is to approximate the axis of the geologic truth and its data extracted. We then utilized general but standard data analysis programs such as Matlab. etc to implement our computational algorithm, developed from basics. The algorithm adopts the Discrete Wavelet transform and Fast Fourier Transform convolution techniques It is implementable on standard/Oil industry (Kingdom suite Geographix), etc and general (Matlab, Pascal, Gnuplot, Sufer-8, etc) seismic/data interpretational platforms. It directly computes spectral pseudo-section of interval velocity and those of its derivatives like acoustic impedance resistivity, porosity and density from wavelet transformed amplitude-derived interval velocity data along the arbitrary seismic line for thin bed (16ms, 65ft) analysis, and it is extendable to 3D data. The spectral pseudo-sections and maps obtained highlight regions of constant attributes, directly revealing distinct sequence boundaries, depositional patterns and lithofacies compartments. Both the possibilities, like identification of detailed stratigraphy in wavelet domain, in any zone of interest in the pseudo-sections by zooming-in, and sources of errors which are within tolerance limits (i.e. mean interval velocity error of 195 ft/s was obtained. This resolution for thin layers, from previous works, is not possible with Dix formula) are discussed and plotted. The main results here are the possibility of such computations for a thin-bed reservoir and the recognition of hydrocarbon fairways with high probability for successful exploration and development.Geological BackgroundThe Niger Delta is a large arcuate delta of the destructive, wave dominated type and is divided into the continental, transitional and marine environments. A sequence of under-compacted marine clay (Akata formation, depth from 11121ft) overlain by paralic or sand/shale deposits (Agbada formation, depth: 7180-11121ft) is present throughout. Growth faults strongly influenced the sedimentation pattern and thickness distribution of sands and shales. The paralic interval is overlain by a varying thickness of continental sands (Benin formation, depth: 0-6000ft). Hydrocarbon is trapped in many different trap configurations, [15].BasicsThe quality of resolution and detail of inverted seismic traces obtainable depend upon the presence of high frequencies, and a broad seismic signal bandwidth [2]. The conventional seismic data do not resolve subtle geology features because it is band-limited. To improve resolution, shaping parameters of the seismic source such as wavelet type and frequency bandwidth that define detection and imaging capabilities must be considered [16]. While a typical geologic features wavelength’s bandwidth is 0 – 1000Hz or higher, the common seismic bandwidth is 15-65Hz in the vertical direction. Resolution in the vertical direction is about 15.3m (50.8ft) and in horizontal, direction, it is about 304m (1000ft) at depth of about 1524m (5000ft). Although field procedures and data processing can recover moderately high frequency components, low frequency information below 10Hz associated with stratigraphy and high frequencies greater than 100 Hz in well data which we seek to mimic are absent from the seismic trace. In fact some formations such as such as gas sands and oil reservoirs anomalies directly underneath them are associated with low frequencies [14].
 | Figure 1. ‘X’-Field, Niger Delta.: (a) Base map of survey area showing the Arbitrary line (red). The line connects the entire wells (six) in the survey. (b) Principal types of Oil field structures in the Niger Delta |
 | (1) |
|

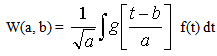 | (2) |
2. Methodology
- Geologic discontinuities such as faults and fractures in 3-D seismic data manifest themselves as abrupt, gradual, and subtle changes of amplitudes. The techniques for identifying abrupt and gradual changes have been provided by several authors. In order to detect the subtle and other changes, the following routines: Structural interpretation (time) (for data reconnaissance and comprehension), enhanced geologic transformations (also in time) and a variety of spectral techniques such as DFT, HT, Sort time Fourier transform (STFT), Generalized Hilbert transform(GHT) and DWT were adopted.The seismic data used in this study are digital and real. The recorded data sets (3D) were obtained over ‘X’ field by Chevron Corporation Nigeria. The field data comprises a base map, a suite of logs from six (6) wells, and four hundred (400) seismic lines and 220 crosslines. Some of the log types provided are Gamma-ray, self-potential, resistivity density, sonic, water saturation.The 2D data was extracted from Kingdom Suite Package, along an arbitrary line created to tie the entire six (6) wells in the survey, in addition to 3D sub-volume (i.e. for main reservoir window with top: 2.752s, base: 2.768s) and entire data cube. The segmentation was done to enhance the hard data information and for detailed investigation. In the spectral domain, fast Fourier convolution techniques (FFT) were employed. The interpretation techniques adopted and their order of application is:(a) Structural interpretation of 2D, and 3D data (b) Application of time (enhanced (owing to calibration) geologic) and time-frequency (spectral decomposition) transforms.The conventional techniques of structural, DFT, HT, Geometric transform (GT) and Statistical (ST) were initially applied to the data, and their strengths and weaknesses noted for improvement. Next, new approaches which eventually led to the developed algorithms were examined. The algorithms were developed from first principles and by extension of the conventional techniques. Their superiority is evident from the results obtained.In structural interpretation, the arbitrary line zone was mapped and interpreted with the Kingdom Suite software from the outset. The entire 3D was interpreted afterwards. Wells 01, 04 and 05 were adopted as representative wells for interpretation in view of their good data quality. In time domain, the thin sand was structurally interpreted as a unit and designated C. Time and amplitude maps of the top and base of sand C1 (structure map) of the zone of the arbitrary line were obtained. The application of enhanced geologic transformation delineated the sand into compartments C1 and C2. Representative pseudo-section of velocity is shown. The pseudo-well log attribute sections were computed as follows: The interval velocity was computed from the seismic amplitude data by amplitude scaling following the treatment by [24]. i.e. Computation of Interval velocity from seismic amplitude data. The formula adopted for the computation of Pseudo resistivity log series is that due to Cline [25]. The pseudo-density values were estimated in three different ways i.e. sonic-derived [2], velocity-derived [25] and Acoustic impedance-derived. [3]. Porosity values were computed (with the equation for its computation as expressed in [26] using matrix transit time of 55.5micro seconds/ft for uncompacted sands as in tertiary Niger Delta. On comparison, the acoustic impedance-derived density was found to be the closest to the well log (true) density values and was therefore adopted for use.The pseudo-sections in depth were computed for the arbitrary seismic line .Using log data from wells 04 and 05, velocity values from the well’s T.D curves, seismic traces bounding the wells were used in the transformation. The direct computation of interval velocity and its derivatives like sonic, acoustic impedance, density, resistivity, porosity from amplitude data along an arbitrary line, (approximating the geologic truth), suggests their possibility for thin-bed reservoir (16 ms, 65 ft thick). The reliability of the result is reinforced by its good correlation with sonic and other log data, and an acceptable mean interval velocity error of 195 ft/s. This resolution for thin layers, from previous works, is not possible with Dix .The computation of DWT using FFT was adopted for use in this study for the purpose of computational savings.An interpretational work flow algorithm external to oil industry software was developed and implemented on the 2D arbitrary line. The outputs were displayed on both general and Oil industry (kingdom Suite, version 6.7, SMT) software and compared. The circled spots on original amplitude and other maps are sample reference locations for interpretation.
3. Results and Analysis
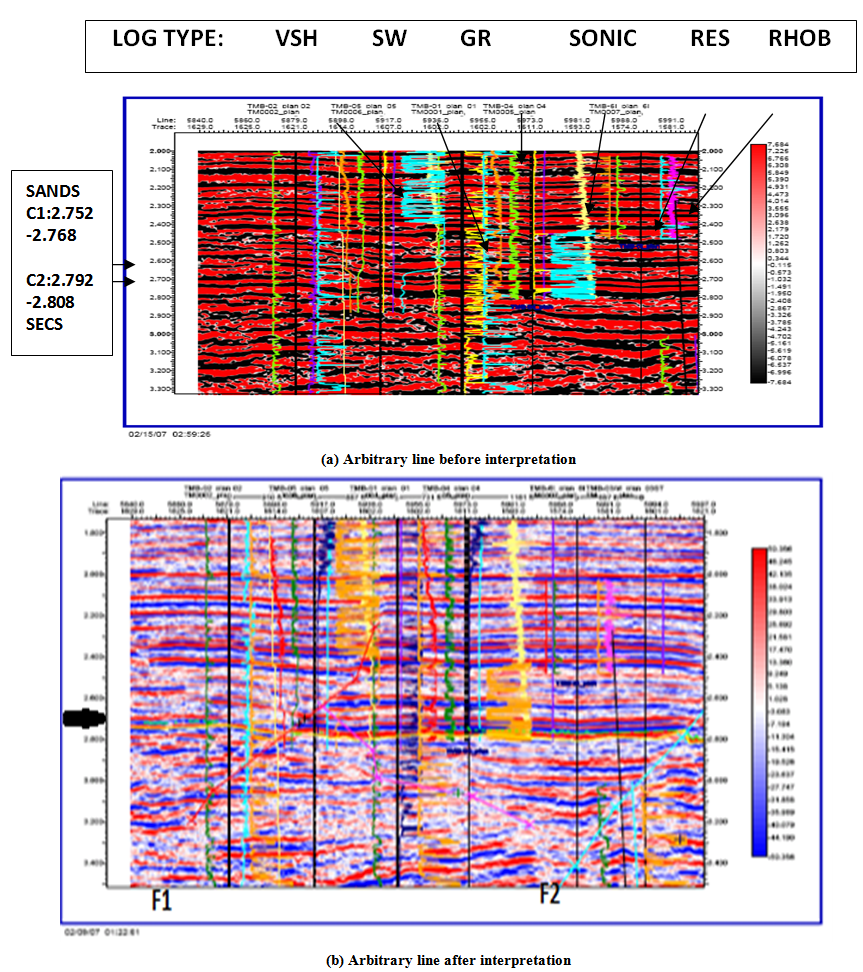 | Figure 2. ‘X’-Field, Niger Delta. . Arbitrary line after interpretation: Two major faults, F1, F2 are shown bounding the wells at the reservoir interval under analysis arrowed. The well locations are indicated above the seismic section |
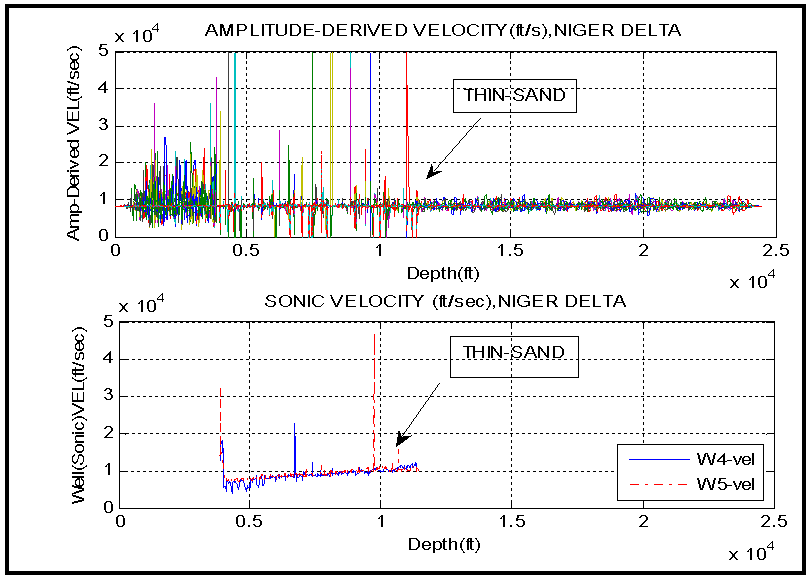 | Figure 3. ‘X’-Field, Niger Delta, Arbitrary line: Comparison of Velocities Computed from Sonic log, and Seismic Amplitude Data along an arbitrary seismic Line (2D) constructed to link entire six wells in 3D survey. Figure at top was computed for all amplitude traces along the arbitrary line including traces at the six well locations. The Figure at bottom was computed from sonic logs in wells 4 and 5(representative wells in view of their good data quality) for comparison with general trend. This is evident from the depth axis or range |
 | Figure 4. ‘X’-Field, Niger Delta, Arbitrary line: Close-up view of Amplitude-Derived Interval Velocity Pseudo-Section. The reservoir under consideration, C1:2.752-2.768 s (11127.5-11200.3ft) is clearer here than on seismic section. Formation contacts and individual stratigraphic units are evident |
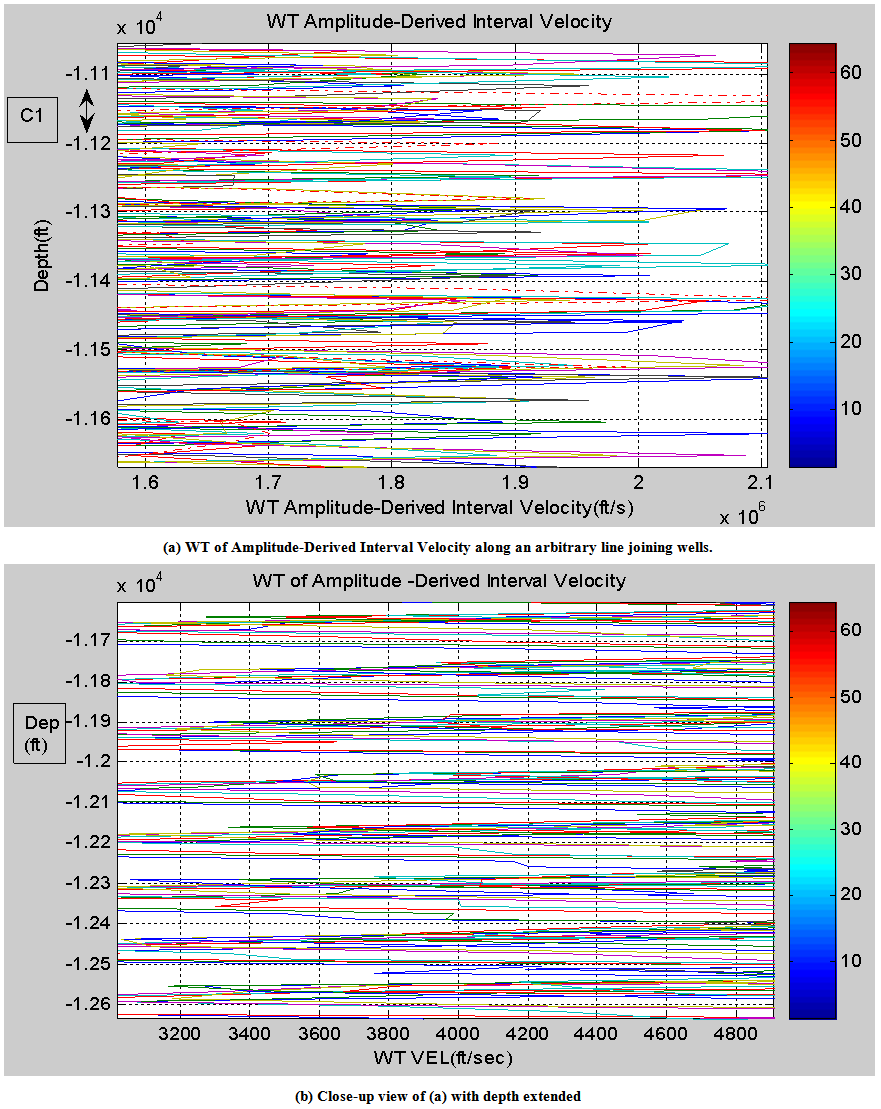 | Figure 5. ‘X’-Field, Niger Delta: Arbitrary line (a) WT of Amplitude-Derived Interval Velocity along an arbitrary line joining wells.(b) Close-up view of (a). The stratigrahic features are enhanced .Formation contacts and individual stratigraphic units are more detailed in the wavelet domain. The character of the stratigraphic units varies vertically and horizontally |
 | Figure 6. ‘X’-Field, Niger Delta, Arbitrary line; Sand C1, Top(2.752S) and Base, (2.768 S). Original amplitude maps along the 2D line and two gridding algorithms (Simple Kriging Algorithm)(a,b,c,d) and Inverse Distance to a power Algorithm IDP (e,f). IDP was adopted for subsequent displays |
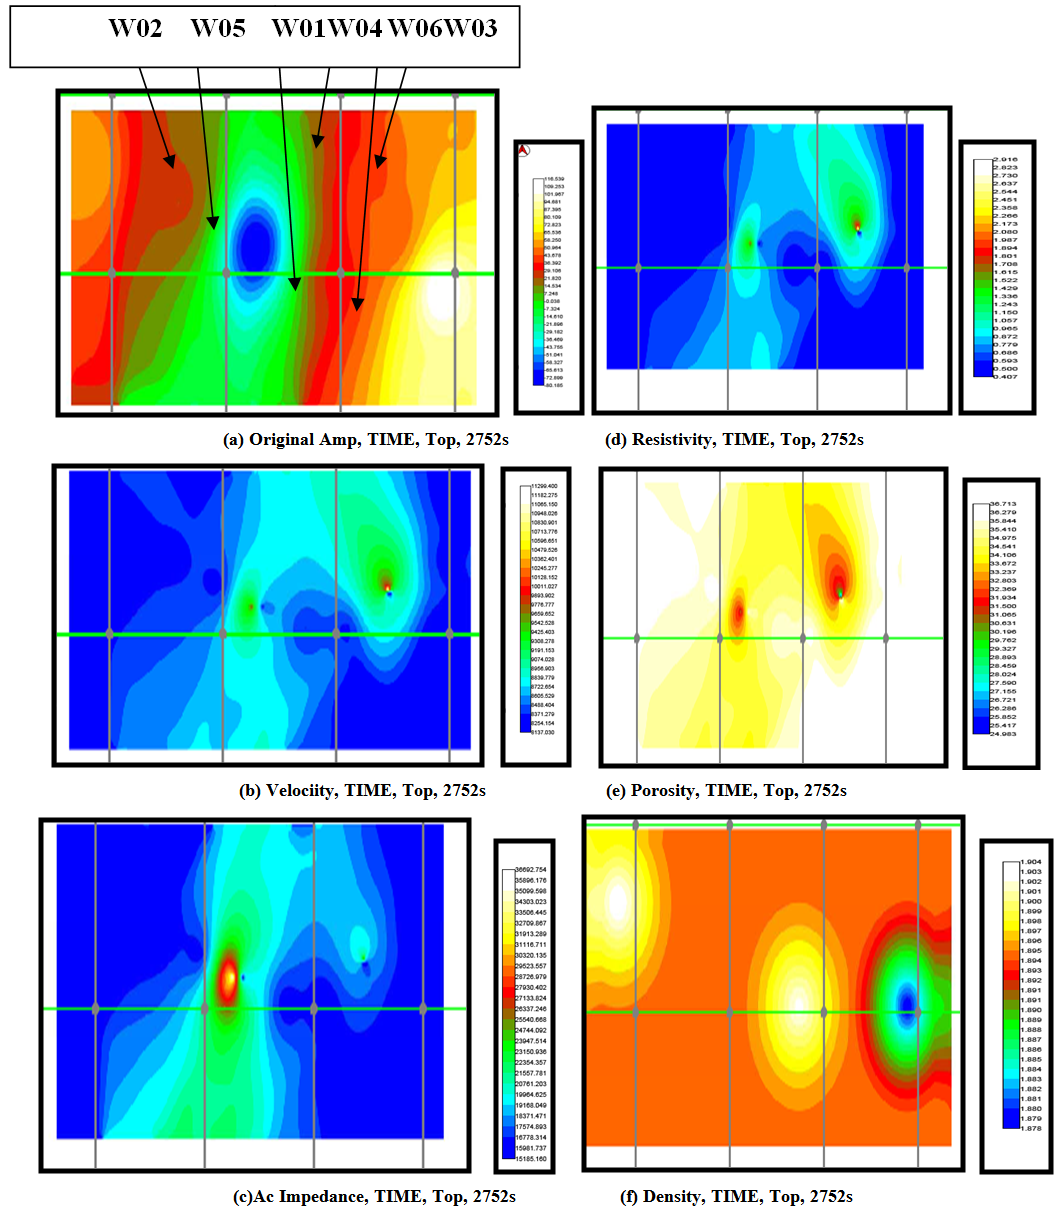 | Figure 7. ‘X’-Field, Niger Delta, (Sand C1, Top, 2.752 Secs.. 2D): (a) Original Amplitude (b) Velociity .(c)Ac. Impedance(d) Resistivity (e) Porosity (f)Density |
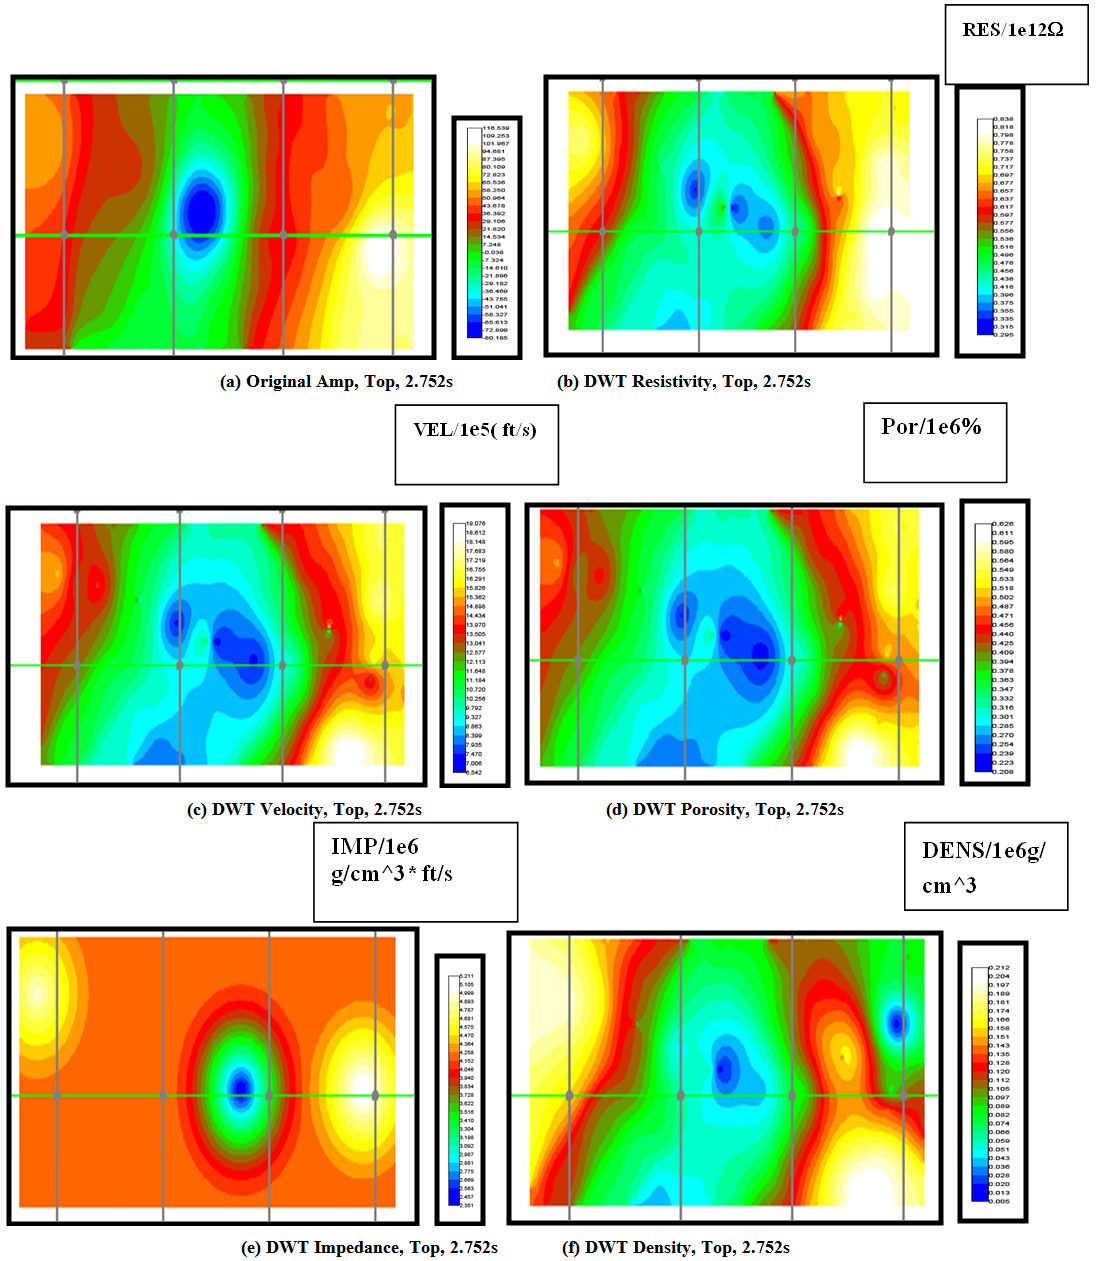 | Figure 8. ‘X’-Field, Niger Delta, (Sand C1, Top, 2.752 Secs.. 2D): (a) Original Amplitude (b) DWT Resistivity (c) DWT Velocity (d) DWT Porosity (e )DWT Impedance (f) DWT Density |
4. Sources of Errors
- (a) Inaccuracies of amplitude calibration(b) A key requirement for successful implementation of the algorithm is that the processing and analysis efforts must be sincere by a clear understanding of the phenomena that distort seismic amplitudes and the theory of signals. When this is the case, DWT analysis of seismic data can be a powerful practical tool to quantitatively unmask stratigraphy reservoir architecture. On the other hand, if the analysis lacks integrity, the technique can very well stand for obscurity, and meaningless. This is crucial in complex geological settings such as geological edges, reflection-free hydrocarbon habitats and frontier areas.
5. Conclusions
- We have presented the results of a new method and algorithm developed for computing spectral pseudo-section using the Discrete Wavelet transform in the interpretation of 3D seismic data obtained from Niger Delta. Our aim was to develop a practical method for mapping stratigraphy and characterizing hydrocarbon reservoir which are usually masked after normal data interpretation using Discrete wavelet transform.The overall objective was to provide more accurate solutions to the geologic problems of uncertain determination of reservoir geometry, fluid content, petrophysics, volumetrics, connectivity and flow units, stratification and depositional sequence in order to facilitate the drilling of wells with improved confidence.The outputs of the algorithm revealed sub-seismic faults, channels, valley system, lenses, and amplitude/petrophysical parameter transforms of the field. The reliability of the result is reinforced by its good correlation with sonic and other log data. This resolution for thin layers, from previous works, is not possible with Dix formula, using standard velocity analysis methods. The channels and their networks are more apparent and a valley system, arising from heavy faulting between the drilled wells, was deduced.. The wells were deduced to be located at banks or in channels. While wells 02 was wrongly located on shale, wells 03 and 06 were also inaccurately located on sand-shale interface, etc The potential hydrocarbon zones and associated convergent attribute information which were estimated are unambiguous. Both the possibilities, like identification of detailed stratigraphy in wavelet domain, in any zone of interest in the pseudo-sections by zooming-in, and sources of errors which are within tolerance limits are demonstrated. The qualities of the signal in the DWT domain like edges are more distinguishable in WT domain. Also, thinning and tuning effects and depositional features are more apparent. In addition the geologic age of the formation was estimated and found to be of 6.1mY (Miocene). The pseudo-sections gave direct and distinct indication of the reservoir compartments and depositional pattern. The integrated technique is fast, and low in expense. The component algorithms have been integrated into standard computer program for use in oil industry and general seismic data interpretational platforms.In conclusion, given that the literature on the use of high resolution spectral techniques is limited, the new non-conventional approach will reduce the exploration problems of accurate stratigraphic description and detection of hidden and bypassed reservoirs, and better delimit reservoirs. The net effect is that more hydrocarbons will be recovered and field development will be enhanced.
ACKNOWLEDGEMENTS
- We thank Chevron Corporation, Nigeria for making the seismic and well data available for use. We are also indebted to Shell Nigeria for the use of the Kingdom Suite Software at its work station at Department of Geology, Obafemi Awolowo University (O.A.U.), Ile-Ife, Nigeria and to the Federal University of Petroleum Resources, Effurun, Nigeria for the use of her computing facilities.