Williams Ofuyah1, Omafume Orji2, Stanley Eze1
1Department of Earth Sciences, Federal University of Petroleum Resources, Effurun, Nigeria
2Department of Petroleum Engineering and Geoscience, Petroleum Training Institue, Effurun, Nigeria
Correspondence to: Williams Ofuyah, Department of Earth Sciences, Federal University of Petroleum Resources, Effurun, Nigeria.
| Email: |  |
Copyright © 2015 Scientific & Academic Publishing. All Rights Reserved.
Abstract
Classicseismicinterpretation involves direct fault and horizon mapping, sequence stratigraphy and seismic modeling to produce structural, stratigraphic and reservoir maps for the delineation, exploration and production of hydrocarbon in oil and gas fields. The first two methods operate on stacked and migrated data, while the third is done without adequate calibration. These result in interpretational ambiguities because of poor resolution of the seismic wavelength, inadequate display of final stacks and coarse processing. Actual hydrocarbon entrapments are rarely detailed well enough to permit reliable location of wells from these studies alone. This paper presents the results of the application of spectral decomposition to 3-D seismic data over ‘X’-field, Niger Delta. Traditionally, spectral decomposition includes various techniques that require the use of a time window {e.g. Discrete Fourier transform (DFT), Maximum Entropy, Hilbert transform (HT), etc}. The resultant limitations of vertical resolution, spectral smearing, and weak frequency discrimination attributable to the applied window have led to the need to search for improved techniques. We have applied the Generalized Hilbert Transform (GHT) and Discrete Wavelet Transform (DWT) in the interpretation of 3-D seismic data. The GHT extends the HT by introducing a window and an order. Hilbert transform is of order one and one of the possible orders of implementation for the GHT. DWT uses a variable window and gives better resolution than the short-time Fourier transform with fixed window size. Our algorithm is based on Fast Fourier Transform (FFT) convolution technique and was developed from first principles and outside oil-industry interpretational platforms using standard processing programs such as Matlab, etc. The results of the spectral decomposition yielded frequency maps that revealed subtle sub-seismic faults, differences in lithology, and reliable amplitude/petrophysical parameter transforms. By revealing by-passed reservoirs and better delimiting reservoirs, more hydrocarbons will be recovered and field development will be enhanced.
Keywords:
Hilbert Transform Fourier Transform, Discrete Wavelet Transform, Convolution
Cite this paper: Williams Ofuyah, Omafume Orji, Stanley Eze, The Application of Spectral Decomposition to 3-D Seismic Data over ‘X’-Oil Field, Niger Delta, Geosciences, Vol. 5 No. 3, 2015, pp. 86-99. doi: 10.5923/j.geo.20150503.02.
1. Introduction
Spectral decomposition of a time series involves the determination of the frequency spectrum of the series for each time sample. This is desirable in the identification and characterization of transient features characterized by unknown locations and time extents. Such features constitute stratigraphic anomalies in a dense data volume, as in 3D seismic, which may not necessarily be obtained from a geologically complex hydrocarbon habitat. By decomposing such signal into elementary building blocks that are well localized in time, frequency, and space, it is possible to reliably characterize its local regularity using high resolution spectral techniques.This paper presents the results of the application of spectral decomposition to 3-D seismic data over ‘X’-field, Niger Delta. Traditionally, spectral decomposition includes various techniques that require the use of a time window {e.g. Fast Fourier transform (FFT), Discrete Fourier transform (DFT), maximum Entropy, Hilbert transform (HT), etc}. The resultant limitations of vertical resolution, spectral smearing, and weak frequency discrimination attributable to the applied window have led to the need to search for improved techniques.Recent research results indicate that accurate spectral localizations and reflections capable of delimiting and delineating direct, surface wave and artifact energy that constitute noise, in this context, can be obtained from wavelet based decompositions. [1].Some applications of spectral decomposition techniques are given in “Interpretational applications of Spectral decomposition in reservoir characterization”. [2]. Frequency- Time decomposition of seismic data using wavelet-based. [3] and complex seismic trace analysis of thin beds. [4], [5] initiated a technique for computing thickness in thin bed analysis. However, the literature on the use of high resolution spectral techniques in solving seismic signal problems is limited because it has not been well addressed and documented. Accurate knowledge of facies compartment and distribution, pressure regimes, fluid content and migration path for fluid are needed for flow models for optimal hydrocarbon recovery. We have applied the Generalized Hilbert Transform (GHT) and Discrete Wavelet Transform (DWT) in the interpretation of 3-D seismic data obtained from the Niger Delta. The GHT extends the HT by introducing a window and an order. Hilbert transform is of order one and one of the possible orders of implementation of the GHT. The DWT is defined as an analysis filter, and it is an alternative to the STFT. The discrete wavelet transform uses a variable window and gives a better resolution than the Short-time Fourier transform with fixed window size. The standard Seismic data and interpretation techniques do not resolve low amplitude anomalies in thin bed situation. We investigated, in a comprehensive manner, the weaknesses of the conventional interpretation techniques in frequency domain (spectral decomposition), and in the characterization of thin sand hydrocarbon reservoir in relation to the improvement obtained from the algorithm we developed. A thin bed, based on reflective properties, is one whose thickness is less than about one eight of the (predominant) wavelength computed using the velocity of the bed. [5]. Enhanced time domain interpretation technique was also examined.The central result of this analysis is the development and implementation of a flexible and optimal work flow interpretation algorithm. Our algorithm is based on Fast Fourier Transform (FFT) convolution technique and was developed from first principles and outside oil-industry interpretational platforms using standard processing programs such as Matlab, Pascal, etc. The results of the algorithm, when implemented on both oil-industry (e.g. Kingdom Suite) and general platforms, were comparable and convincing. In this work, the HT and structure maps only were computed with the Kingdom Suite Software. Spectral decomposition of the 3D data yielded frequency maps that revealed subtle sub-seismic faults, differences in lithology, and reliable amplitude/petrophysical parameter transforms. The practical relevance of our analysis was demonstrated by means of maps, pseudo-sections and cross plots. By revealing by-passed reservoirs and better delimiting reservoirs, a convincing image of the architecture of the Miocene-age reservoir which will facilitate the recovery of more hydrocarbons and field development, was obtained. This work has successfully characterized a Miocene-age thin reservoir in the area of study. Geological Setting The source of our data is the Niger delta region of which the ‘X’ –basin is a part. It is a prolific hydrocarbon province formed during three depositional cycles from middle cretaceous to recent in Nigeria. The recent Niger Delta has the continental, transitional and marine environments comprising braided streams, meander-belt systems, floodplain basins, barrier bars, fire sand, silt and clay. Most of the hydrocarbons are in the sandstones of the Agbada formation, mostly trapped in roll over Anticline, fronting growth faults. The shales create lateral and top seals. [6]. The reservoirs of this formation are typically channels and barrier sandstone bodies and values of porosity and permeability are generally high (up to 40% and 1-2 darcys respectively).
2. Theory of Seismic Signal Transforms
Discrete Fourier Transform The Discrete Fourier transform (DFT) is the digital equivalent of the continuous Fourier transform and is expressed as | (2.1) |
where, w is the Fourier dual of the variable ‘t’. If ‘t’ signifies time, then ‘w’ is the angular frequency which is related to the linear (temporal frequency) ‘f’. Also, f(w) comprises both real (fr(w) and imaginary fi(w) components. Hence  | (2.2) |
 | (2.3) |
 | (2.4) |
Where A(w) and  are the amplitude and phase spectra respectively. [7].The weaknesses of the DFT e.g spectral smearing can be improved by the application of short time former transform (STFT). Short-Time Fourier TransformThe Short-time Fourier transform (STFT) or windowed Fourier transform is an analysis with fixed resolution. It maps a seismogram into a 2-D frequency-time plane.It is motivated by the need for a spectral representation that incorporates the time-varying properties of a non-stationary signal. Assuming the signal f(t) (time-domain seismogram) is stationary when seen through a window g(t) of limited extent, centered at time location (T), then the STFT can be expressed as follows:
 | (2.5) |
‘g(t)’ is the window function, and ‘e-jwt’ is the Fourier kernel. This transform maps the signal into a 2-D function in a time-frequency plane (T, f). The STFT analysis depends critically on the choice of the window g(t).. [3]A key Limitation of discrete Fourier transform is that it gives scalar attributes and an average representation of the frequency behavior in a whole seismogram without information as to the local concentrations of energy. This can be improved by the application of short time former transform (STFT). The Limitations of STFT include: (i) The STFT has time-frequency resolution limitation.(ii) The use of finite- length time domain moving windows over which the 1-D Fourier transforms are performed decreases its resolving capability.In practice, the windows move along the seismogram with a time increment much smaller than the width of the windows. In doing so a more resolved F-T transform is created by finer sampling along the time axis. [3]. An improvement over the STFT is provided by the wavelet transform (WT). An interpretational work flow algorithm external to oil industry software was developed and implemented. The outputs were displayed on both general and Oil industry [8]. and compared. The enhanced definition of the geologic discontinuities is evident and self explanatory on the maps obtained from the improved techniques.Hilbert TransformComplex trace facilitates the separation of instantaneous amplitude and phase information into separate displays, and the computation of instantaneous frequency. The measured seismic signal represents the real component of an analytic signal. [9].The Hilbert transformation is a filtering operation that passes the amplitude of the spectral components unchanged but alters the phases of the spectral components by ninety degrees (∏/2). Using the notation above, and in equation 2.2., fi (w) is the Hilbert transform of fr (w). The instantaneous amplitude (envelope or reflection strength), instantaneous phase and instantaneous frequency have expressions similar to the Fourier derivatives.The Hilbert transform is sensitive to noise and suffers from computational truncation. These can be improved by the application of Generalized Hilbert transform (GHT).The Generalized Hilbert TransformThe GHT is defined as a windowed conventional Hilbert transform and it extends the HT by introducing a window and an order. Hilbert transform is of order one, and one of the possible orders of implementation for the generalized Hilbert transform. GHT improves the HT in two ways: (a) GHT has different orders, n, of computation (n=1, 2…), adjustable window shapes and widths. The conventional HT is only one (n=1) of the many possible implementations of GHT.(b) GHT is less sensitive to noise and gives better resolution of subtle features than conventional edge detection techniques. [10] If f(t, w) is the Fourier transform of input trace, the nth -order Generalized Hilbert transform can be written as | (2.6) |
The real component is expressed as  | (2.7) |
[10].The Wavelet TransformThe wavelet transform (WT) is an analysis filter. The wavelet transform has a multi scale nature and structure and gives a display which highlights its ability to localize changes much better than Fourier transform. The continuous wavelet transform of a real signal f(t) with respect to an analyzing wavelet g(t) such as Gaussian function, is defined as a set of convolutions. | (2.8) |
W (a, b) are daughters of the mother wavelet The window function g(t) is called the kernel (mother wavelet). The discrete wavelet transform was adopted for implementation [11], [3].The wavelet transform provides improved information on the complete (time-variant) character of the spectral content of a seismogram and overcomes the difficulties of the STFT. The limitations of DWT include.(i) the quality of reconstruction of a seismic trace segment using some of DWT coefficients is dependent on the choice of wavelet.(ii) In addition location shifts, time-zero uncertainties, are also known to affect the transform as do truncations, resampling, etc. [12].
3. Method
Geologic discontinuities such as faults and fractures in 3-D seismic data manifest themselves as abrupt, gradual, and gentle changes of amplitudes. The techniques for identifying abrupt and gradual changes have been provided by many authors including [13] (Coherence Cube), [2] (Spectral decomposition). In order to detect these changes, we adopted spectral analysis using HT, STFT, GHT and DWT.In the spectral domain, we employed the fast Fourier convolution techniques (FFT), a Gaussian window function, second order (n = 2) for GHT analysis and scale-translation parameters (a, b) of (2, 2) for DWT computation.The conventional transforms were first applied to a thin–sand reservoir of thickness 16ms embedded in a data cube. Having known the strengths and weaknesses of the conventional spectral techniques, they were then extended..The DFT was extended to the STFT, the HT to GHT, while the STFT was extended to the DWT, in order to overcome their limitations while retaining their desirable characteristics. The entire techniques (Conventional and developed) were applied to the thin-sand reservoir and the outputs compared. As a result of the comparative analysis involving several informative attributes of the transforms undertaken, we present only the maps of the top of the reservoir (Figures 1-8).An interpretational work flow algorithm external to oil industry software was developed and implemented on the 3D data set. Only the original and HT maps were computed within the Kingdom suite software. Other maps were computed with the developed algorithm in Matlab software.The outputs were displayed on both general and Oil industry (kingdom Suite, version 6.7, SMT) software and compared. The enhanced definition of the geologic discontinuities is evident and self explanatory on the maps obtained from the improved techniques. We mapped the zone of interest and interpreted it with the Kingdom Suite software from the outset. The entire 3D was interpreted afterwards. Wells 01, 04 and 05 were adopted as representative wells for interpretation in view of their good data quality.
4. Results
The result obtained when the entire transforms comprising the conventional and developed ones were applied to the thin sand in the 3-D data are shown in Figures 1-8. The results are presented in comparative terms and with reference to original data. This is because GHT is an extension of HT, while DWT is an alternative to STFT, which in turn extends the DFT.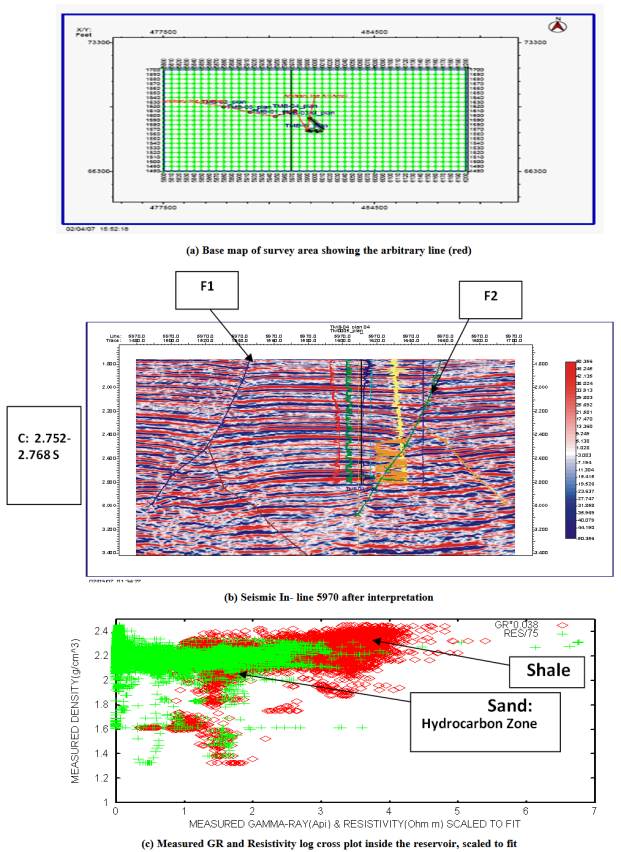 | Figure 1. ‘X’-Field, Niger Delta. : (a)Base map of survey area showing the arbitrary line (red).The Arbitrary line connects the entire wells (six) in the survey (b) Seismic In- line 5970 section after interpretation. The Reservoir interval is labeled C: 2.752-2.768 s (11127.5-11200ft) (c) Measured GR and Resistivity log cross plot inside the reservoir, scaled to fit |
The GHT was computed for order, n = 1 and 2. For the DWT computation, we used scale-translation (a, b) indices of (2, 2).The frequency spectrum for each of the techniques was plotted to verify the zone of concentration of energy. An example of such (amplitude spectrum) is shown for the DFT, STFT and DWT (Figure 2). The DWT has high resolution. The spectrum of the DFT is the most smeared, while increasingly improvement was obtained for the STFT and the GHT. The DFT/STFT/DWT maps are shown in Figure 3. In the case of the STFT, spectral component maps representing rock-property information at specific frequency band are also shown. We considered mono-frequency of 5Hz, and bandwidths of 5-15Hz, 15-25Hz and 25-35Hz, representing low, medium and high frequency spectral content. However, only the maps of 5Hz and 5-15Hz are shown. The Nyquist frequency in the data is about 37Hz.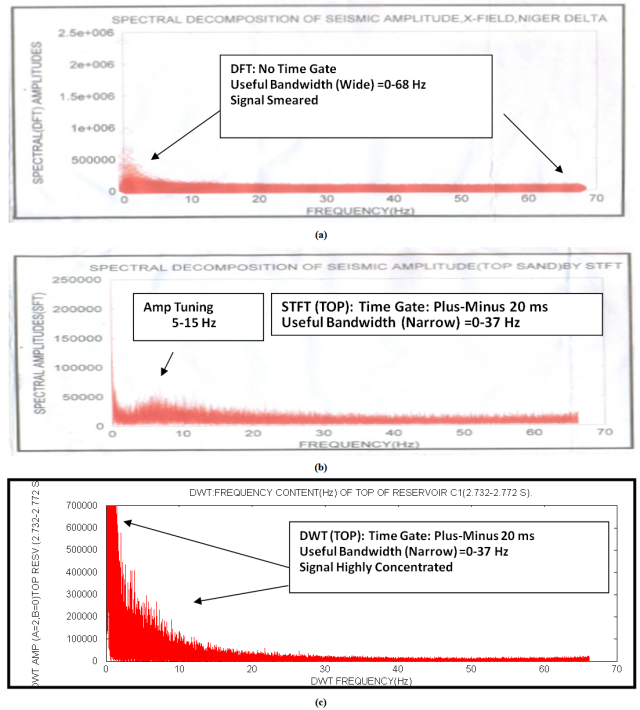 | Figure 2. ‘X’-Field, Niger Delta: 3-D Data (Top, C1, 2.752 secs). Amplitude Spectrum of (a) Discrete Fourier Transform (DFT) (b) Short-Time Fourier Transform (STFT). (c)Discrete Wavelet Transform (DWT) |
Volume Data (3D): Spectral Characteristics by DFT and STFT and DWTThe DWT2, 2 attributes were computed to evaluate the effect of data scaling and translation on image resolution.The HT maps displayed here were computed with the kingdom suite software. We state, from our experience, that the L1 order GHT gives better maps than the conventional HT. This is in view of the computation truncation of the HT. The L2-order GHT attributes computed are amplitude, envelope (instantaneous) amplitude, instantaneous phase and instantaneous frequency.Samples of the images of the Miocene-age thin-bed reservoir under study were adopted for interpretation. Others were used as references. The Discrete, Short-time Fourier and Discrete wavelet transform attribute maps are presented in Figures 3-8. The maps for the Hilbert and L2 order Generalized Hilbert transforms are in Figures 4-8. In Figure 8, the amplitude maps of the original, STFT 5-15Hz, GHT envelope and DWT (2, 2) are cross-compared to determine the map that best captures the stratigraphy.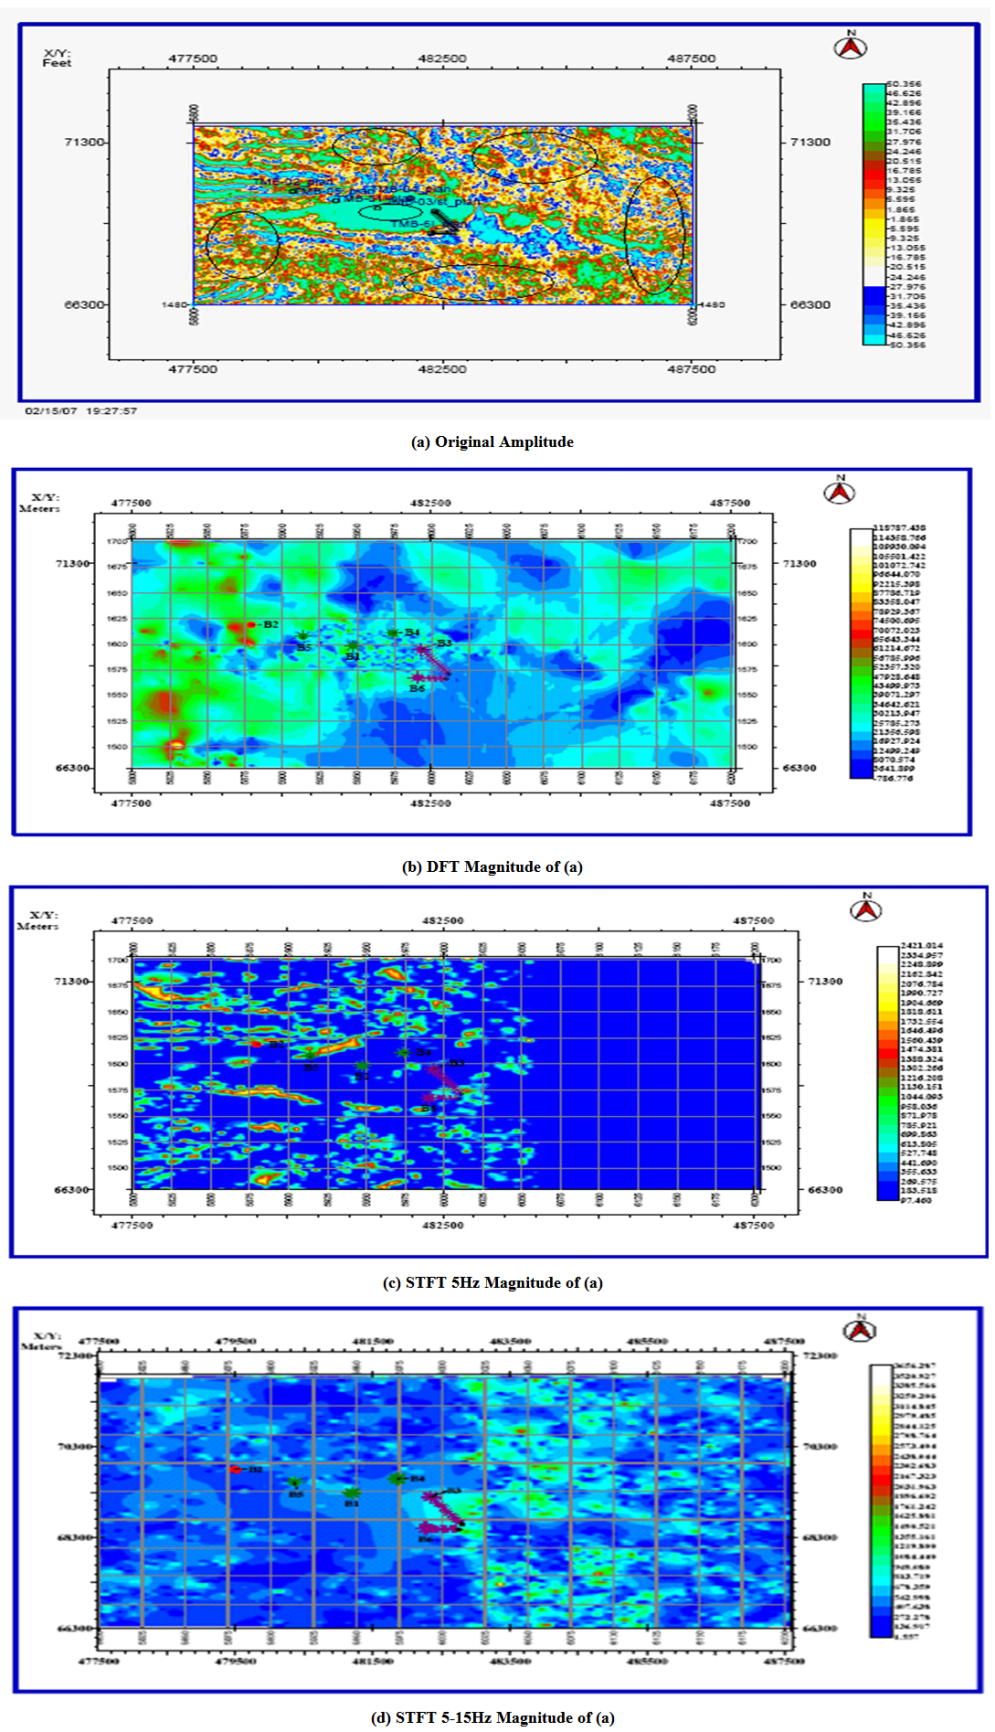 | Figure 3. ‘X’-Field, Niger Delta, Sand C1, Top, 2.752 Secs.). 3D): (a) Original Amplitude (b) DFT Magnitude of (a). (c) STFT 5Hz Magnitude of (a). (d) STFT 5-15Hz Magnitude map of (a). The STFT 5-15Hz gives the clearest image here |
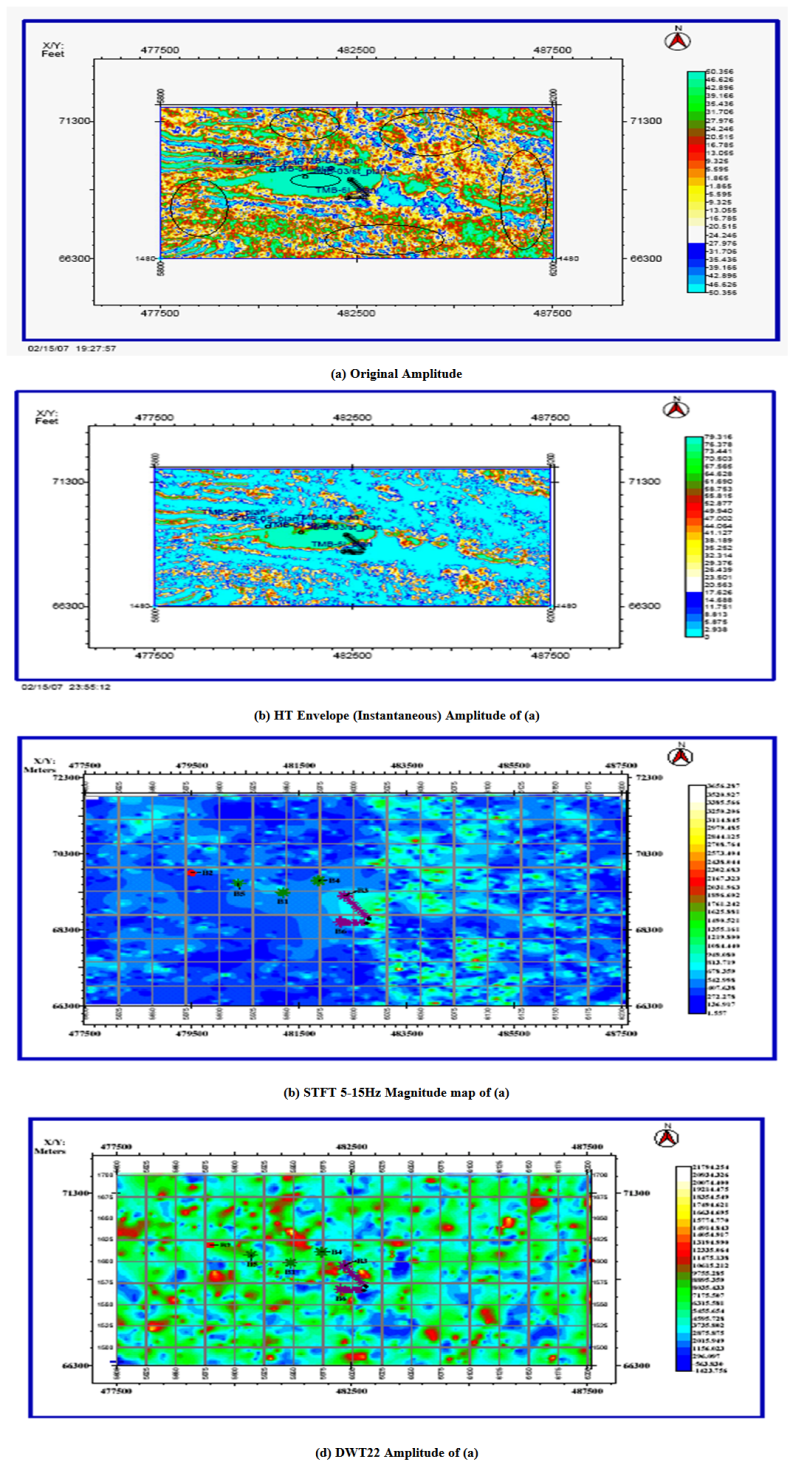 | Figure 4. ‘X’-Field, Niger Delta, (a)). Original Amplitude (b) HT Envelope(Instantaneous) Amplitude of (a) (c) STFT 5-15Hz Magnitude map of (a). (d) DWT22 Amplitude of (a). More prospective zones (green) can be seen in (c) and (d) |
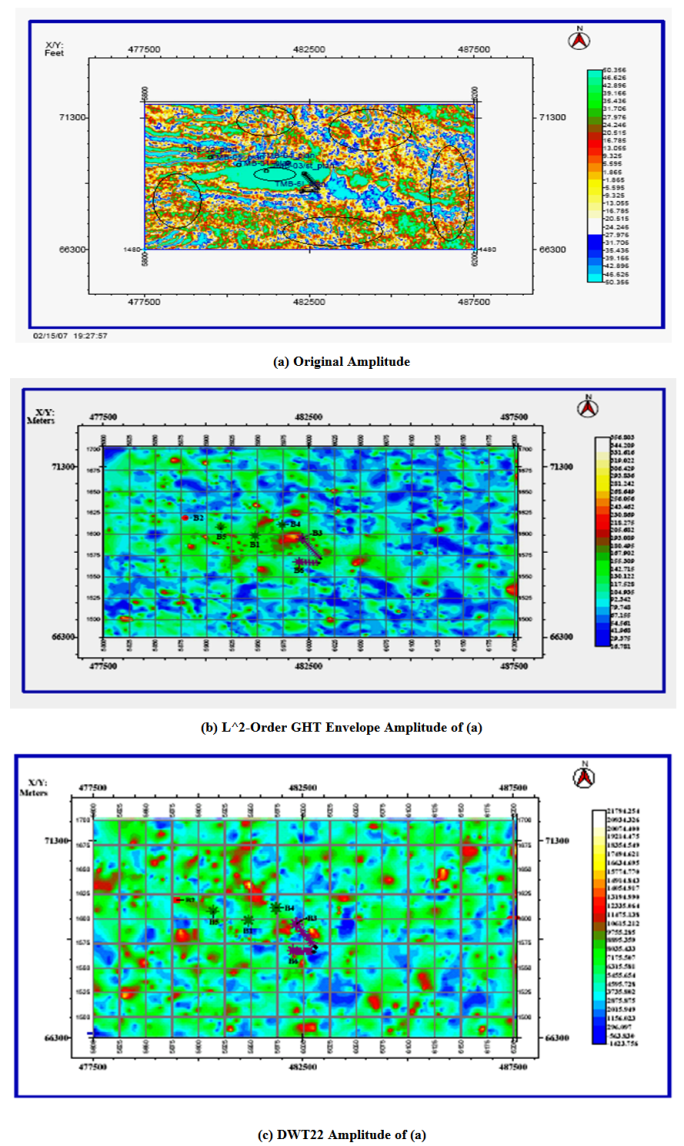 | Figure 5. ‘X’-Field, Niger Delta, (a) Original Amplitude (b) L^2-Order GHT Envelope of (a) (c) DWT22 Amplitude of (a). The prospective zones are the green locations in (b) and (c)The channel is shown as blue but not evident on the original amplitude display |
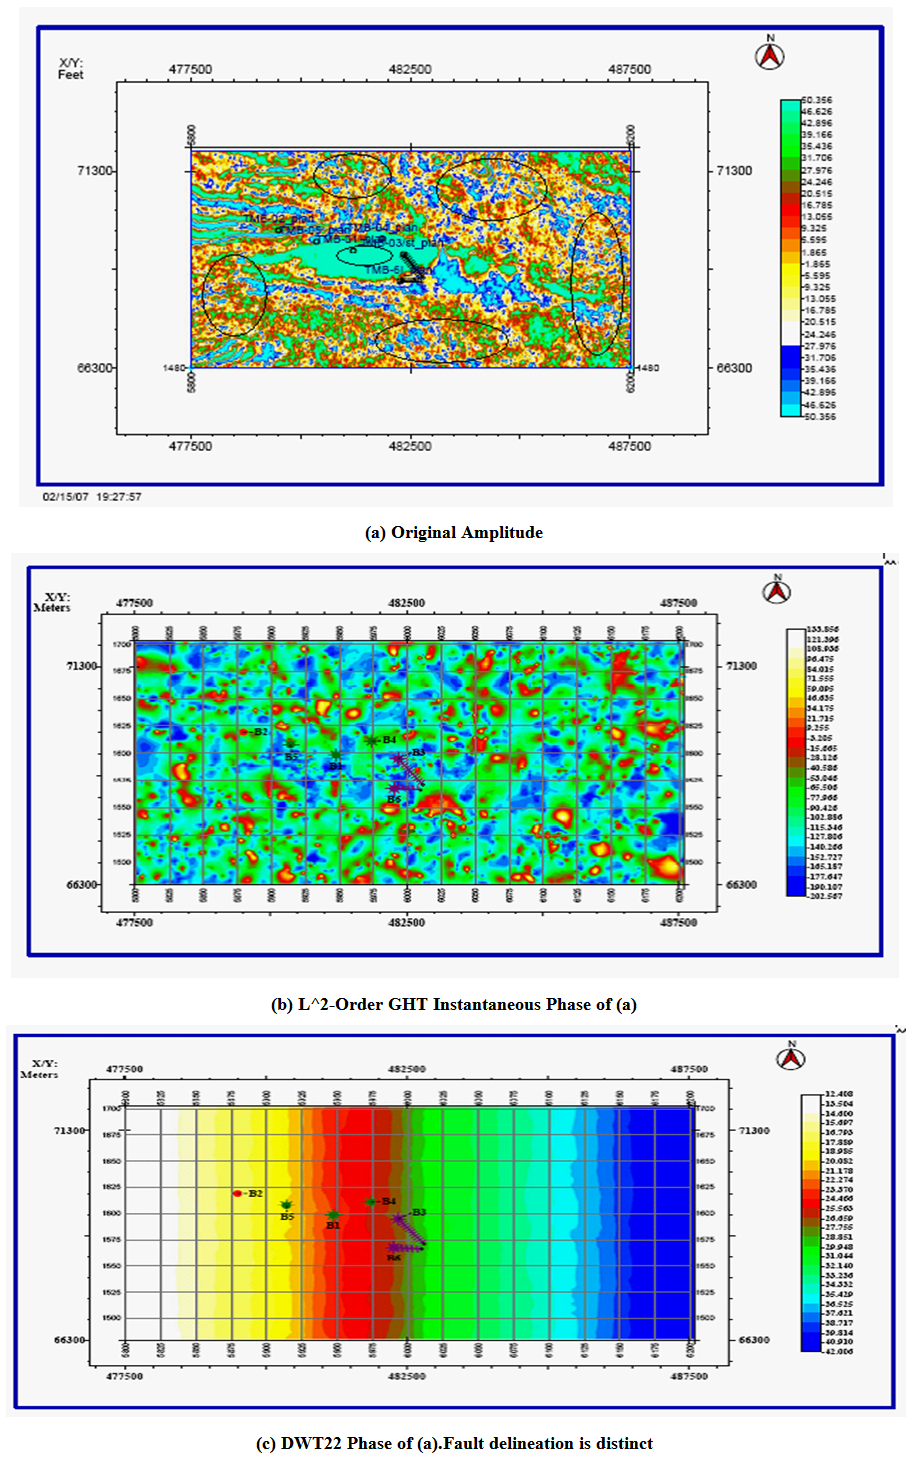 | Figure 6. ‘X’-Field, Niger Delta: (a) Original Amplitude (b) L^2-Order GHT Instantaneous Phase (c) DWT22 Phase of .Fault delineation is distinct in DWT22. There is clear cut phase segmentation in (c) |
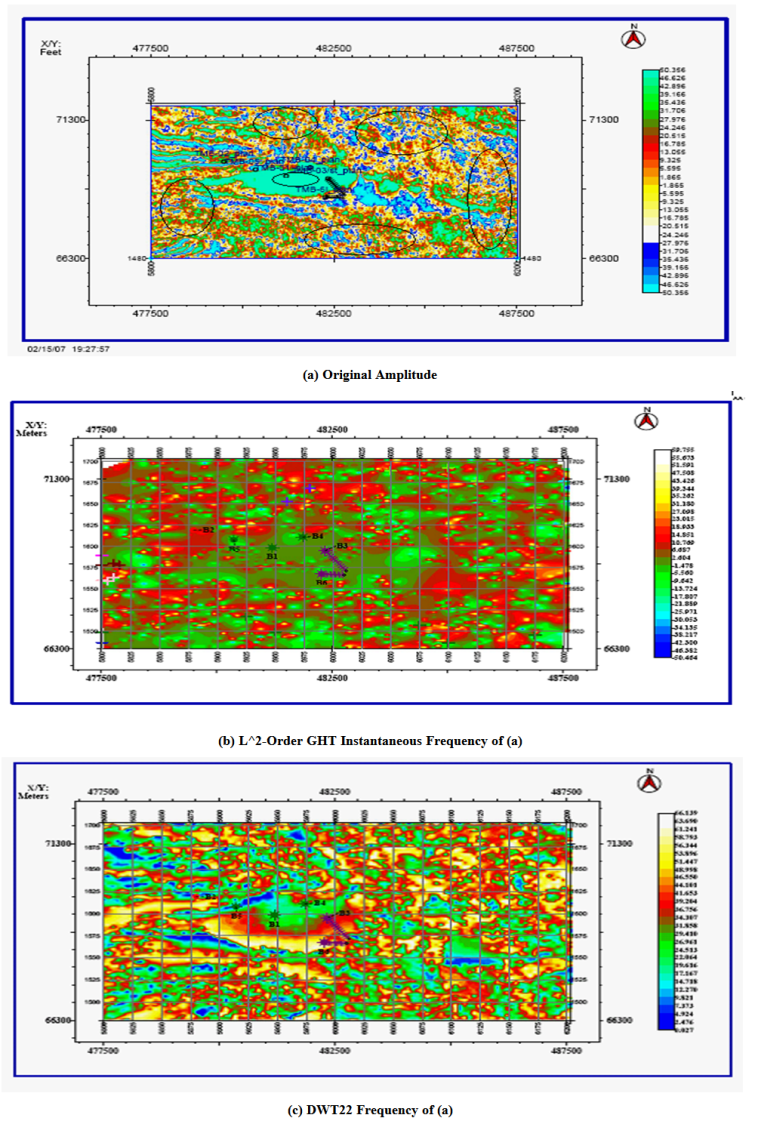 | Figure 7. ‘X’-Field, Niger Delta: (a) Original Amplitude (b) (b) ) L^2-Order GHT Instantaneous Frequency of (a) (c)DWT22 Frequency of (a).The green and blue locations(low frequency) are the sand zones ,while the red and yellow locations(high frequency) characterize the shale zones |
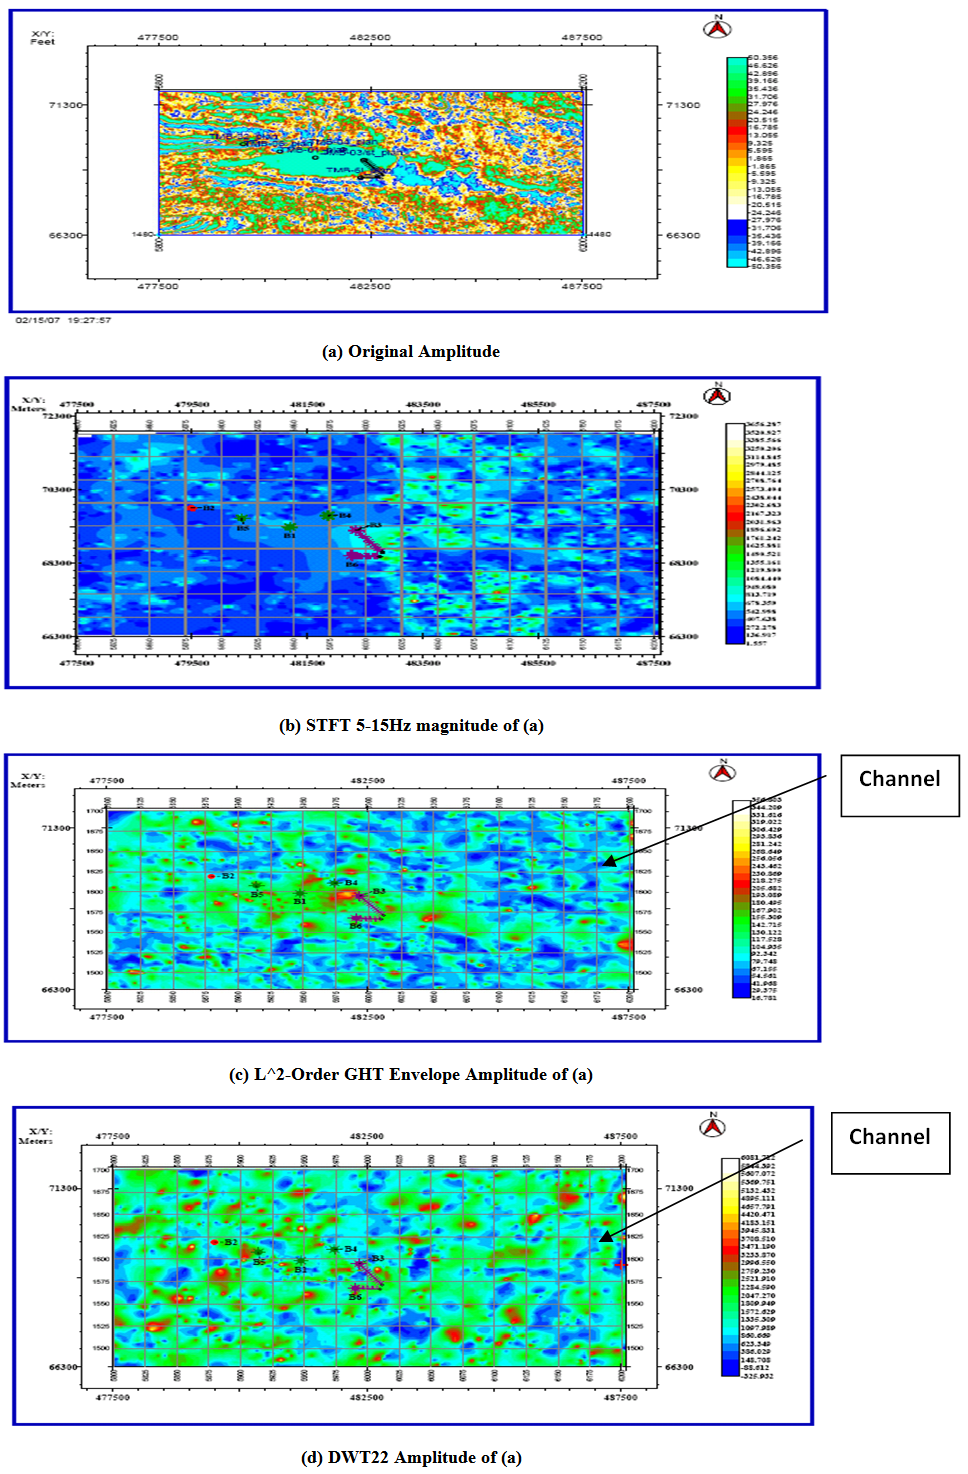 | Figure 8. ‘X’-Field, Niger Delta, (Sand C1, Top, 2.752 Secs.. 3D): (a) Original Amplitude (b) STFT 5-15Hz magnitude of (a). (c) L^2-Order GHT Envelope Amplitude of (a). (d) DWT22 Amplitude of (a) |
5. Discussion of Results
The magnitude display in Figure 3 indicates that the STFT map at tuning amplitude (5-15Hz) is better than that of mono-frequency of 5Hz while the DFT magnitude is smeared. The bases of well 03 and 06, for instance, are not distinctly located in channel on DFT, but distinguished on the STFT maps, particularly the STFT (5-15Hz) (resonant amplitude band). The DFT and STFT maps indicate that well 02, 03 and 06 are located on shale. On the original map, well 02 and the top of wells 03 and 06 are shown to be on sand and well 05 in channel. Wells 01, 04 and 05 are properly located on sand and is reflected in their good data quality. However the DWT2,2 phase (Figure 6) indicates clearer images as it shows convergent phase ridges, the highs (White) and the lows (Red and Green) axes. This contrasts with the zeroing due to small phase values as in Fourier maps.The frequency map of DWT2,2 (Figure 7) shows that translated wavelet (DWT2,2 ) gives better image. The channel paths (Blue) are within a bandwidth of 0-27Hz. This is consistent with the frequency spectrum in Figure 2. The useful frequency band of the DFT (0-65Hz) is smeared. That of the STFT (0-40Hz) is also smeared but better than that of DFT. The useful bandwidth of the DWT is 0-25Hz. The bandwidth is also 0-22Hz (Green) for the arbitrary map (HT instantaneous frequency, not shown). This reinforces the deduction that the DWT attribute maps are superior to the DFT and STFT, and closest to the hard data (Figure 4).In figure 18, the GHT amplitude map gives better definition of the stratigraphy than on both the original and HT amplitude maps.On the GHT instantaneous frequency map in Figure 7, it can be seen that the accurately located wells (01, 04, and 05) are sited where frequency values are within 0-25Hz (Green) on the map. This is consistent with the DWT bandwidth. New prospective zones can be inferred from the Green locations on the GHT map.The superiority of the DWT2,2 frequency can be seen in Figure 7 and the useful frequency limit is 27Hz. The integrated display of the amplitudes map of original, STFT, GHT and DWT is shown in Figure 8. The GHT envelope and DWT2,2 maps give enhanced images of the top amplitude in most respects. Other distinguishing events such as channel patterns are clearer on the DWT than on any of the Fourier techniques.
6. Summary and Conclusions
We have investigated five different spectral decomposition techniques that use seismic data for the characterization of thin-sand reservoir. Our aim was to develop a practical method for mapping stratigraphy which is usually masked after normal data interpretation.Seismic data obtained from the Niger Delta were analyzed using the DFT, HT, STFT, GHT and DWT. By comparing the features on the HT, DFT, STFT and those seen on the GHT and DWT with respect to noise level, such sensitivity becomes evident for the conventional techniques, whereas the GHT and DWT techniques images are stable and clearer. Poor interpretation results in wrong well location, reservoir by-pass and hence slow field development.Each attribute from the algorithm provides new and different but convergent information all of which, when integrated, aid in well planning location and field development.We established that reservoir is compartmentalized into two parts, and that the reservoir is of the channel type, typical of many reservoirs in the Niger Delta. In addition we deduced a negative relief (beyond well 0.2 and) and a positive one (beyond wells 03 and 06) indicating a depression or valley. The wells are located at the banks of the channels and there is heavy faulting at line 5840 (corresponding to the negative relief) and at line 6100 (positive slope).We conclude that joint GHT and DWT analysis of seismic data in combination with the classical STFT can be a powerful practical tool to quantitatively map reservoir architecture. This is crucial in complex geological settings such as geological edges and reflection-free hydrocarbon habitats.Our algorithm is flexible and relatively inexpensive and was developed from first principles and outside standard oil-industry interpretational platforms but using standard processing routines. We implemented it on both standard and general platforms and found the match, on comparison to be convincing.This technology has successfully characterized the thin- sand reservoir and delineated other stratigraphic and structural settings in the area of study.
ACKNOWLEDGEMENTS
We thank Chevron Corporation, Nigeria for making the seismic and well data available for use. We are also indebted to Shell Nigeria for the use of the Kingdom Suite Software at its work station at Department of Geology, Obafemi Awolowo University (O.A.U.), Ile-Ife, Nigeria and to the Federal University of Petroleum Resources, Effurun, Nigeria for the use of her computing facilities.
References
| [1] | G.S Visher. Stratigraphic system analysis and Business decision making. The leading edge, 2004, June, pp 548. |
| [2] | G. Partyka, G., J. Gridley, and J. Lopez.: Interpretational applications of Spectral decomposition in reservoir characterization The Leading Edge, 1999, March, Pp. 353-360. |
| [3] | A. Chakraborty and D. Okaya,: Frequency-Time decomposition of seismic data using wavelet-based methods. Geophysics, 1995, vol. 60 No 6, Nov-Dec, Pp 1906-1916. |
| [4] | J.D. Robertson, J.D. and H.H Nogami. Complex Seismic Trace Analysis of Thin Beds, Geophysics, 1984,Vol. 49, PP. 344 – 353. |
| [5] | M. B. Widess: How thin is a thin bed? Geophysics, 1973, No.6, vol. 38 pp 17-180. |
| [6] | K.C. Short, and A.J. Stauble): Outline of the Geology of the Niger Delta. AAPG Bulleting, 1997 Vol 51, Pp 761-779. |
| [7] | O. Yilmaz: Seismic data processing, society of exploration geophysicists, 2001, Tulsa Oklahoma. |
| [8] | The kingdom suite manual, version 5.1, 1998, pp 152-160. |
| [9] | M.T. Tanner, F. Koehler, and R.F. Sheriff: Complex seismic trace analysis. Geophysics, 1979, vol. 44, No 6, Pp 1041-1063. |
| [10] | Y. Luo, S. AL-Dossary, M. Marhoon and M. Alfara. Generalized Hibert transform and its applications in geophysics the leading edge, 2003, March pp 199-202. |
| [11] | R.K. Young Wavelet theory and its Applications, 1995, kluwer Academic Publishers, U.S.A. |
| [12] | H.J. Grubb and A.T. Walden. Characterizing seismic time series using the Discrete Wavelet Transform, geophysical prospecting, 1997, vol. 45, pp 183-205. |
| [13] | Bahorich and Farmer, (1995): The coherence cube, The Leading Edge. |
 Abstract
 Reference
 Full-Text PDF
 Full-text HTML