-
Paper Information
- Paper Submission
-
Journal Information
- About This Journal
- Editorial Board
- Current Issue
- Archive
- Author Guidelines
- Contact Us
Geosciences
p-ISSN: 2163-1697 e-ISSN: 2163-1719
2015; 5(3): 81-85
doi:10.5923/j.geo.20150503.01
Seismic Hazard Assessment in Hindukush-Pamir Himalaya Using IMS Network
 Abstract
 Reference
 Full-Text PDF
 Full-text HTML
Manisha Singh1, D. Shanker2, Sherif M. ALI3, 4
1Department of Computing Science and Engineering, Galgotias University, Greater Noida, India
2Indian Institute of Technology Roorkee, Department of Earthquake Engineering, India
3Preparatory Commission for the Comprehensive Nuclear-Test-Ban Treaty Organization (CTBTO), Provisional Technical Secretariat, International Data Centre (IDC), Vienna, Austria
4National Research Institute of Astronomy and Geophysics (NRIAG), Cairo, Egypt
Correspondence to: Manisha Singh, Department of Computing Science and Engineering, Galgotias University, Greater Noida, India.
| Email: |  |
Copyright © 2015 Scientific & Academic Publishing. All Rights Reserved.
Hindukush–Pamir Himalaya and their vicinity bounded by 25–40°N and 65–85°E have been considered for future earthquake hazard. This is one of the most seismically active continent – continent collision-type active plate regions of the world where earthquakes of magnitude 8.6 have occurred during the past hundred years. Seventeen years earthquake data from June 13, 1999 to March 12, 2015 have been taken from International Monitoring System (IMS) Network setup by Comprehensive Nuclear-Test-Ban Treaty Organization (CTBTO), Vienna Austria. Gumbel’s Type I extreme event statistics [1] has been applied to analyses those maximum magnitude data with a satisfactory degree of correlation (0.92). The result of analysis has enabled earthquake hazard that exist in the Hindukush-Pamir Himalayan belt to be quantified in terms of recurrence periods and probabilities of occurrence of earthquake of any given magnitude. The line of expected extremes (LEE) which is based on 17 years (1999-2015) of seismicity data of yearly extreme values of earthquakes for the region has been plotted. The medium to large size earthquakes which is expected to occur in this region has been predicted. Study indicates that the most probable largest annual earthquakes are close to 5.5. The most probable earthquakes that may occur in an interval of 50 years are estimated as 6.6.
Keywords: Comprehensive Nuclear-Test-Ban Treaty Organization (CTBTO), The line of expected extremes (LEE), International Monitoring System (IMS) Network, Seismic Hazard
Cite this paper: Manisha Singh, D. Shanker, Sherif M. ALI, Seismic Hazard Assessment in Hindukush-Pamir Himalaya Using IMS Network, Geosciences, Vol. 5 No. 3, 2015, pp. 81-85. doi: 10.5923/j.geo.20150503.01.
Article Outline
1. Introduction
- Seismic hazard and related earthquake engineering determinations usually need estimate of return periods or probabilities of exceedance of specific levels of design load criteria or extremal safety conditions. Assessment of seismic hazard holds a major problem in earthquake engineering. There are several validations for adopting extreme value distributions [2-16]. There is the real believed in any analysis of seismic risk that it is the extreme or maximum events which are of most interest and important that impact on in day to day life of the people and their environment. Therefore effective engineering solutions are required to meet the challenges in this area regarding earthquakes and its impacts on civil society. This study will be very helpful for future preparedness and planning and even construction practices in the area because through this we can estimate the probable return periods of the earthquakes and their probable magnitudes occurrence1.
2. Regional Characteristics
- Hindukush–Pamir Himalaya and their vicinity bounded by 25–40°N and 65–85°E have been considered for future earthquake hazard (Figure 1). This region is situated on the northern boundary of the Indian Plate along its northwestern flanks. In the past few decades there have been major advances in understanding the seismic and tectonic characteristics of this zone. It is believed that the current tectonic and seismic activity in central Asia is often considered to be the consequence of continental collision between India and Eurasia. However, the tectonic and seismic characteristics of the Hindukush can not be explained solely by the collision between the two plates, but thermal convection below the Indian Plate and the flow of the upper mantle in the Tibetan plateau region would affect earthquake activity and stress in the subducted lithosphere [8].
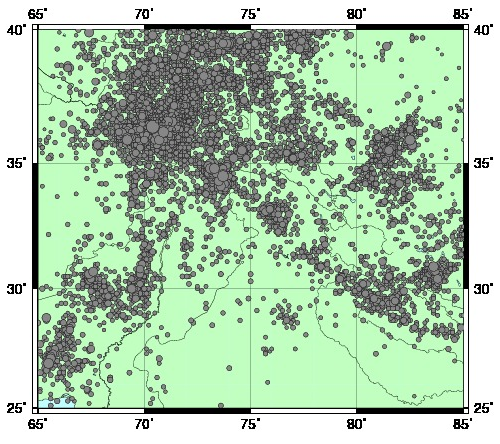 | Figure 1. Seismic activity recorded by (IMS) from 1999 to 2015 at the considered region |
3. The Data and Method of Analysis
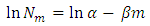
- Seismic technology is one of three waveform technologies which are part of the Comprehensive Nuclear Test Ban Treaty (CTBT) verification regime. The International Monitoring System (IMS) of the CTBT consists of 337 monitoring stations and laboratories world-wide. These facilities include 50 Primary and 120 Auxiliary seismic stations, installed world-wide and transmitting data to the International Data Centre (IDC). Since June 1999, the IDC began routine automatic and interactive processing of seismic data; the detected and located events are systematically included in the Reviewed Event Bulletin (REB).Study investigates Seventeen years earthquake data from June 13, 1999 to March 12, 2015 with M ≥ 5.0 for the considered region (25–40°N and 65–85°E) taken from International Monitoring System (IMS) Network setup by Comprehensive Nuclear-Test-Ban Treaty Organization (CTBTO), Vienna Austria. In order to study the earthquake risk, probability of occurrence and return periods, the earthquake data distributed over 17 years periods has been divide into one year time interval such as at least one event in each year duration is observed, which is necessary condition of the validity of the approach. Gumbel’s [1] extreme value theory postulates that if the earthquake magnitude is unlimited, if the number of earthquakes per year decreases with their increase in size, and if individual events are unrelated, then the largest annual earthquake magnitude is distributed by cumulative distribution function G(m), where
 | (1) |
 | (2) |
 represents the plotting position. The mean frequency of i-th observation in the ordered set of extremes may be represented as
 | (3) |
 is the total number of observed data. The relationship between Gumbel parameters
  and
and  and Gutenberg-Richter parameters a and b can be given by the expression
 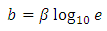 | (4) |
 | (5) |
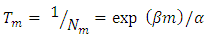
 , in a given year having magnitude exceeding
  can be expressed by the Gutenberg- Richter seismicity relation as
 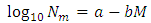 | (6) |
 and
and  are constants.From equation (6)
 | (7) |
 occurring within one year is given by the Poisson process as
 | (8) |
 | (9) |
 within t years can be given by the equation
 | (10) |
 | (11) |
 | (12) |
4. Results and Discussion
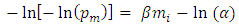
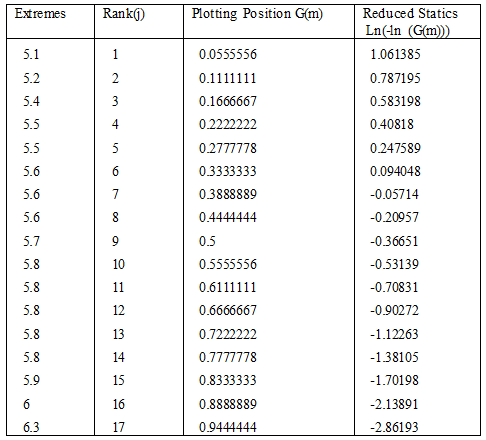
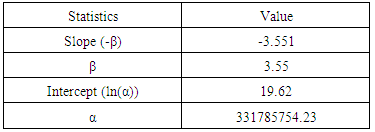
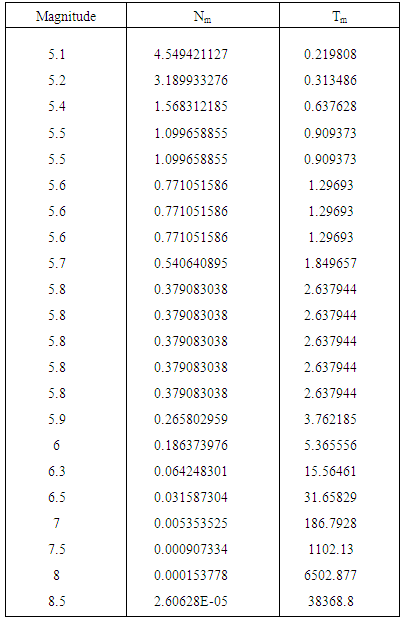
- Based on these, estimated results are summarised in tables and figures.The annual maximum magnitudes of seismic events recorded in the considered region from the year 1999 to 2015 are shown in Table 1. The events are arranged in rank order, and the values of cumulative frequency probability, are calculated using Eq (3). The Extreme Event Type I reduced variate, is then calculated as per Eq (2). The obtained data from this process is given in Table 1. The values of α and β are then estimated from a least-square fit to the reduced variate linear equation (Fig. 4) and given in Table 2. The figure 3 shows the mean Line of Expected Extreme (LEE) to study the probability of largest extreme in the considered region.
|
|
|
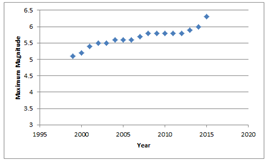 | Figure 2. Variation maximum magnitude with year |
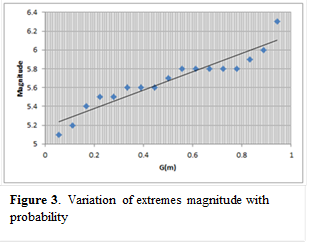 | Figure 3. Variation of extremes magnitude with probability |
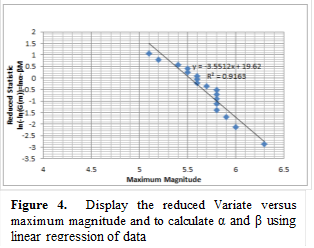 | Figure 4. Display the reduced Variate versus maximum magnitude and to calculate α and β using linear regression of data |
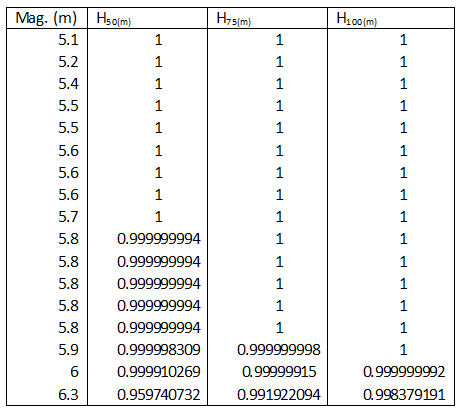
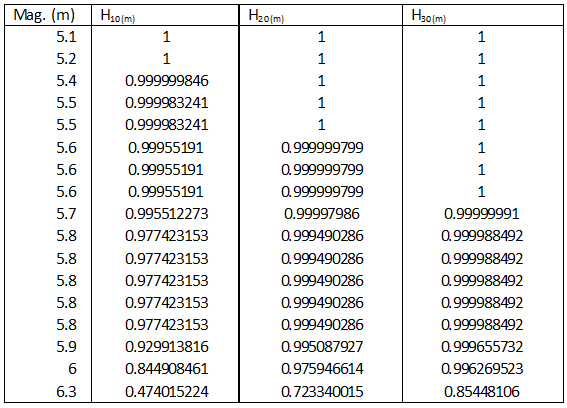
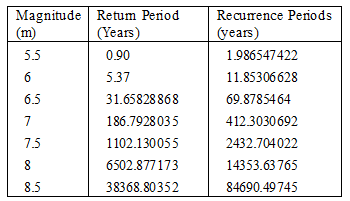
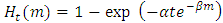 . The earthquake hazard for different magnitude and different time period are estimated and summarized in Table 4 & 5. The earthquake hazard probabilities are also offered in Figure 5, for 10-years, 20-years and 30-years periods. The general interpretation of this curve reveals that the probability of an earthquake of magnitude 5.5 occurring in the considered region with 20-years period is estimated to be 0.999 (Although, probability of any particular event is never absolutely certain). This means that at least one earthquake of magnitude 5.5 will surely occur within that period of time.
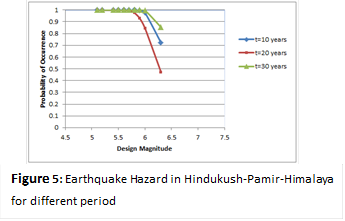 | Figure 5. Earthquake Hazard in Hindukush-Pamir-Himalaya for different period |
|
|
|
ACKNOWLEDGEMENTS
- Authors are thankful to their respective institute for their cooperation and help for carry out this work. Authors are also indebted to CTBTO, International Data Centre for allowing use of IMS data for this study. The generic mapping tools, GMT, [19] were used for mapping.
Note
- 1. The views expressed herein are those of the authors and do not necessarily reflect the views of the CTBTO Preparatory Commission nor those of the Galgotias University and Indian Institute of Technology, Roorkee.