-
Paper Information
- Paper Submission
-
Journal Information
- About This Journal
- Editorial Board
- Current Issue
- Archive
- Author Guidelines
- Contact Us
Geosciences
p-ISSN: 2163-1697 e-ISSN: 2163-1719
2015; 5(2): 70-80
doi:10.5923/j.geo.20150502.03
Delineation of Leachate Plume Migration Using Electrical Resistivity Imaging on Lapite Dumpsite in Ibadan, Southwestern Nigeria
Ganiyu S. A.1, Badmus B. S.1, Oladunjoye M. A.2, Aizebeokhai A. P.3, Olurin O. T.1
1Department of Physics, Federal University of Agriculture Abeokuta, Ogun State Nigeria
2Department of Geology, University of Ibadan, Oyo State Nigeria
3Department of Physics, Covenant University, Ota, Nigeria
Correspondence to: Ganiyu S. A., Department of Physics, Federal University of Agriculture Abeokuta, Ogun State Nigeria.
| Email: |  |
Copyright © 2015 Scientific & Academic Publishing. All Rights Reserved.
A geophysical investigation involving 2D resistivity survey was carried out on Lapite dump site that has been in operation since 1998 in ancient city of Ibadan, Southwestern Nigeria. The aim was to map the conductive leachate plume and extent of migration of leachate plumes in the subsurface for possible groundwater contamination. The 2D resistivity survey was carried out using Campus Tigre model resistivity meter with Wenner array configuration of electrode spacing distance ranging from 5 - 25m. A total of nine (9) 2D resistivity profiles with length ranging between 80 and 120 m were conducted within the dump site. A control profile of 2D resistivity survey was also carried out at about 300 m away from the dump site. The obtained resistivity data was interpreted using both RES2DINV and RES3DINV respectively. The 2D and 3D inverse resistivity models of the subsurface revealed the extent of leachate plumes with resistivity values less than 10 Ωm and allowed the location of leachate, clay soil, bedrock and seepage path from the dumpsite to be clearly delineated. There may be possible contamination of shallow groundwater system in the nearest future if proper mitigation measures are not taken into consideration at the dumpsite.
Keywords: Dumpsite, Profile, Resistivity, Leachate, Groundwater contamination
Cite this paper: Ganiyu S. A., Badmus B. S., Oladunjoye M. A., Aizebeokhai A. P., Olurin O. T., Delineation of Leachate Plume Migration Using Electrical Resistivity Imaging on Lapite Dumpsite in Ibadan, Southwestern Nigeria, Geosciences, Vol. 5 No. 2, 2015, pp. 70-80. doi: 10.5923/j.geo.20150502.03.
Article Outline
1. Introduction
- Solid wastes are produced on daily basis as a result of direct consequence of inevitable human activities. The intensity of man’s activities has led to increasing volume of solid waste worldwide despite the current level of global technological advancement and industrialization. Landfill/ dumpsite serves as the ultimate recipient of municipal solid waste. It is a common waste management practice employed by many nations in many parts of the world [13]. The waste dumped in this process causes various aesthetic and public health problems and also attracts insects, rodents and various disease vectors [21], [2]. The solid waste in this dumping process undergoes slow, anaerobic decomposition over a period of years and generate substantial amount of leachate with decomposing products such as leachate, landfill gas, heavy metals and varieties of hazardous pollutants which may seep from the landfill site into underground aquifers and thus polluting much needed urban water resources [10]. Leachate is a liquid formed from decomposed waste and has higher conductivity due to the presence of dissolved salts. Consequently, the electrical resistivity of leachate is often very much lower than natural groundwater. Pollutants or contaminants released into the environment rarely remains at the point of discharge. They are transported through the porous media by four basic mechanisms. These are advection, molecular diffusion, mechanical dispersion and adsorption [18]. Adsorption is one of the most important transport mechanisms that affect the fate of chemicals in soils and determine their distribution in the soil water environment [14]. Pollution of groundwater happens mostly due to percolation of fluvial water and infiltration of contaminants through the soil in waste disposal sites [1].Leachate is generally associated with high ion concentrations and hence results in very low resistivity of the rock formations containing them [11]. This makes geoelectrical techniques most adequate for mapping the extent of leachate contamination around landfills [9]. Geoelectrical surveys on dumpsite have been carried out by numerous researchers on leachate contamination of soil and groundwater. [15] have used 2D resistivity Imaging and Vertical Electrical Sounding to estimate the depth to the groundwater table, identify and delineate the extent of contaminant leachate plume and migration paths below the surface around landfill. [1] carried out integrated geophysical surveys involving 2D electrical resistivity, Very Low Frequency-EM and Seismic refraction tomography on Unguwan Dosa municipal solid waste disposal site in Kaduna metropolis, Northwestern Nigeria to investigate groundwater contamination. [12] carried out integrated surveys of induced polarization and 2D resistivity tomography at open waste disposal site in Kaduna with the aim of imaging the subsurface to delineate leachate plumes and their pathways into the groundwater.[21], [5], [20] have used geophysical resistivity imaging for better understanding of contaminant transport from leachate in a basement complex terrain.The main objective of this study is to detect the leachate plume zone in the crystalline basement area and delineate the level and extent of contamination caused by leachate derived from an opened waste disposal site. The use of resistivity imaging method will present detailed information about the delineation of contaminated zones of groundwater around the dumpsite. Site description and Geological SettingThe study area, Lapite refuse dumpsite (Fig 1) is located within Ibadan metropolis in Akinyele local government area and lies within longitudes 3.91160°E and 3.91464°E and latitudes 7.5825°N and 7.57032°N in southwestern Nigeria. It was opened in 1998 and still in use till date. It covers an approximate 20 hectares of land along Old Oyo Road. It is owned and maintained by Oyo State Waste Management Authority (OSWMA). Lapite dumpsite is one of the four designated open waste disposal being managed by OSWMA. The general overview of the dump site is shown in Figure 2. The study area falls within the humid and sub-humid tropical climate of southwestern Nigeria with a mean annual rainfall of about 1270mm mean annual potential evaporation of 1100mm and a mean maximum temperature of 32°C [3].
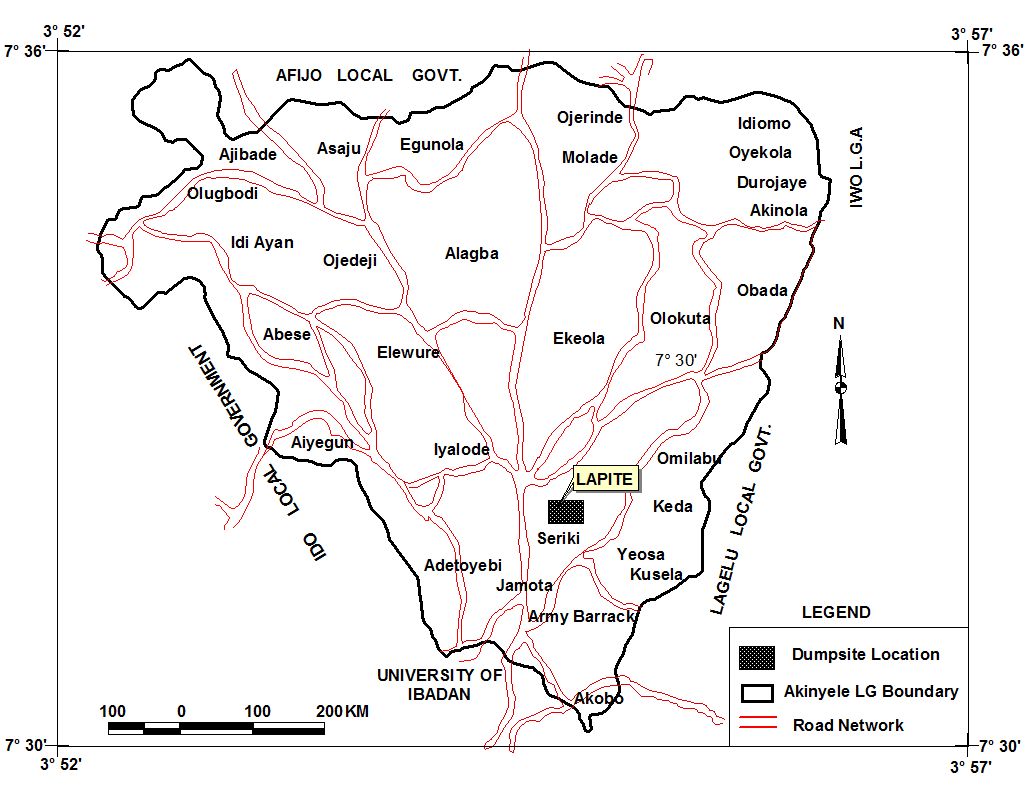 | Figure 1. Location map of Akinyele Local Government Area showing Lapite landfill site |
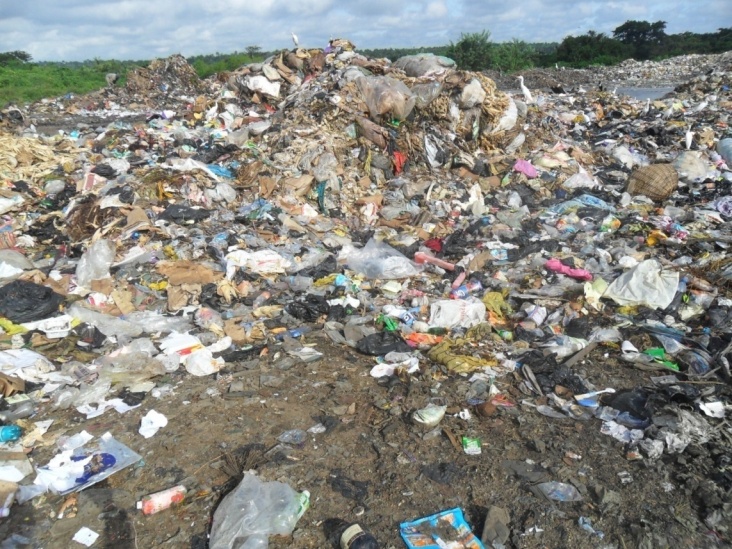 | Figure 2. General Overview of Lapite dumpsite |
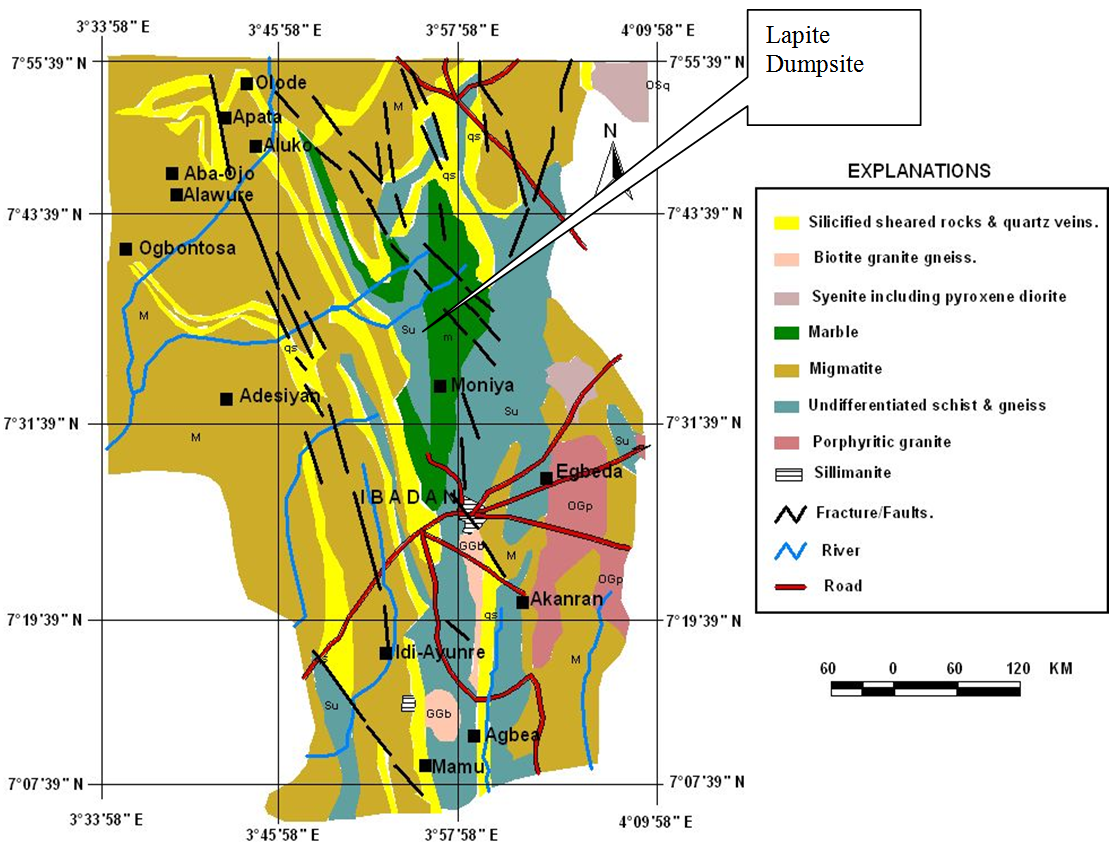 | Figure 3. Generalized geological map of Ibadan showing the Study Area |
2. Methodology
- A total of nine (9) electrical resistivity imaging traverses were measured using the Wenner Array configuration with the aid of Campus Tigre model resistivity meter. The electrode spacing for each traverse ranged from 5 to 25 m with a station interval of 5 m. All except traverse 9 runs in the N-S direction of the dumpsite. Traverses 1-9 of the 2D resistivity survey were mapped out within the dumpsite while control traverse was carried out at 300 m away from the dumpsite along Old Oyo Road. Resistivity measurement for the 2D resistivity profiles were acquired as shown in the data acquisition maps (Figure 4). For this survey, the tetrameter was set for four cycle stacking and the standard error of measurement of 5%. At each measurement, the resistivity meter displayed resistance value and the associated root mean square (RMS) error of the reading. The recorded resistance values were then used to compute apparent resistivity values. The 2D inverse resistivity models of the subsurface was obtained from the input resistivity data using inversion code of RES2DINV [16]; [17] while 3D inverse horizontal models of the subsurface was obtained from the inversion of 3D data set obtained from the ‘’collated 2D resistivity data sets’’ with the aid of RES3DINV computer program. RES2DINV and RES3DINV are inversion programs that automatically determines the 2D and 3D resistivity models of the subsurface from the input resistivity data using smoothness constrained least squares method [22].
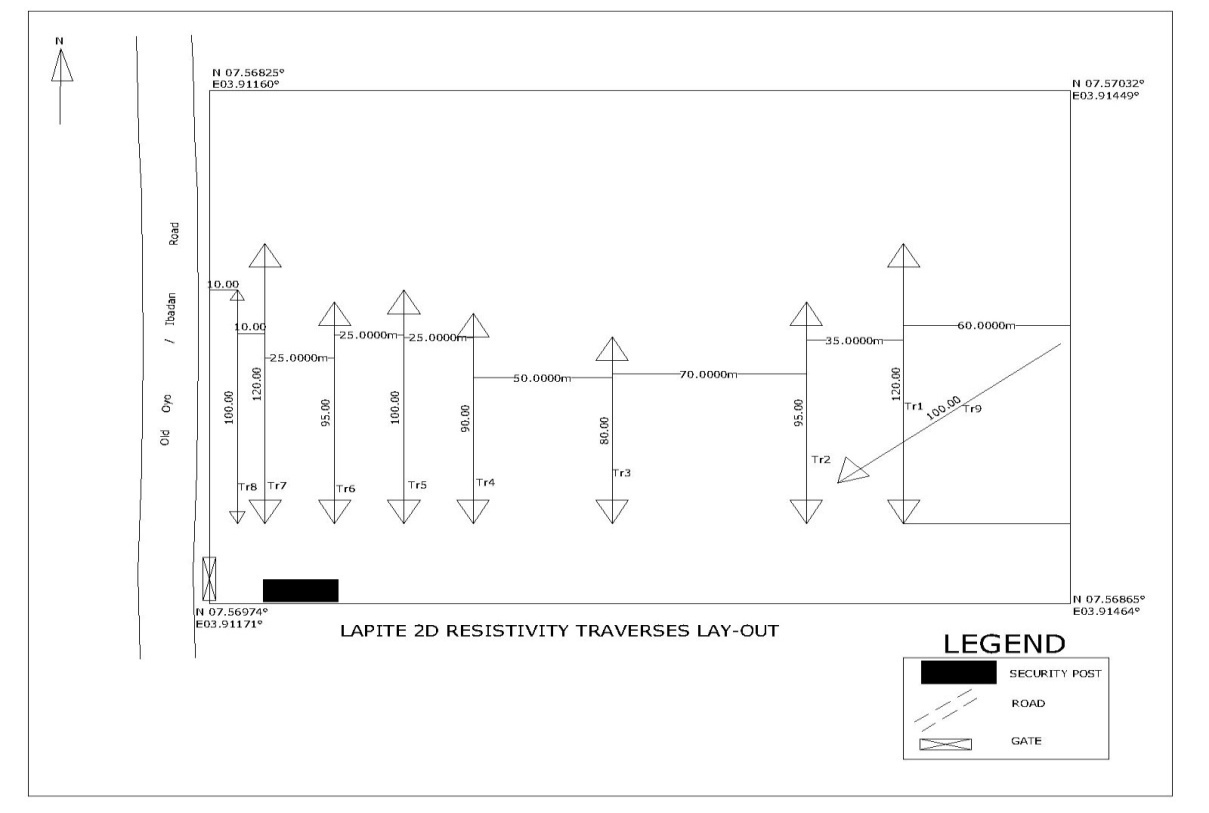 | Figure 4. Data Acquisition Map for electrical resistivity survey |
3. Results and Discussion
3.1. Interpretation of 2D Resistivity Traverses
- Figures 5-7 show the inverse model resistivity sections for all the traverses. As shown in Figure 5a, the resistivity model of traverse 1 shows three low resistivity anomalies at horizontal distance of 7-50 m, 55-75 m and 98-112 m with resistivity value less than 10 Ωm, an evidence of leachate plume accumulation. The area between 78-98 m along the profile has true resistivity values between 23-85 Ωm, an indication of clayey material. Figure 5b shows the model resistivity section for traverse 2. The northern end of the traverse up to a horizontal distance of 50 m shows resistivity values between 14-23 Ωm, an indication of clayey material while there is evidence of leachate plume up to 4 m depth with resistivity values below 10 Ωm at distance of 51-87 m along the southern end of the traverse. At deeper depth, the resistivity values are mostly greater than 200 Ωm suggesting weathered basement. Figure 5c showed inverse model resistivity section for Traverse 3. At horizontal distance of 7-28 m along the traverse, high resistivity anomaly with resistivity values between 35-118 Ωm associated with non-degradable waste material mixed with lateritic clay was observed. At horizontal distance 10-25 m at approximate depth of 4-9 m, there is evidence of low resistive region which could be clayey material. The southern end of the profile shows basement pluton at relatively shallow depth.
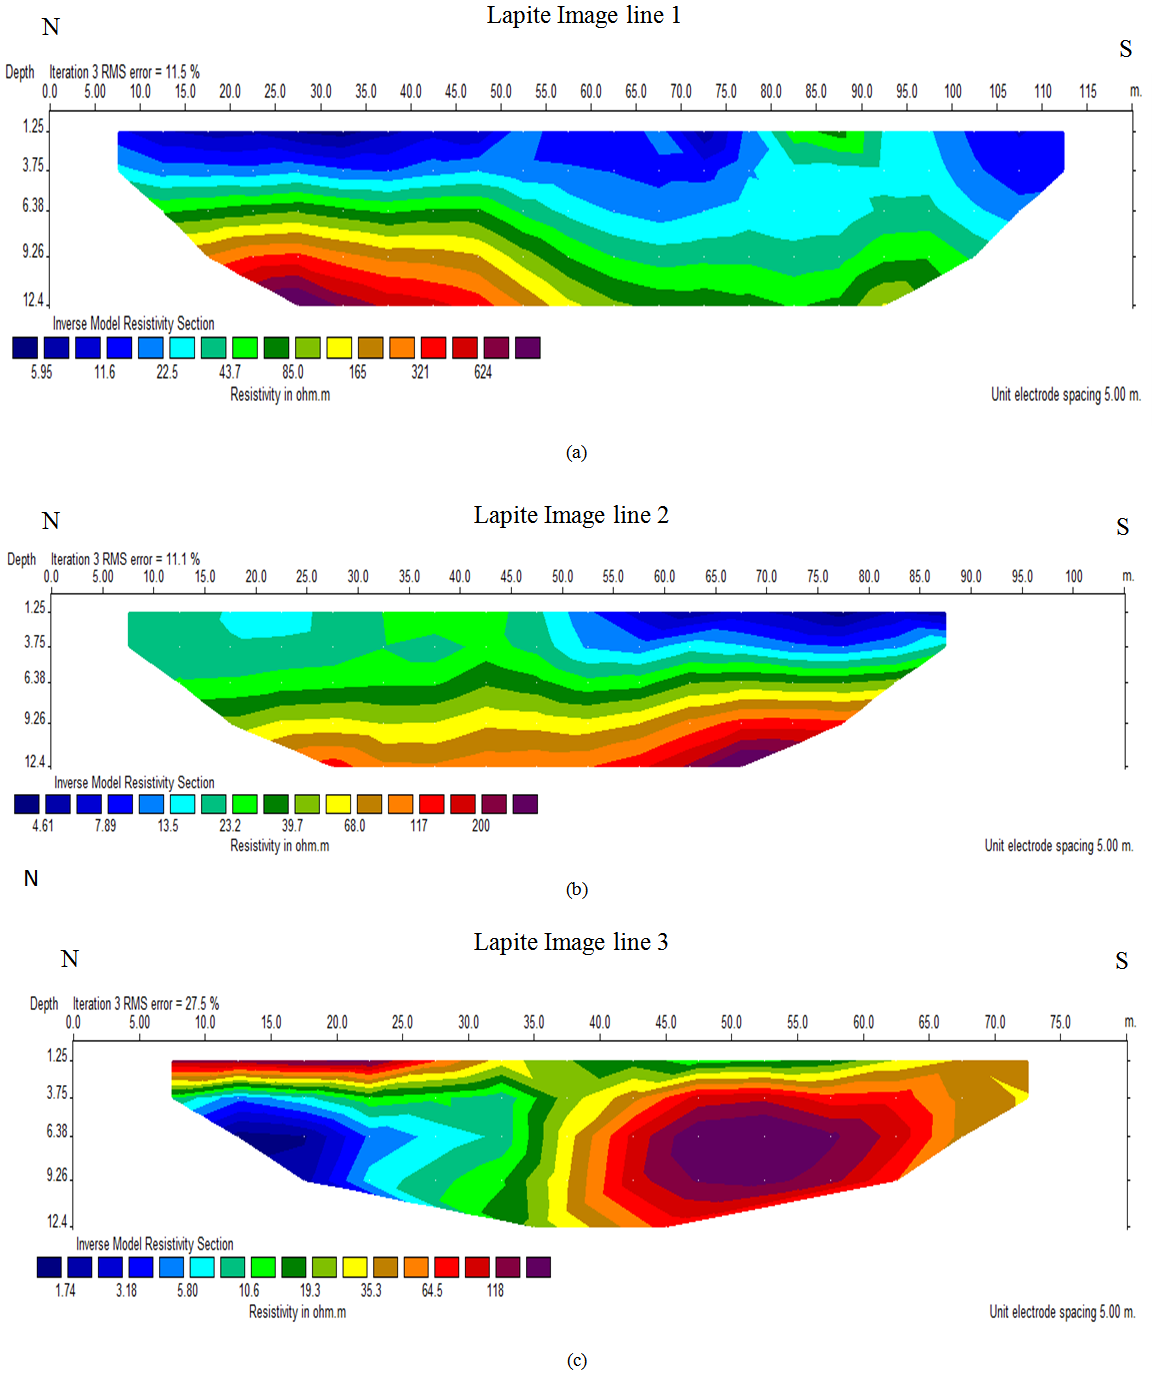 | Figure 5. 2D Inverse model resistivity sections for Lapite Traverses 1, 2 and 3 |
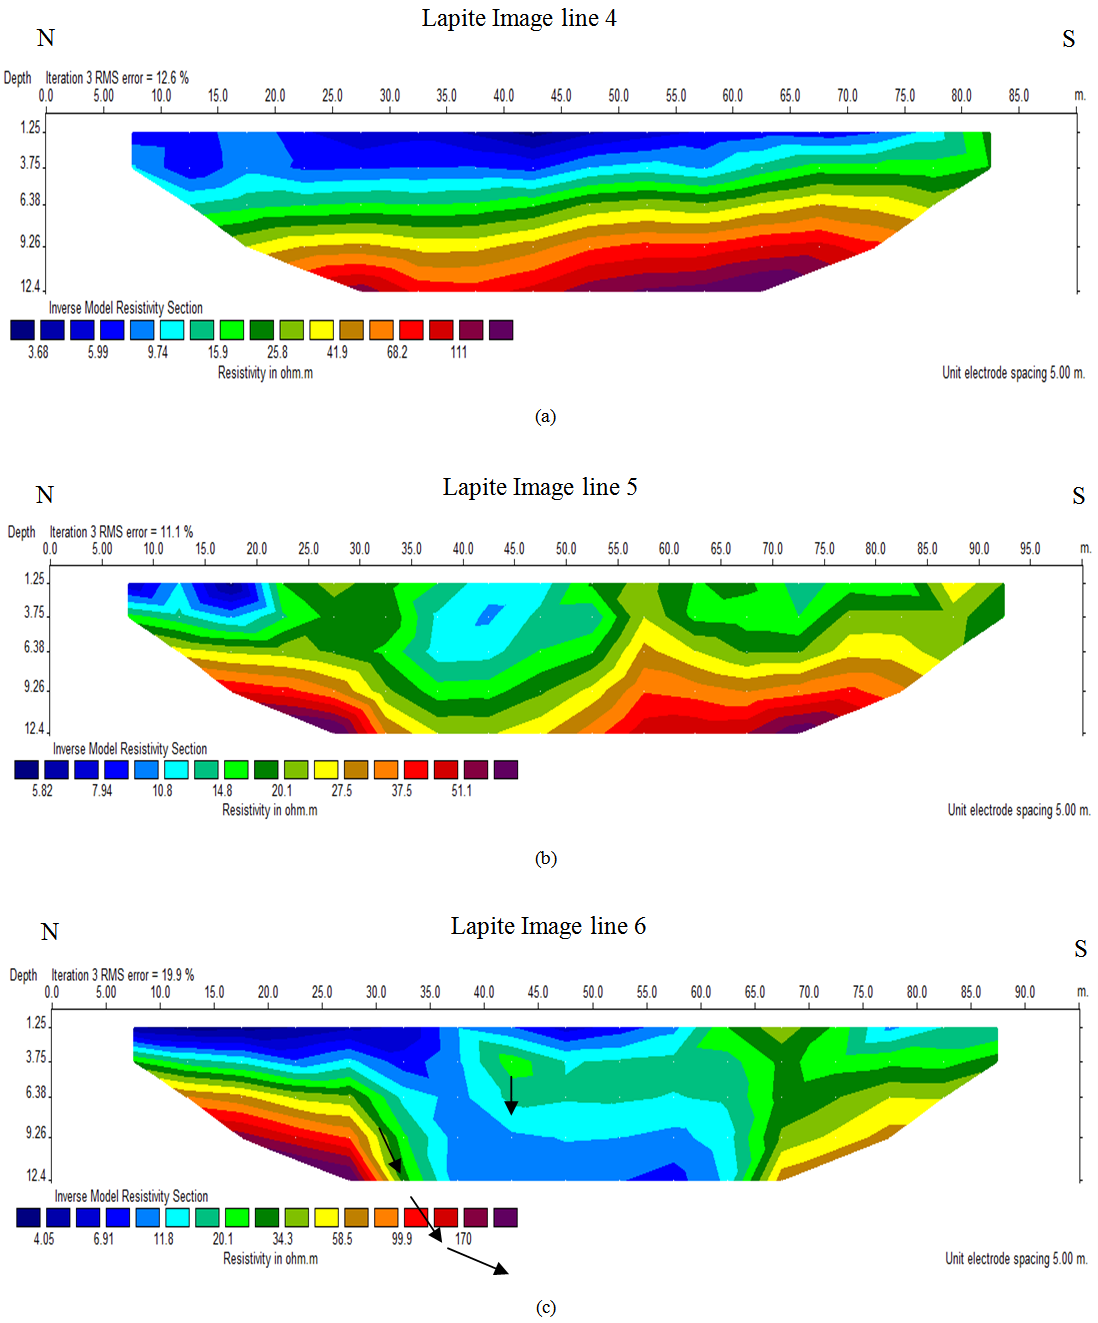 | Figure 6. 2D Inverse model resistivity sections for Lapite Traverses 4, 5 and 6 |
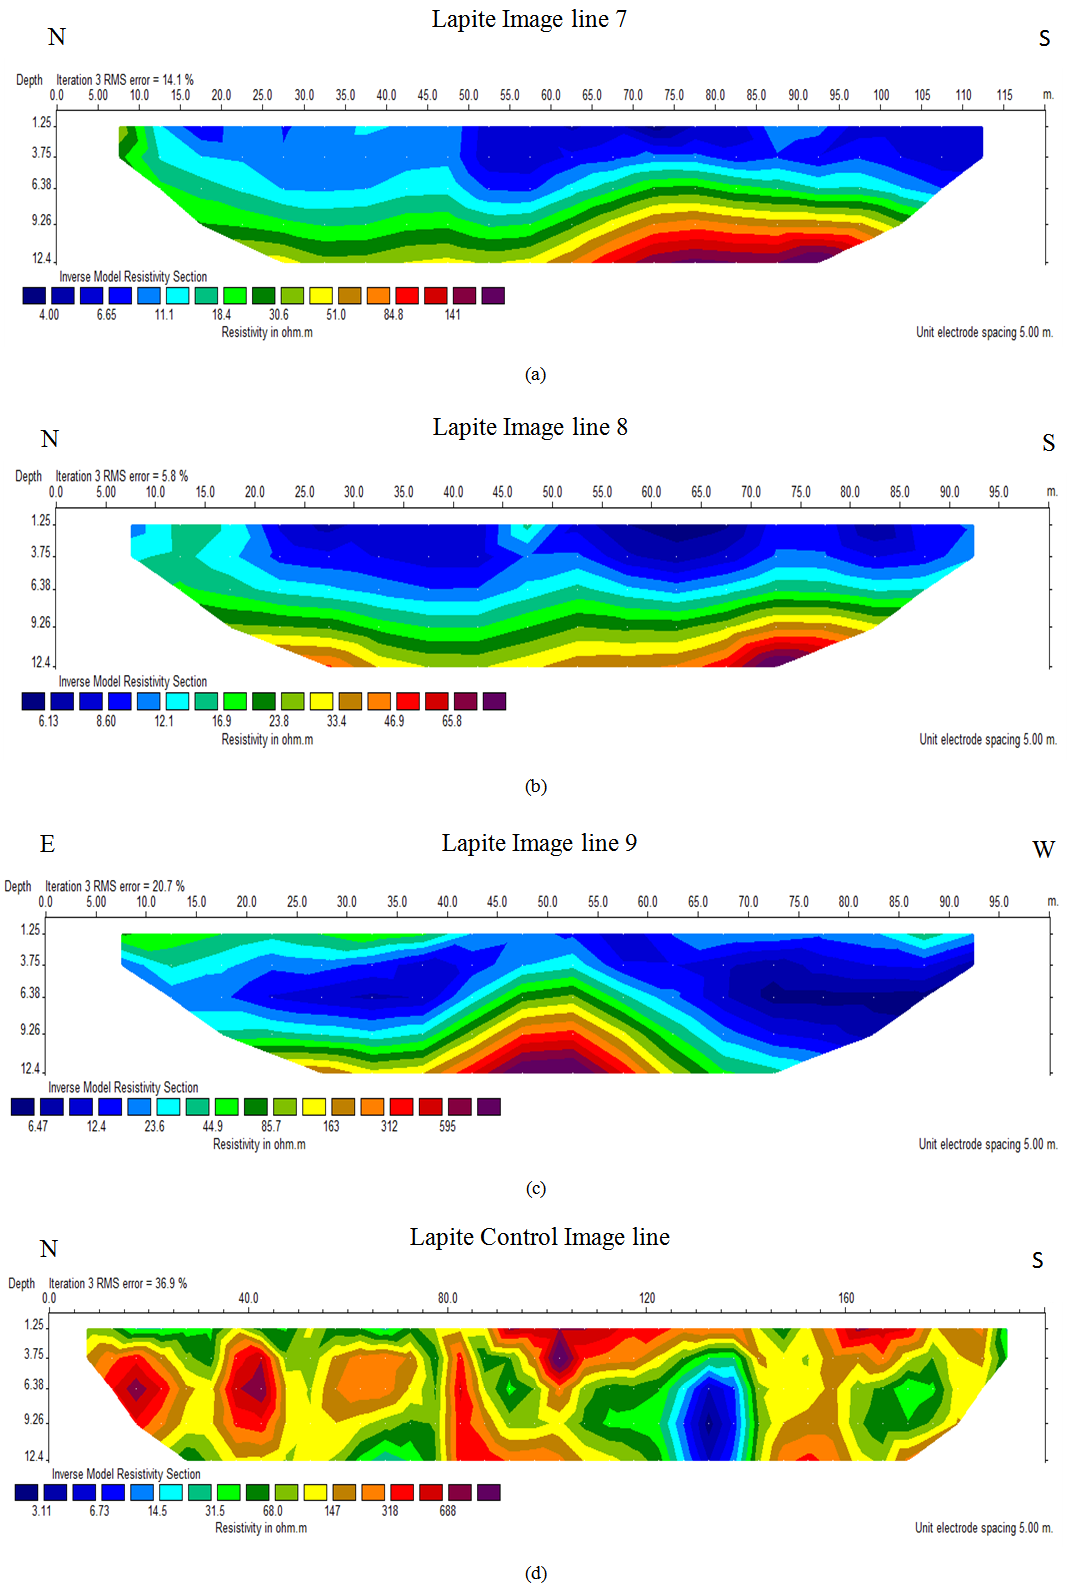 | Figure 7. 2D Inverse model resistivity sections for Lapite Traverses 7, 8, 9 and control |
3.2. Interpretation of 3D Inverse Model Resistivity Images
- Lapite Horizontal SectionSix sections were obtained as horizontal depth slices after inversion process with RES3DINV after 5 iterations. These section covers from the surface to the depth of 21.9m. As shown in the Figure 8a, from the surface to the depth of about 12.5m, resistivity changes from 2 - 334Ωm while from the depth of 12.5 – 21.9m, resistivity values changes from 19 - > 334Ωm. As section number 1, 2 and 3 show, blue layer which is of low resistivity (a mark of decomposed solid waste/leachate) can be recognized from the surface up to a depth of 12.5m. The first and second horizontal layers show complex subsurface which are more heterogeneous compared to the other layers (i.e layers 3, 4, 5 & 6). The heterogeneous nature of these two layers could be due to the effect of leachate from the dumpsites, non degradable solid waste and probably the removal of soil samples from one place to another at the dump site during moving of the wastes inward by tractor in order to accommodate more solid wastes being dumped at the site on a daily basis. Both layers 1 and 2 of about 5.3m depth indicate a subsurface that has combination of both low and high resistivity zones where the low resistive zones probably corresponds to leachate and some few areas being water logged. The high resistive zones could be weathered basement or non degradable wastes mixed with near surface dry soil. The layers 5 and 6 show an area of less complexity compared to the first two layers thereby depicting fresh basement rock.In the horizontal sections of the Lapite 3D imaging model, the resistivity values distribution ranges from a minimum of about 2 Ωm to a maximum of about 350Ωm. The effective depth of investigation as observed in the 3D inverse model is greater than 12.4m obtained in the 2D inversion of the collated profiles as shown in Figure 8a.
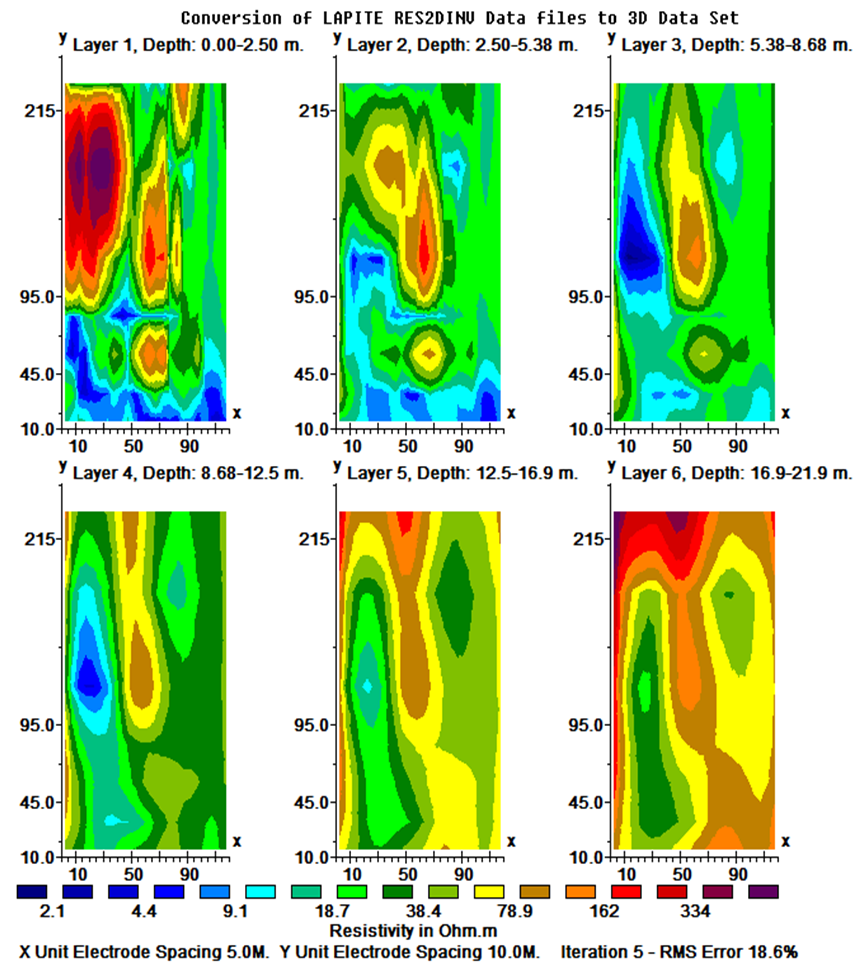 | Figure 8a. Horizontal depth slices obtained from the 3D inversion of orthogonal 2D profiles on Lapite dumpsite |
3.3. Lapite Vertical Section
- This section shows the resistivity model in the XZ plane i.e. X is traverse direction and Z is the depth. The vertical sections show the resistivity distribution in the XZ plane for the layers to a depth of more than >14.7 m. For Y = 10-20 m, there is a continuous region of low resistivity anomaly extending from horizontal distance of about 15 – 110m with resistivity values between 2 – 9 Ωm and extend up to a depth of 7.03 m. At plane 2 with Y distance of 20 – 45m, the plume has extend beyond 7.03 m deep and occurs at horizontal distance 10 – 60 m on the X axis. There is a vertical drop of low resistive layer from about 2 – 12m depth at horizontal distance 10 – 35 m at Y = 95 – 145m. This isolated low resistive region could be clay.For Y distance 215 – 250 m, there is no presence of low resistive region of less than 5Ωm in this plane showing that this plane shows absence of leachate plume. From the depth of about 10 m down to 14.7 m upward, bedrock layers and boundaries were distinctly marked. The XZ plane of Lapite dumpsite shows 7 planes with Y distance from 10 – 250 m and effective depth of investigation greater than >14.7m as shown in Figure 8b.
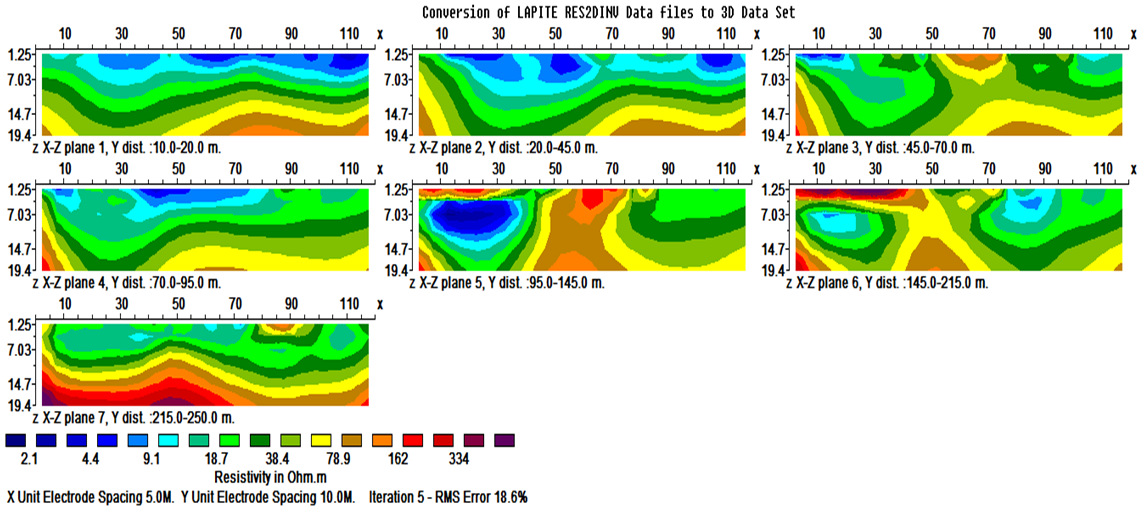 | Figure 8b. Extracted 2D images in X-Z plane from the 3D constrained inverse resistivity model at the location of 2D profile measured on Lapite dumpsite |
4. Effectiveness of Electrical Resistivity Imaging
- The results of geoelectrical imaging method through the inverse models revealed the true resistivity distribution of the subsurface and varying lithologies with depth. From the inversion results of traverses of 2D and 3D models of the subsurface, low resistivity bodies of less than 10 Ωm are evidence of leachate accumulation. The resistivities of the 2D inverse models of the subsurface vary from 2 to 624 Ωm while the resistivity distributions vary from 2 - 334 Ωm in the 3D inverse models. The resistivity values for the traverses ran within the dump site are mostly lower than values obtained at the control site especially at shallow depths. Thus, there is possible contamination of shallow groundwater system in the nearest future. The migration of leachate plume at Lapite dump site was traced in the form of low resistivity zones (with resistivity less than 10 Ωm). The leachate occurred as relatively continuous plumes while non-degraded refuse are imaged as isolated relatively high resistivity bodies. The results of the inverted models of the subsurface elucidated the effectiveness of 2D resistivity imaging methods in mapping the location and spatial distribution of leachate within the area.
5. Conclusions
- 2D resistivity imaging method was employed to investigate active dumpsite in southwestern part of Nigeria. The 2D resistivity imaging technique has been successfully used in mapping the contaminant leachate plume and to characterize the dumpsite in terms of subsurface resistivity distribution of leachate, waste material and soil condition beneath the dumpsite. The horizontal and vertical extent of leachate plumes were delineated by the geoelectrical imaging as a response of the varying electrical conductivity in the refuse dump site. There is possible contamination of shallow groundwater systems in the western part of the dumpsite in years to come due to migration depth of the leachate plume. The heterogeneous nature of the dumpsite and the complexity of its subsurface condition require that an effective remediation measures be put in place to reduce environmental hazards from the dumpsite. Furthermore, a multidisciplinary technique of hydrogeological, geochemical and geophysical techniques should be adopted on the dumpsite to be able to characterize it effectively.
 Abstract
 Reference
 Full-Text PDF
 Full-text HTML