Aniket Desai, D. Shanker, Ravi Sankar Jakka
Dept. of Earthquake Engineering, Indian Institute of Technology, Roorkee, India
Correspondence to: D. Shanker, Dept. of Earthquake Engineering, Indian Institute of Technology, Roorkee, India.
| Email: |  |
Copyright © 2015 Scientific & Academic Publishing. All Rights Reserved.
Abstract
Landslide is very common problem in the Himalayan region that is tectonically very active. Nainital’s geographic site (29°2' - 29°37' N and 78°51' - 79°59' E) and its condition allow for landslides to occur much more often than in any other region of the Himalaya. Being the youngest mountain system of the world, it constitutes a fragile network of unstable slopes with a major geo-hazard of landslides. Three major tectonic features (MCT, MBT and MFT) running all along the whole Himalayan belt are capable of generating major to large earthquakes in the region. Each type of landslide including earthquake induced landslide occurs in a particular suite of geologic environments. In addition to various static factors responsible for instability of slopes, earthquakes are to be considered as a major triggering factor for the occurrence of landslides and first time used in rating scheme for landslide hazard zonation in this region. To assess the potential landslide hazard distribution in the considered region, we have taken toposheet of the region as base map for delineation of the whole Nainital region into smaller areas (facets) and other based on the certain tectonic and geologic environments. An empirical method, which pays landslide hazard evaluation factor (LHEF) rating scheme has been applied in each facet. By calculating total estimated hazard (TEHD) facet-wise by adding ratings of all causative factors, landslide hazard zonation (LHZ) map is prepared. On the basis of TEHD, the LHZ map is divided into 5 categories, namely, very low hazard (VLH), low hazard (LH), moderate hazard (MH), high hazard (HH) and very high hazard (VHH) and presented in the final map.
Keywords:
Landslide hazard evaluation factor (LHEF), Main Central Thrust (MCT), Main Boundary Thrust (MBT) and Main Frontal Thrust (MFT)
Cite this paper: Aniket Desai, D. Shanker, Ravi Sankar Jakka, Earthquake Induced Landslide Hazard Zonation of Nainital Region, Geosciences, Vol. 5 No. 2, 2015, pp. 62-69. doi: 10.5923/j.geo.20150502.02.
1. Introduction
Landslide is a highly catastrophic natural hazard. It has the capacity to produce extremely devastating effects which may be in the form of damage to environment and wealth, loss of life or changes in landscape. Every year landslides lead to deaths of people in large number and huge loss of wealth especially in hilly areas across the globe. This makes it compulsory for us to have a proactive approach for the prevention from landslides rather than waiting for a disaster to occur (NDMA, 2009). In order to reduce the risk emanating from potential landslide, there is a need to prepare a comprehensive landslide hazard zonation (LHZ) map of the area for an effective and efficient disaster management. The concepts of landslide susceptibility and landslide susceptibility assessment have been introduced in the past couple of decades and various methodologies have been developed for evaluating the devastating power of landslides and its associated processes. Various hazard zonation studies have been implemented in the Himalayas earlier by performing data integration manually (e.g. Anbalagan 1992, Shanker 2002, Shanker and Singh 2003, Aniket et al, 2015). We can find the data pertaining to landslide hazard zonation of Nainital region in Anbalagan et al. (2008) and Gupta & Uniyal (2013). In our study, we have employed empirical method with the use of the software ArcGIS 10.2.2 for preparation of LHZ map of our study area.
2. Study Area
Nainital is situated between Lat: N29°2' - N29°37' and Long: E78°51' - E79°59'. It is situated in the Kumauni division of Uttarakhand state. It is located on a valley which runs from east to west. The debris of the surrounding hills creates gentle undulations continuously at the western end of the valley. The Naini Lake fills the eastern end of the valley. The Naini peak is on the boundary of Nainital city in north direction. Towards the eastern extremity, the Naini peak is continued by Alma peak and the Sher ka Danda. Nainital comes in the close vicinity of the Main Boundary Thrust (MBT). It is located in zone 4 of Earthquake Zoning Map of India, so the chances of occurrence of earthquake induced landslides are high. It comes in high hazard zone of landslide hazard zonation map of India prepared by Geological Survey of India (GSI). It has witnessed major landslides in 1867, 1880, 1888, 1898, 1924 and 1962 (DMMC, 2010). Large portion of Nainital is having forest area.
3. Methodology
In our study, we have implemented the methodology given by Anbalagan (1992) and IS 14496: Part 2 which employs landslide hazard evaluation factor (LHEF) rating scheme. We have identified 7 factors which can cause landslides. These factors are lithology, slope, aspect, relative relief, land cover, hydrogeological conditions and seismic factor. We have prepared thematic maps of these factors using Geological Survey of India toposheets and satellite imagery. Then we have assigned ratings to these factors depending upon the amount up to which they are responsible to induce a landslide. For assigning ratings, we have delineated 21-facets (Fig. 1) of the study area and given ratings to the causative factors for landslide hazard along with seismic characteristics of all the facets. To prepare the facet map of Nainital, we have considered the lithological map as the base map. After this, the ratings of all the factors have been added together which gives the value of total estimated hazard (TEHD). Based on the value of TEHD, we have classified our study area into different landslide hazard zones. Below I have shown the facet map of the study area.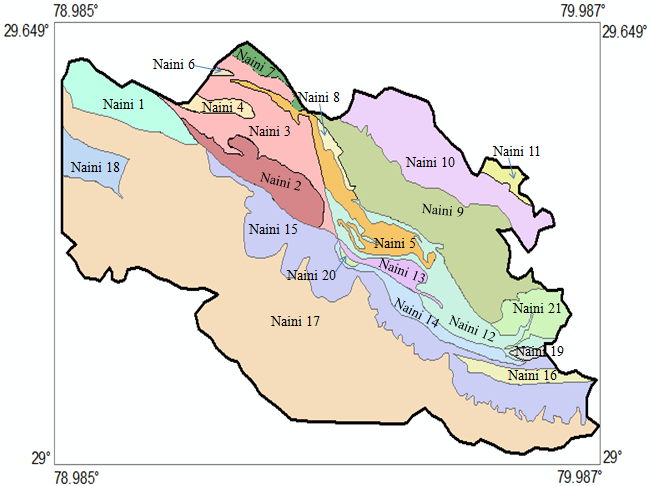 | Figure 1. Facet map of the study area |
4. Thematic Maps
4.1. Lithology
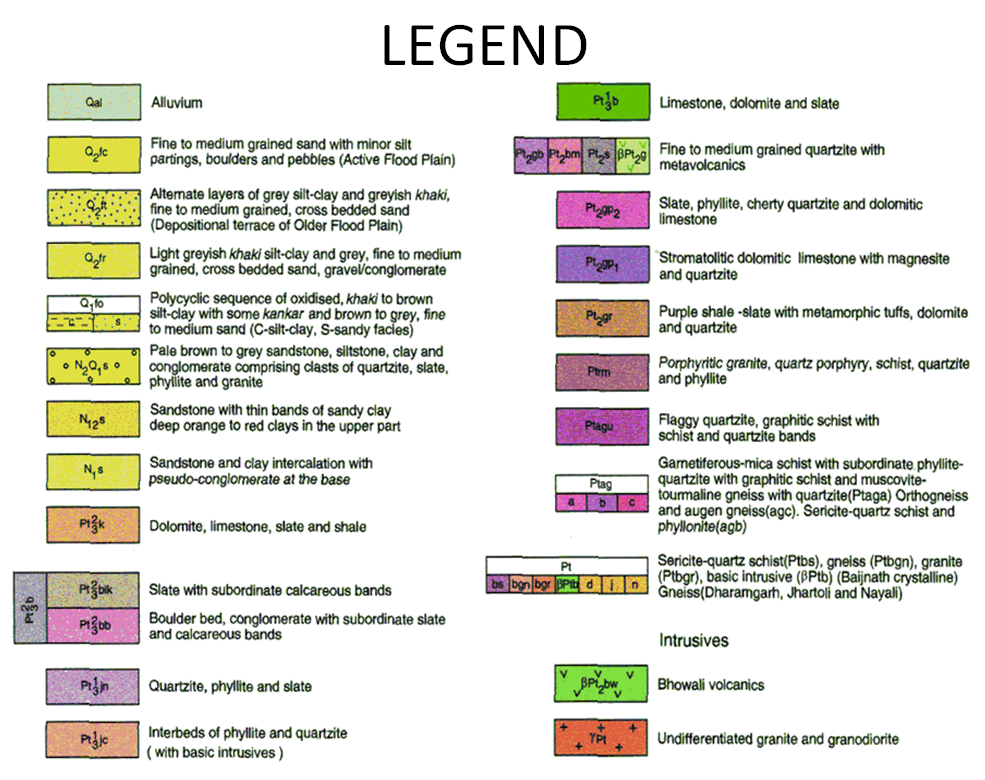
Following lithological map has been used for rating assignment based on rock type present in the considered area.In the study area, 7 types of rocks have been found, namely, quartzite, limestone, granite, sandstone, fine to medium grained sand, slate, phyllite and schist (Fig. 2). The ratings have been given to them as per IS code.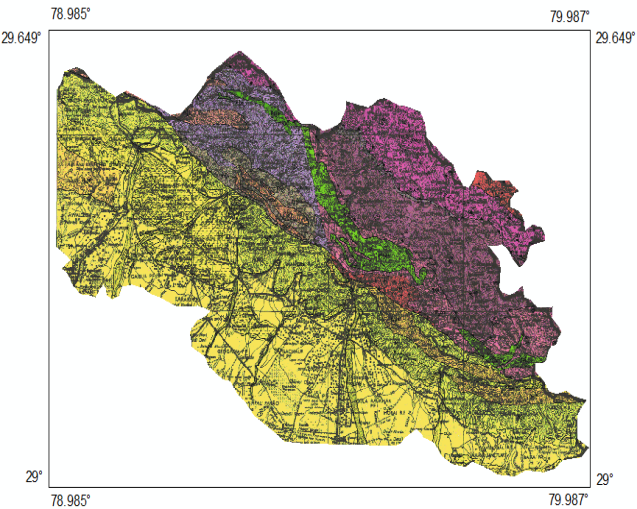 | Figure 2. Lithology map of the study area (Obtained from GSI) |
 | Chart 1 |
4.2. Slope
Following slope map (Fig. 3) has been used to calculate the rating based on the number of pixels present in each slope (degree) class. Average value of rating has been estimated for each and every facet depending on the number of pixels present in the facets.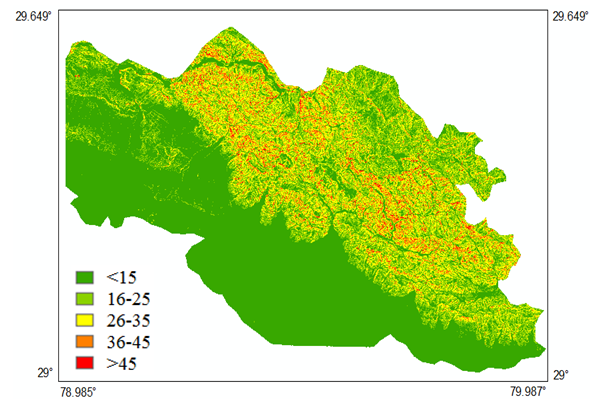 | Figure 3. Slope map of the study area |
4.3. Aspect
The aspect map (Fig. 4) describes the slope directions with respect to north from 0° to 360°. Slope aspect governs local atmospheric conditions, so it has important contribution in evaluation of stability of slopes. The aspect values have been classified into nine classes, namely, north (N), northeast (NE), east (E), southeast (SE), south (S), southwest (S), west (W), northwest (NW), north (N) and flat. To assign rating to each facet, the average value of rating has been assigned based on the number of pixels present in each class. 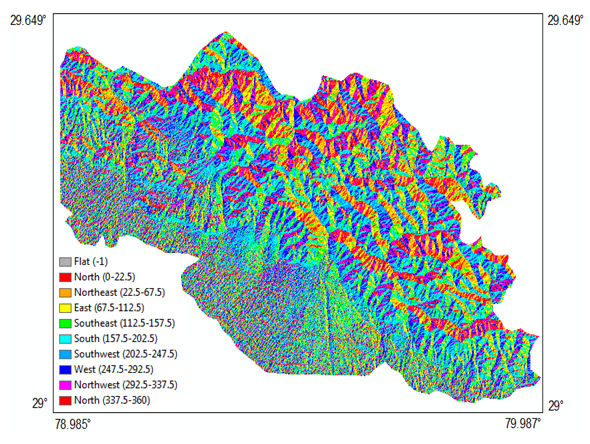 | Figure 4. Aspect map of the study area |
4.4. Relative Relief
Relative relief (Fig. 5) is also one of the causative factors for landslide, which could be used for the calculation of the rating assignment. As per IS code, we have obtained 3 classes of relative relief which are 0-100 m, 100-300 m and >300 m.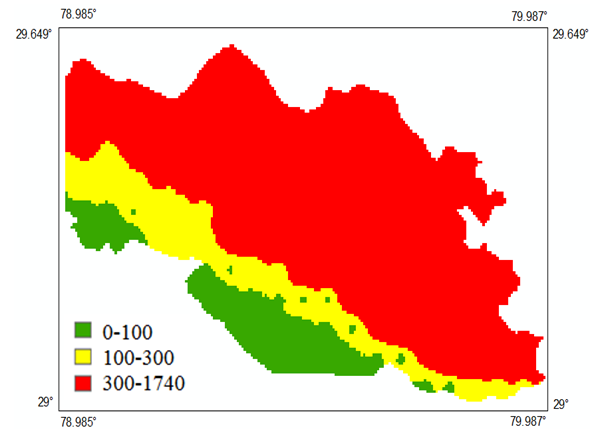 | Figure 5. Relative relief map of the study area |
4.5. Land Cover
Land cover is an important causative factor of landslide. Roots of trees bind the soil and hence prevent the occurrence of landslide. In addition to this, plants help in increasing shear strength by removing water from soil. As per IS code, we have divided the land cover map into 5 classes which are agricultural land, high vegetation, moderate vegetation, low vegetation and barren land (Fig. 6).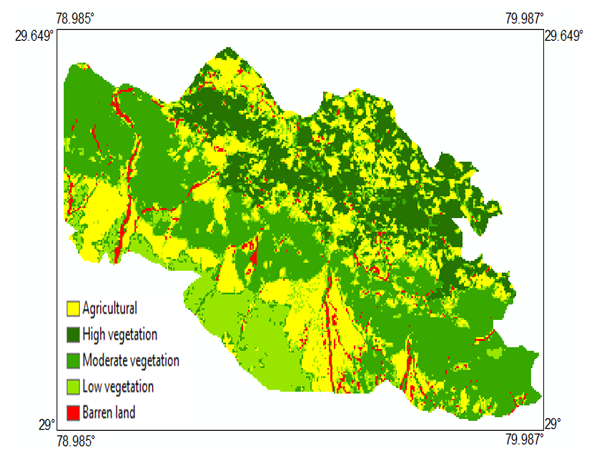 | Figure 6. Classified land cover map of the study area |
4.6. Hydrogeological Conditions
Hydrogeological condition of the area is also responsible for the occurrence of landslide. For the landslide hazard zonation map, we have taken hydrogeological map of the considered region taken by Central Ground Water Board (CGWB) shown below.From the above hydrogeological map (Fig. 7), 4 classes have been found based on the pixel colours count. 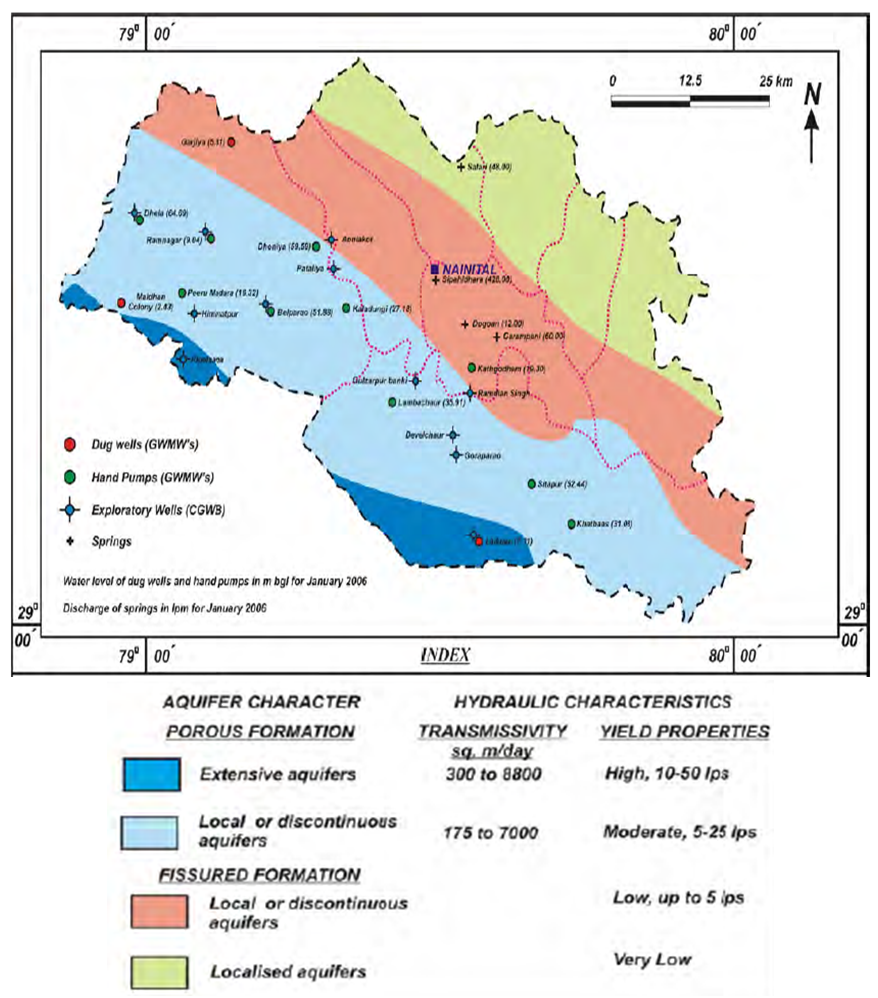 | Figure 7. Hydrogeological map of the study area (Central Ground Water Board) |
4.7. Seismic Factor
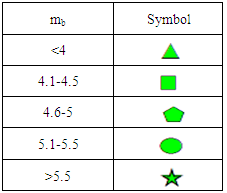
For landslide hazard zonation, seismic effect should also be counted and added in landslide hazard rating parameter calculations. To study the earthquake effect on landslide, we have considered ground motion i.e., peak ground acceleration (PGA). To calculate the PGA, the relation given by Sharma, 2000 has been used here.Log (A) = -1 .072 + 0.3903M - 1.21 log (X + e0.5873M )Where A = Peak ground horizontal acceleration, M = Surface wave magnitude and X = hypocentral distance from the source. Figure 7, represent the seismotectonic map of the of the considered area with earthquake epicenter plot from 1968 to 2009.Table 1. Symbols for different magnitudes (mb) of earthquakes
 |
| |
|
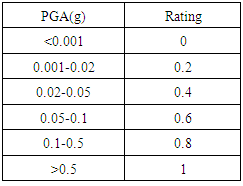
The classification of PGA values for ratings has been given below.Table 2. Classification of PGA values
 |
| |
|
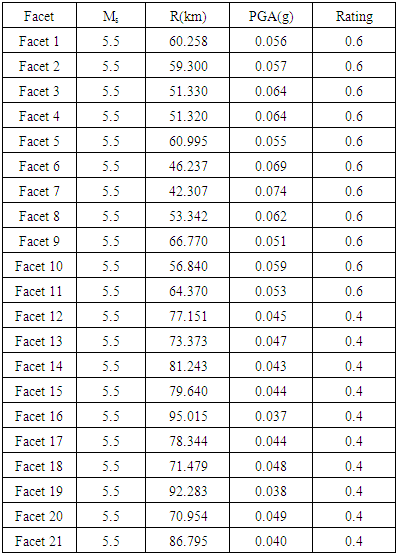
To include PGA in rating, we have classified the PGA values in 5 classes depending on the minimum damage to considerable damage at a place as defined in table 1. For calculation of PGA, we have taken maximum occurred earthquake magnitude Ms=5.5 in space and time domain considered. Taking this earthquake as a scenario earthquake in the study area and using relationship of Sharma, 2000, PGA value for each and every facet has been calculated. Ratings of these PGA values for each facet have been assigned based on the table 2. The PGA value and its rating for each and every facet have been given in table 3.Table 3. Effect of ground motion on landslide hazard
 |
| |
|
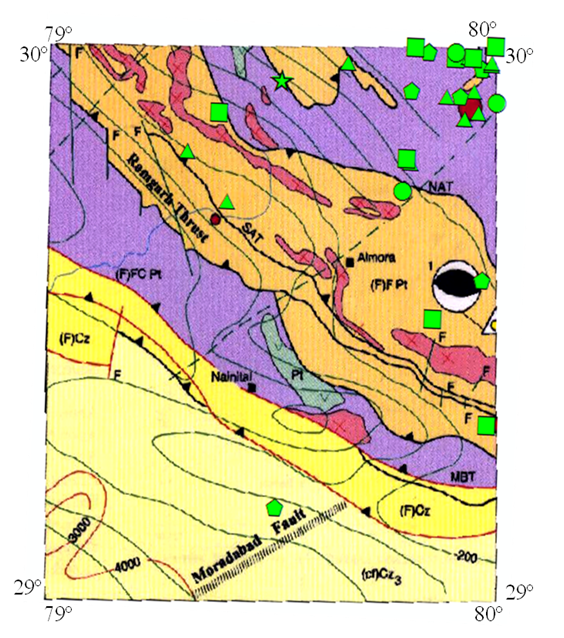 | Figure 8. Plot of earthquakes (1968 to 2009) with mb ≥ 3.5 in the study area. Symbol description is given in table 1 |
5. Results
All the causative factors’ ratings have been added, summarized and have been used for the preparation of final landslide hazard zonation map (Fig. 9). 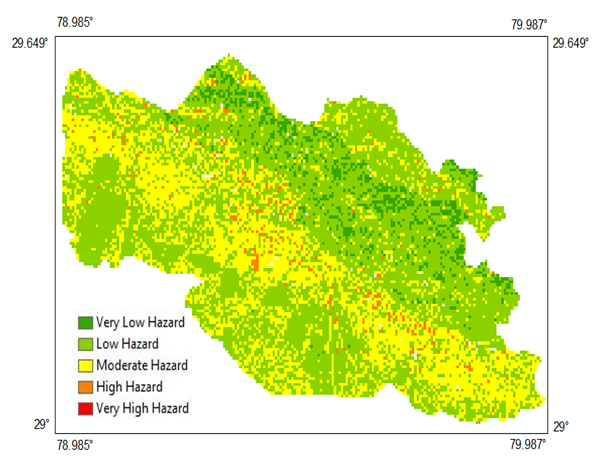 | Figure 9. LHZ map of the considered area (without seismic factor) (pixel wise) |
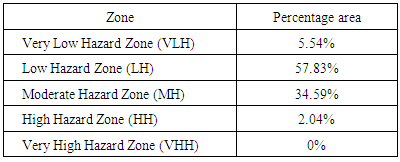
The above figure displays pixel-based distribution of various zones of landslide hazard without considering seismic factor. The distribution has been written percentage wise in table 4.Table 4. Distribution of different zones (without seismic factor) (pixel wise)
 |
| |
|
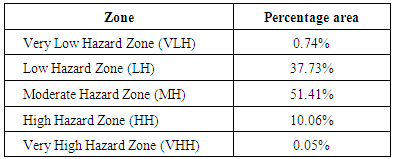
The figure 10, displays pixel-based distribution of various zones of landslide hazard considering seismic factor. The distribution can be written percentage wise as below: 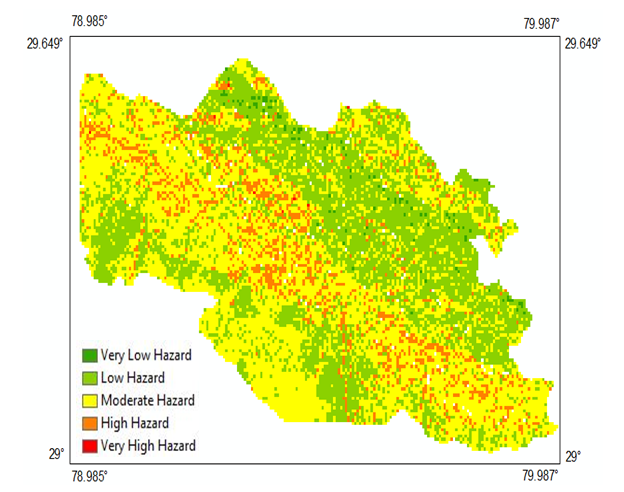 | Figure 10. LHZ map of considered area (with seismic factor) (pixel wise) |
Table 5. Distribution of different zones (with seismic factor) (pixel wise)
 |
| |
|
The above figure displays landslide hazard zonation map of considered area facet-wise without seismic factor. This map reveals two potential hazardous zones classification for all the 21- facets of different zones of landslide hazard and they can be summarized as below.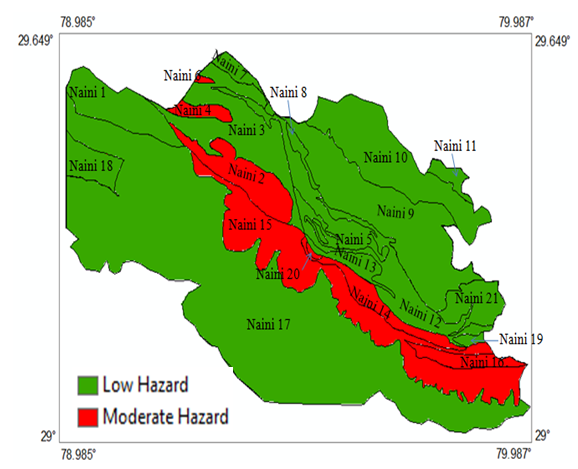 | Figure 11. LHZ map of the considered area (without seismic factor) (facet wise) |
Low Hazard Zone (LH): Naini 1, Naini 3, Naini 5, Naini 8, Naini 9, Naini 11, Naini 12, Naini 13, Naini 17, Naini 18, Naini 19 and Naini 21.Moderate Hazard Zone (MH): Naini 2, Naini 4, Naini 6, Naini 7, Naini 10, Naini 14, Naini 15, Naini 16 and Naini 20.The figure 12, displays landslide hazard zonation map of considered area facet-wise with seismic factor. This map reveals three potential hazardous zones classification for all the 21- facets of different zones of landslide hazard and they can be summarized as below:Low Hazard Zone (LH): Naini 3, Naini 5, Naini 8, Naini 9, Naini 11, Naini 12, Naini 13, Naini 18, Naini 19 and Naini 21.Moderate Hazard Zone (MH): Naini 1, Naini 2, Naini 4, Naini 7, Naini 10, Naini 14, Naini 15, Naini 16, Naini 17 and Naini 20.High Hazard Zone (HH): Naini 6.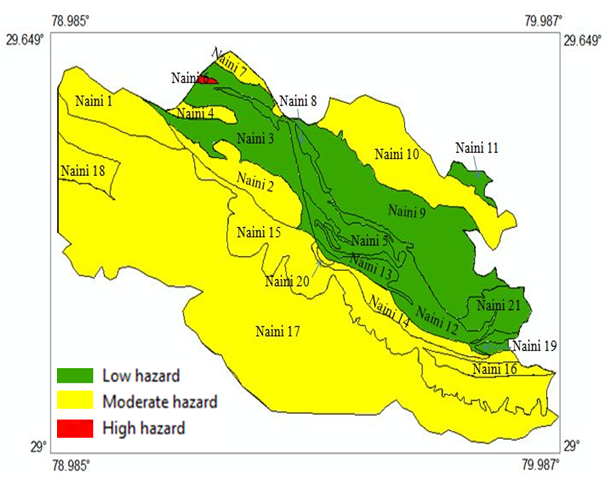 | Figure 12. LHZ map of considered area (with seismic factor) (facet wise) |
6. Conclusions
Study reveals that out of total identified 21 facets, 10 facets fall in low hazard zone, 10 facets fall in moderate hazard zone and 1 facet falls in high hazard zone. Also, in comparison with the LHZ map without seismic factor, in the LHZ map with seismic factor, we can observe that the areas coming under very low hazard zone (VLH) and low hazard zone (LH) have decreased and the areas coming under moderate hazard zone (MH), high hazard zone (HH) and very high hazard zone (VHH) have increased. For the purpose of carrying out developmental activities, VLH and LH zones are usually safe. The areas of under MH zones may contain local sectors of instabilities which can become susceptible to landslides which may warrant certain risk. The areas under HH and VHH zones should generally be avoided for the purpose of construction activities. If it is not possible to avoid it, then suitable precaution measures should be taken recommended by the authorities and experts in the concerned field and detailed assessment of the area on the scale of 1:1000 to 1:2000 should be implemented to check the slope stability and other parameters susceptible to landslide. This study may supplement mitigation steps to diminish geo-environmental hazards.
ACKNOWLEDGEMENTS
This is the part of the M. Tech thesis research work. We are thankful to all authors whose papers have been used for help to prepare the manuscript meaningfully. Department of Earthquake Engineering is gratefully acknowledged for providing excellent computational facilities and student support for conducting the work.
References
| [1] | Anbalagan R. (1992), “Landslide Hazard Evaluation and Zonation Mapping in Mountainous Terrain”, Eng. Geol., 32: 269-277. |
| [2] | Aniket Desai, D. Shanker and Ravi S. Jakka (2015). Earthquake induced landslide hazard zonation of Nainital region. Journal of Nepal Geological Society, Volume 48, Special issue, April 2015, abstract volume Seventh Nepal Geological Congress (ngc-vii) April 7-9, 2015. |
| [3] | BIS (1998). Bureau of Indian Standards. Preparation of Landslide Hazard Zonation Maps in Mountainous Terrains-Guidelines Part 2: Macro-zonation. Standard IS 14496 (Part 2): 1998. New Delhi, India. |
| [4] | Gupta P., Uniyal S. (2013), “LHZ Mapping of the Area around Nainital using Bivairiate Statistical Analysis”, International Journal of Advanced Technology and Engineering Research, Volume 3, Issue 1. |
| [5] | “National Disaster Management Guidelines—Management of Landslides and Snow Avalanches”. National Disaster Management Authority, Government of India. June 2009, New Delhi. |
| [6] | Shanker D., Singh B. (2003), “Earthquake Generated Landslide Hazard Problems in Himalaya-A Hazard Zonation thereof”, 20th Pacific Science Congress, March 17-21, Bangkok, Thailand. |
| [7] | Shanker, D. (2002). Earthquake triggered landslides and geological approach for landslide hazard zonation in Himalayan region. Symposium on Seismology Earthquake Hazard Assessment and risk management, in Conjuction with 4th Asian Seismological Commission ASC-2002, 24-26, November, 2002, Kathmandu, Nepal. PP.45. |
| [8] | Sharma M. L. (2000), “Attenuation Relationship for Estimation of Peak Ground Vertical Acceleration using Data from Strong Motion Arrays in India”, 12th World Conference on Earthquake Engineering, Auckland, New Zealand. |
| [9] | “Structural Vulnerability: Tale of Two Townships of Uttarakhand (Case Study of Nainital and Bageshwar)”, Disaster Mitigation and Management Centre, Dehradun, 2010. |
 Abstract
 Reference
 Full-Text PDF
 Full-text HTML