-
Paper Information
- Paper Submission
-
Journal Information
- About This Journal
- Editorial Board
- Current Issue
- Archive
- Author Guidelines
- Contact Us
Geosciences
p-ISSN: 2163-1697 e-ISSN: 2163-1719
2015; 5(2): 53-61
doi:10.5923/j.geo.20150502.01
Experimental Modeling and Measuring Stresses and Strains during Arching Phenomenon
 Abstract
 Reference
 Full-Text PDF
 Full-text HTML
Gholam Moradi, Masoud Hajialilue Bonab, Alireza Abbasnejad
Department of Geotechnical Engineering, University of Tabriz, Tabriz, Iran
Correspondence to: Alireza Abbasnejad, Department of Geotechnical Engineering, University of Tabriz, Tabriz, Iran.
| Email: |  |
Copyright © 2015 Scientific & Academic Publishing. All Rights Reserved.
In the current paper an experimental Modeling for studying the arching effect over a trapdoor in the sand is presented. To simulate this phenomenon, a well instrumented apparatus is used. In this research plain strain behavior and 2D modeling for fine sand has been selected. For this the thickness of apparatus container is 40 cm. The apparatus comprises concentric rectangular trapdoors with different width that can yield downward or upward while the stresses and deformations of the trapdoor are recorded simultaneously. To measure the changes in stress in the sand mass, circular minatory stress gouges with 14mm diameter has been made and used. To calibrate the stress gauges Hg column over a flexible membrane that can transfer the Hg load to the gauge surface is used. To obtain the strain and deformations of the sand mass Particle Image Velocimetry (PIV) method has been used. According to the experiments, during arching effect, four zones in sand mass are obvious.
Keywords: Arching effect, Physical modeling, Earth stress sensors, PIV method
Cite this paper: Gholam Moradi, Masoud Hajialilue Bonab, Alireza Abbasnejad, Experimental Modeling and Measuring Stresses and Strains during Arching Phenomenon, Geosciences, Vol. 5 No. 2, 2015, pp. 53-61. doi: 10.5923/j.geo.20150502.01.
Article Outline
1. Introduction
- The arching phenomenon is known to engineers as the reduction of stress experienced due to yielding underground structure. Arching plays an important role in the structure-soil interaction, such as: excavation, retaining structures, pile group effects, tunnel boring machines, culverts and various underground facilities. When part of a soil mass yields, while other parts adjoining the yielding part remain stationary, the movement between yielding and stationary parts causes shear stress to develop. This shear stress opposes the relative movement of soil masses. Since the shearing resistance tends to keep the yielding mass in its initial position, it reduces the pressure on the yielding part and increases it on the adjoining stationary part. The essential features of arching were demonstrated by experiments on the sand with a yielding trapdoor performed by Terzaghi. The shear plane theory was subsequently proposed by him in 1943. The analysis involved studying the equilibrium horizontal element of soil, assuming that the soil has perfectly plastic behavior [1]. Later, experimental modeling the soil arching as the transfer of soil pressure from a yielding support to an adjacent non-yielding support, was done by several researches such as Liam Finn [2]; Getzler et al. [3]; Ladanyi et al. [4]; Burghignoli [5]; Vardoulakis et al. [6]; Otani et al. [7]; Sadrekarimi and Abbasnejad [8].Experiments of Pardo and Sáez [9] were based on Terzaghi’s trapdoor test. The displacement field of the soil is estimated using the Digital Image Correlation (DIC) technique. In their numerical study two elasto-plastic constitutive models of increasing complexity were compared and examined for their ability to reproduce this phenomenon. Yul Kim et al. [10] studied the lateral earth pressure of vertical circular shaft. They introduced a framework for determining the earth pressure distribution on the basis of both centrifuge model and full-scale field test results. They found that the lateral earth pressure acting on a vertical circular shaft considering arching effect is 80% smaller than that calculated by Rankine theory. Hosseinian and Cheraghi Seifabad [11] investigated arching effect of retained structure with anchorage method, Plaxis 3D Tunnel software was used to model fine-grain (CL-ML) with hardening soil behavior which simulates soil material. A comparison between the results gained from the 3D FE analyses and the more or less conventional method shows that the classical method is much more on the safe side. Dalvi and Pise [12] investigated arching action considering passive earth pressure in non-cohesive backfill. The backfill was assumed to move upward in a form of catenary arch due to arching. An illustrative example was solved to show the effect of the angle of the major principal plane on earth pressure distribution on retaining wall considering arching for different wall friction angles and soil friction angles and applicability of proposed formulation is compared with model test results.
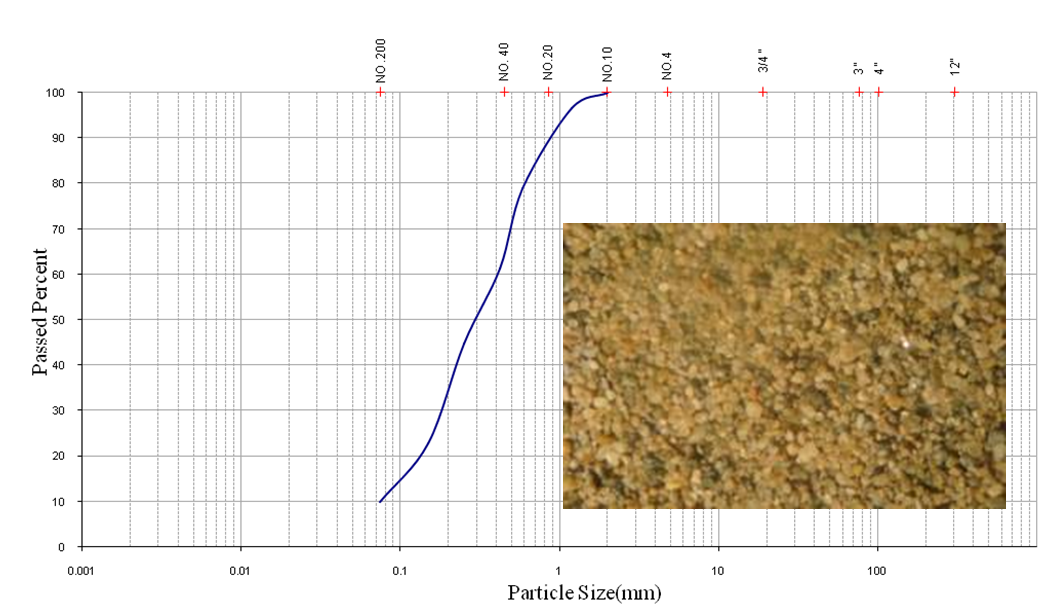 | Figure 1. Sieve analysis of the test soil |
2. Soil Properties
- The test soil was a cohesionless silty sand with passed a percentage of 100% and 9% from sieves No. 10 and No. 200, respectively. The gradation curve coefficient of curvature Cc and coefficient of uniformity Cu were 1.1 and 5.3. The sieve test result is illustrated in Figure 2. The specific gravity of solid particles was 2.61 and the moisture content was kept at 3% throughout the experiments. The soil was classified as SP-SM according to USCS. The maximum and minimum dry densities were measured as 16.77 and 12.26 kN/m3, respectively.
3. Physical Modeling
- An apparatus was designed and constructed. The whole system is schematically shown in Figure 2. The sand container was 0.966 m3 in volume and 1.25 cm in height with a rectangular horizontal cross section with 0.4m in width and 1.83 m in length. The container was made of 10 mm thick steel plate and 30 mm thick plaxy glass in both sides to observe the soil that strengthened with stiffeners. Four concentric rectangular trapdoors with were 10, 20, 30 and 35 cm in width is constructed that can be installed under the base of the container, as shown in Figures 2 and 3. The trapdoors are installed separately moving the adjoining plates sideward. The trapdoor yields downward by a hydraulic jack installed bellow. The load magnitudes on the trapdoors, caused by the pressure of the overburden soil, were measured using a load cell. The displacement of the trapdoors was monitored using Linear Variable Deferential Transformer (LVDT) installed under the platform and over the soil surface as shown in Figure 4. A hydraulic jack is installed above the system to provide the surcharge pressure. The applied load from the hydraulic jack is controlled by an automatic system so that a defined constant pressure could be applied to the surface of the sand. The system holds the pressure in the defied value during the test. To fill the container with uniform density a sand rain system is constructed. This system can be installed in the apparatus as illustrated in Figure 3.
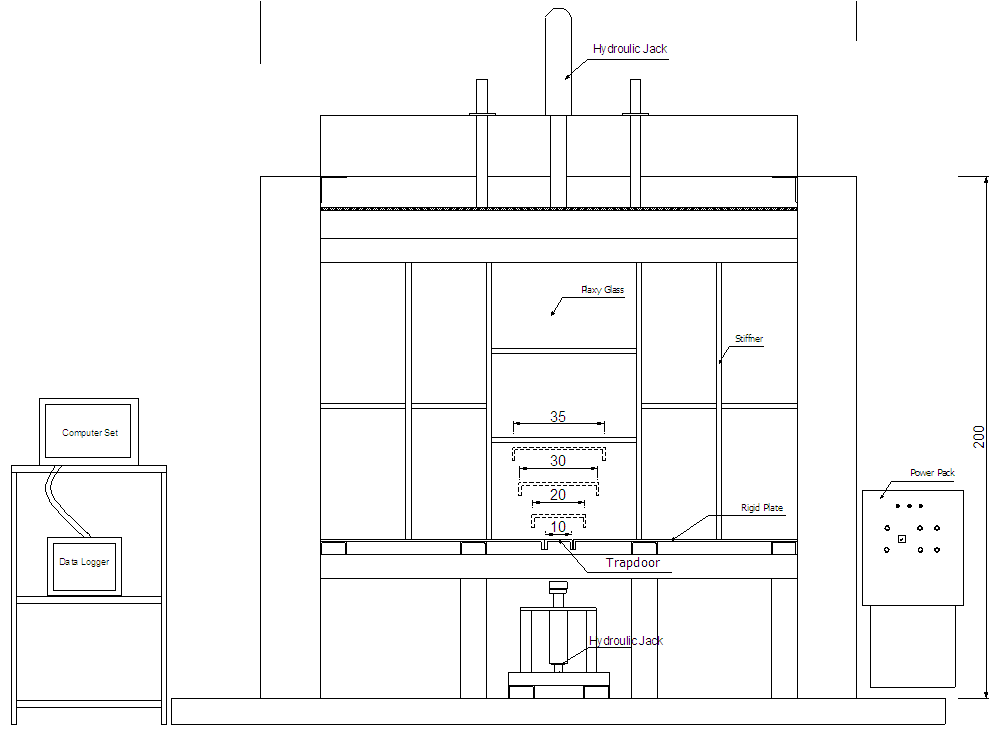 | Figure 2. Schematic diagrams of the apparatus |
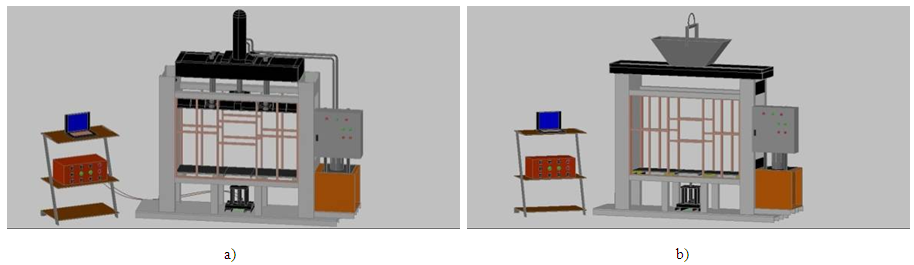 | Figure 3. a) 3D view of the test apparatus with loading system; b) 3D view of the test apparatus with sandstrain system |
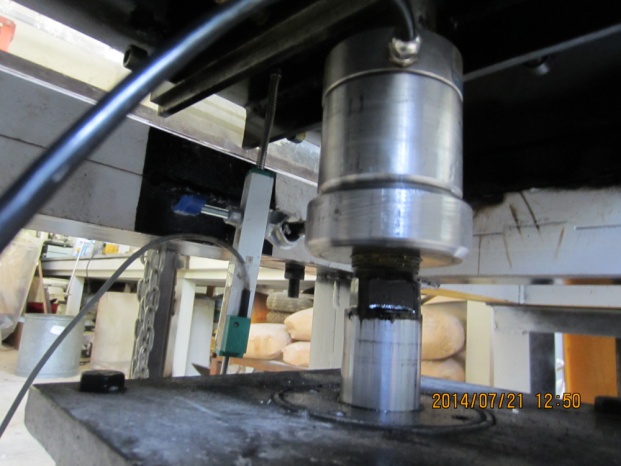 | Figure 4. Load cell and displacement gauge (LVDT) |
4. Stress Measurement
- Stresses are measured using stress sensors that designed and constructed for this research. These sensors are 14 mm diameter and 10 mm height and are installed upon the trapdoor and also on the stationary adjacent part (Figure 5). These sensors are calibrated using the Hg column. The calibration set up is shown and the flexible membrane that used under the pipe is shown in Figure 6.
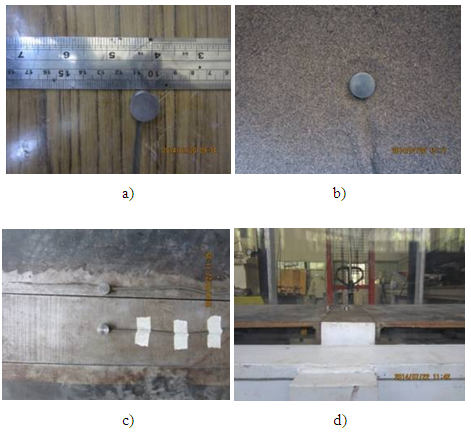 | Figure 5. a) Dimension and view of stress sensor; b) sensor view in soil mass; c, d) Installation of the sensors |
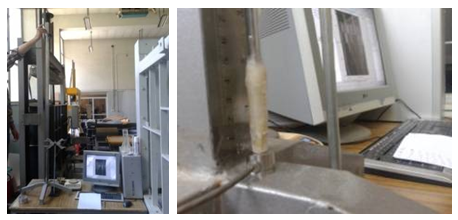 | Figure 6. Calibrating the stress sensors |
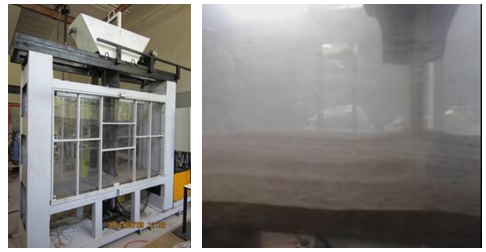
5. Sand Rain System
- To fill the container a sand rain system was used so that the sand is guided thorough a flexible pipe to the surface of the sand mass and then release toward the surface. In this method the releasing distance of the sand in contain constant through the container filling and the sand density could be uniform during the container height (Figure 7). The sand rain system box is capable of moving with an adjustable desired constant value for speed.In order to obtain the sand density 2 methods have been applied and the average value of the results of the two method have been chosen.1. Weighting sand pouring in the box and dividing it on the volume of the box to obtain the density.2. Placement of a container with a specific volume value in different partsc and levels of the box and wheighting them after the test.
 | Figure 7. Sandrain system |
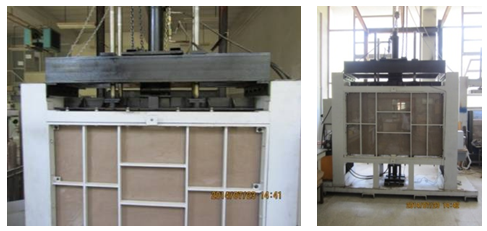
6. Surcharge Loading Jack
- To apply the surcharge load a hydraulic jack with a rigid pressure plate is installed above the apparatus after removing the sand rain system. The applied pressure is set to a determined value and the system can contain the pressure in the constant value during the test. In Figure 8 the loading system and rigid plate is illustrated.
 | Figure 8. Loading Jack to apply surcharge |
7. Strains and Deformations Measurement
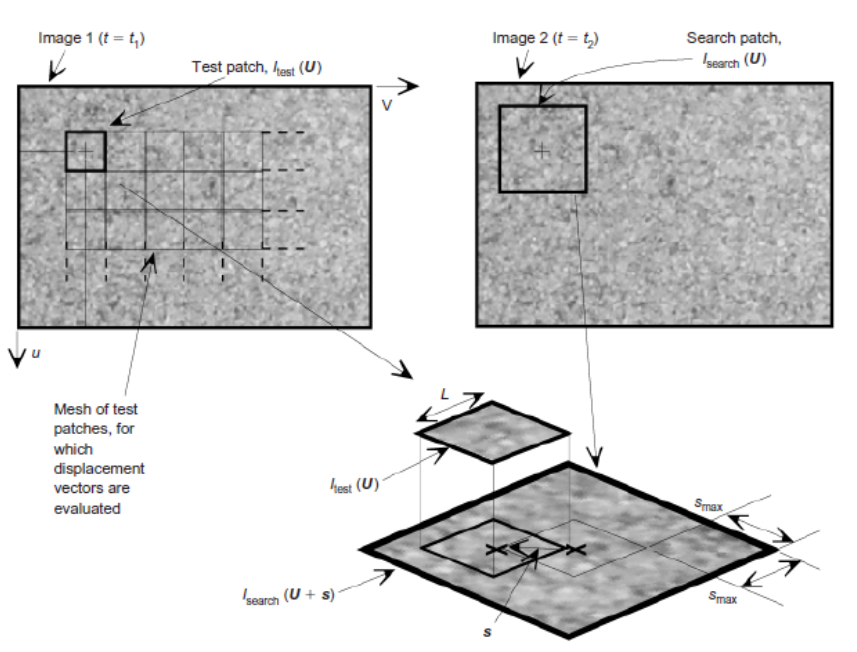
- Various images-based techniques have been used to measure planar deformation fields in geotechnical element and model tests. These include X-ray [32, 33] and stereo-photogrammetric methods [34, 35]. More recently, the use of computer-based image processing techniques has led to the development of automatic target tracking systems [36, 37].PIV is a velocity-measuring technique that was originally developed in the field of experimental fluid mechanics [38]. The technique was originally implemented using double-flash photography of a seeded flow. The resulting photographs contain image pairs of each seed particle. For PIV analysis, the photograph is divided into a grid of test patches. The displacement vector of each patch during the interval between the flashes is found by locating the peak of the autocorrelation function of each patch. The peak in the autocorrelation function indicates that the two images of each seeding particle captured during the flashes are overlying each other. The correlation offset is equal to the displacement vector.A modified approach has been used to implement PIV in geotechnical testing. Whereas fluid requires seeding with particles to create features upon which image processing can operate, natural sand has its own texture in the form of different-coloured grains and the light and shadow formed between adjacent grains when illuminated. Texture can be added to an exposed plane of clay by the addition of coloured ‘flock’ material or dyed sand. The image processing conducted during PIV to measure the displacement between a pair of digital images is shown schematically in Figure 9 [39].In this research for measuring the strains and deformations of the sand particles the Particle Image Velocimetry (PIV) method is used.
8. Test Procedure
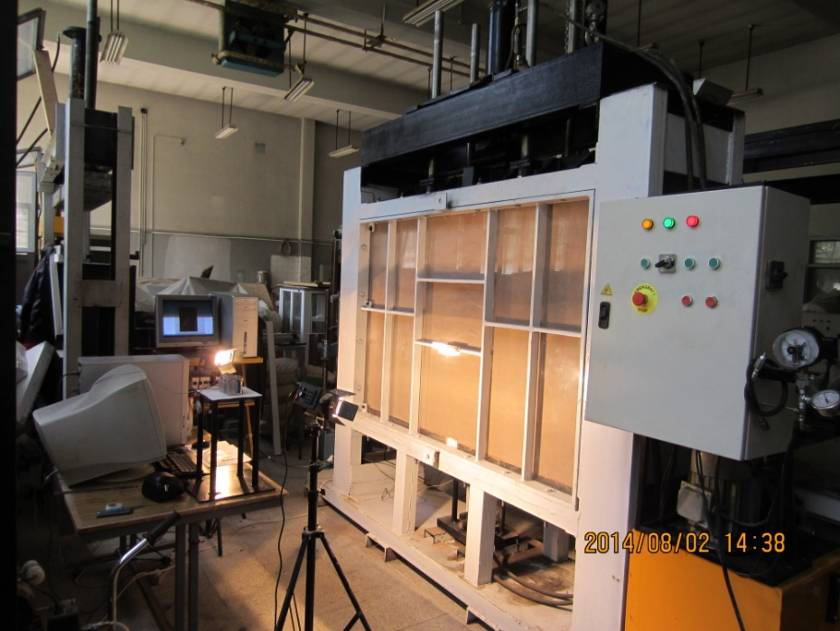
- At the beginning, without any displacement, the normal stress σ○ applied to the trapdoor is γh, in which γ is the density of the sand and h is the height of the mass of the sand in the container. In order to deposit the sand in loose condition it was poured from a defined height through a sieve No. 10; and in order to produce dense sand a vibrator is used. This stage was very time consuming and several tests were carried out to make sure that the soil density was the same throughout the whole mass.Having filled the container with sand, the nuts and bolts holding the trapdoor were unscrewed while the upward pressure on the trapdoor was being adjusted so that the trapdoor did not displace. This was a curtail point of course. At this stage the recorded stress was very close to γh. Following this stage the trapdoor was slowly yielded downward. This trend continued until the load displayed by the load cell tended towards an asymptote. In Figure 10 a view of the test apparatus during the test is illustrated.
 | Figure 9. PIV Method |
 | Figure 10. View of the system during the test |
9. Results
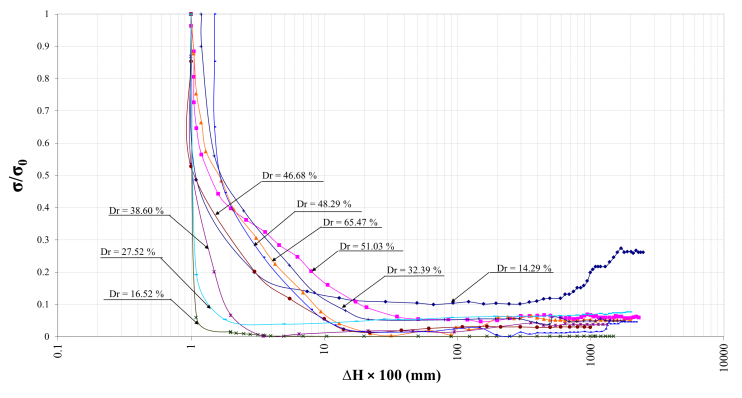
- The test results with 20 cm diameter trapdoors for sand in different relative densities are depicted in Figure 11, as example. In Figure 11, graphs of the σ/σ0 (the ratio of normal stress applied on the trapdoor during any stage of yielding to the same stress at the initial state of trapdoor with no displacement) against trapdoor downward displacement (ΔH) are illustrated. The ratio σ/σ0 defines stress reduction level due to arching effect, indeed.
10. Discussion
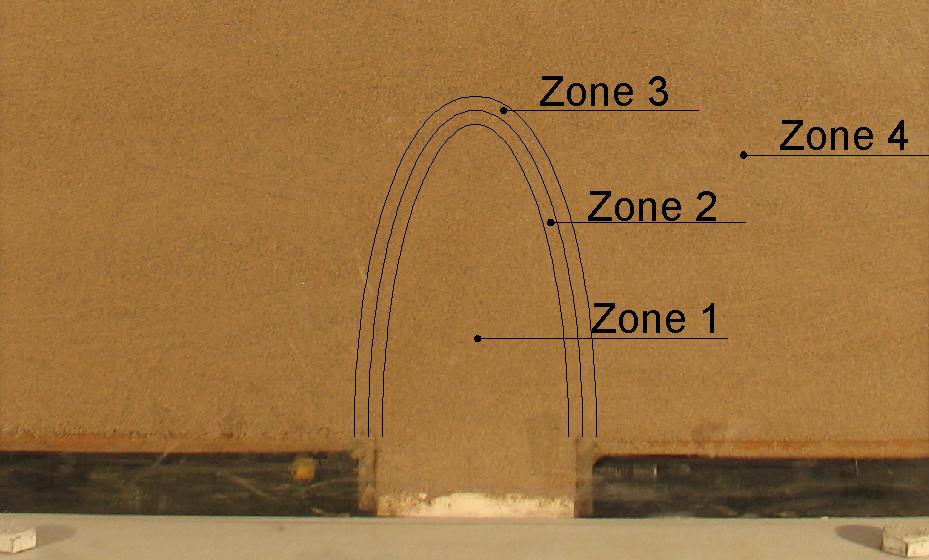
- Referring to Figure 11, it is observed that at the early stages of the trapdoor yielding, stress applied on the trapdoor due to soil weight decreases sharply as the trapdoor yields. At this stage the whole mass of sand behaves mostly elastic. As the trapdoor yield proceeds, the stress ratio decreases and tends toward a minimum value, keeps on a constant level and then increases again until it tends toward an ultimate level. While a stable arch forms, the ultimate level tends to a constant value. But when an unstable arch mechanism occurs and the soil mass collapses progressively, the ultimate ratio displays increasing behavior. This behavior is true for all trapdoors. However, as the diameter of the trapdoor increases and/or the relative density of sand decreases, the minimum and ultimate stress ratios both increase. This behavior may be interpreted as follows. As the trapdoor yield starts the overlying soil weight, exerted by the trapdoor, is transmitted gradually onto the container base, surrounding the trapdoor. For this reason at initial stage of the trapdoor yielding, in which the sand mass behaves mostly elastic, a small yield is followed by a sharp decrease in the stress carried by the trapdoor. As the trapdoor yield proceeds, random plastic points in the sand mass deform. At this stage stress adjustment due to trapdoor yielding is not immediate and occurs with some time lag. This is attributed to the flow phenomenon that occurs due to the plastic behavior of the yielding sand mass. Then continuing the downward displacement and the stress ratio approaching a minimum value, failure occurs. At failure state, depending on the trapdoor diameter, relative density, and the dilation angle of the sand, the failing sand mass dilates which imposes further stress on the trapdoor and continues until the failure surface has developed and the yielded mass of sand is separated from the whole mass. Following this stage there is no longer any stress or mass exchange between two parts. Accordingly, the load cell displays a constant value. But when the formation and extension of the plastic points are towards the soil surface, stress applying on the trapdoor increases and progressive failure is observed in the soil mass. So that the kinematics involved during trapdoor opening break down into four distinct phases. These four phases have to be compared to the variation of the stress (σ) applied on the trapdoor with its displacement (ΔH). The failure boundaries of this area start at each edge of the trapdoor in vertical direction and then converge to axis of symmetry of the trapdoor, of course the inclination of this convergence is different depending on the sand’s relative density and trapdoor diameter resulting in stable or unstable arch. In the initial state corresponds to the lowest stress applied on the trapdoor, the soil have elastic behavior. To this first state succeeds a flow phase so that the large strains occur in soil mass without considerable change in stress level. During this phase the plastic and failure boundaries extend to join together in the axis of symmetry of the trapdoor to produce a stable arch or extend to the top of the soil mass for unstable arch. In this phase, the extension of the plastic strain causes softening in the plastic zone of the soil mass while the inner part of the soil remains elastic and due to the increase in stress level in the adjacent parts with lower elastic and plastic strains, hardening phenomenon emerges. In the end of second phase, a transitional state is started. During this transition, total failure and separation in the two parts of the soil occurs. But in the stable arch this state leads to a constant trend of a stress level that indicates the fixed soil mass separated from the dome. But in the unstable arch increment in stress level continue because of the progressive failure in soil mass.According to the test results, during formation of the arching phenomenon 4 separated zones could be distinguished as illustrated in Figure 12.Zone 1: In this part soil remains elastic and the total soil mass have displacement.Zone 2: The shear band is established and develops in this part and soil shows softening behavior. The maximum strains occur at this stage so the soil has plastic behavior.Zone 3: Hardening behavior of the sand mass in occurs in this part and the distributed stress is transfers toward the basements through this zone.Zone 4: This zone remains elastic or the strains related to this part are so small.
 | Figure 11. Stress ratio-yield plots for 20 cm trapdoor diameter |
 | Figure 12. Zones of the arching phenomenon |
11. Conclusions
- ● In this research the physical model for experimental investigation of arching effect is has been introduced.● The apparatus to model the arching effect has a rigid structure so that the deformations of the system is inconsiderable and could be omitted.● Minatory stress sensors have been constructed and calibrated to measure the changes in the stress field in the sand mass.● To measure the deformations of the sand mass Particle Image Velocimetry (PIV) method has been used.● Referring to the experimental investigations, there are 4 phases in arching mechanism. The first phase occurs immediately after a small downward displacement of the trapdoor that leads to a minimum pressure applied to the trapdoor. During this stage soil mass behaves elastically. The second phase starts after the pressure on the trapdoor reaches a minimum value. This phase continues in a large period of plastic strains. In this state plastic strain and failure start at each edge of the trapdoor in vertical direction and then converge to axis of symmetry of the trapdoor, of course the inclination of this extension depends on the relative density of sand and trapdoor diameter resulting in stable or unstable arch. In second stage, flow phenomenon occurs in soil mass so that considering large strains in soil mass there is no considerable change in stress level. The third phase starts with an increment in stress applied on the trapdoor. The separation and establishment of a stable arch occurs at this stage. In the unstable arch manner, increment continues and the stress curve does not change its behavior to transfer to the fourth state. The fourth phase happens in stable arch manner so that stress ratio leads to a constant value. This indicates that the separation of stable arch is completed and trapdoor bears the whole weight of the separated arch mass. ● According to the test results, during formation of the arching phenomenon 4 separated zones could be distinguished.