-
Paper Information
- Previous Paper
- Paper Submission
-
Journal Information
- About This Journal
- Editorial Board
- Current Issue
- Archive
- Author Guidelines
- Contact Us
Geosciences
p-ISSN: 2163-1697 e-ISSN: 2163-1719
2015; 5(1): 46-51
doi:10.5923/j.geo.20150501.06
Detection of Gas Sands in the Niger Delta by Estimation of Poisson’s Dampening-Factor (PDF) Using Wireline Log Data
 Abstract
 Reference
 Full-Text PDF
 Full-text HTML
Namdie Joseph Inyang 1, Emeka E. Okwueze 2, Okechukwu Ebuka Agbasi 1
1Departmentof Physics, University of Uyo, Uyo, Nigeria
2Departmentof Physics, University of Calabar, Calabar, Nigeria
Correspondence to: Okechukwu Ebuka Agbasi , Departmentof Physics, University of Uyo, Uyo, Nigeria.
| Email: |  |
Copyright © 2015 Scientific & Academic Publishing. All Rights Reserved.
We here present a method for improved lithology and gas sand detection in the sandy Formations of the Niger Delta, Nigeria. The absence of Full-waveform sonic log data necessitated a theoretically generated S-wave log using the Greenberg-Castagna equation  . The theoretically generated S-wave with sonic log generated P-wave are utilized in the estimation of the D-scale factor
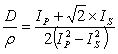
 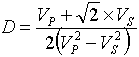 . Which when normalized by density (ρ) from the density log data yield the Poisson’s Dampening-Factor (PDF) log, PDF= D/ρ. Here, PDF is demonstrated to have higher values in gas saturated sands (0.3-0.98ms/m*cc/g) than in brine sand and shaly (0.02-0.10 ms/m*cc/g) regions of each of the two wells where available data permit such estimate and estimate of other useful Petrophysical parameters. Lack of useful data at certain prospective regions of these wells limit the success chance of the method at detecting more gas reservoirs. One out of the two wells sampled at the depth of 614-652m show favourable result representing a 12% success rate of the sample wells. At this well, Poisson’s Dampening-Factor (PDF) value is highest, 0.98 ms/m*cc/g. Extensive characterisation of lithology in well 02 is done through Cross plots to highlight sand quality. While well 01 have typically low values of Poisson’s Dampening –Factor (PDF), 0.02-0.10 ms/m*cc/g which are typical values for shale and brine sands. However, shale have the lowest values of Poisson’s Dampening-Factor (PDF) promising the basis for shale and brine sand differentiation.
Keywords: Poisson’s Dampening-Factor (PDF), Petrophysical Parameters, Sonic Log
Cite this paper: Namdie Joseph Inyang , Emeka E. Okwueze , Okechukwu Ebuka Agbasi , Detection of Gas Sands in the Niger Delta by Estimation of Poisson’s Dampening-Factor (PDF) Using Wireline Log Data, Geosciences, Vol. 5 No. 1, 2015, pp. 46-51. doi: 10.5923/j.geo.20150501.06.
1. Introduction
- The need to discriminate lithology and the fluid they contain is highly complicated becoming increasingly important as exploration and production projects. Formations in the Niger Delta, Nigeria for example consist predominantly of sand and shale sediments supplied from the weathering flanks of outcropping continental basement through the Benue-Niger drainage system. The Niger Delta is an active sedimentary basin at present and has, since Palaeocene times, prograded a distance of more than 250 km from the Benin and Calabar Flanks to the present delta front [23]. These Formations are mostly unconsolidated. However, Olafuji and Omole, (2010) [15] explains that Core analysis technique which involves coring of samples from the formation has been used in the in Niger Delta to obtain some Petrophysical properties of reservoirs in the laboratory. They stated also that ‘’though it is a direct method and quality data can also be obtained but coring are expensive and cores cannot be cut in all the rocks penetrated’’. Therefore, Formation evaluation, in this case fluid and lithology identification, is therefore, based mostly on well logs and their inversion products. With the help of well log information, Petrophysical and acoustic parameters like the lithology, porosity, water saturation, hydrocarbon saturation, acoustic impedance, Poisson’s impedance, shear impedance, and Poisson’s Dampening Factor (PDF), etc. can be estimated with varying degree of usefulness in evaluation of prospect areas.Earlier, Ostrander (1984) [16], proposed a new theory in seismic interpretation known as amplitude variation with offset (AVO) analysis. This theory is based on the variation of reflection coefficients with offset. Ostrander observed that variation of reflection coefficient depends on the contrast of elastic parameters between two media and the contrast of Poisson’s ratio. Now, variation of amplitude with offset (AVO) analysis is routinely being incorporated in inversion products in order to differentiate lithology and fluid content directly from seismic data. Consequently, commonly derived acoustical parameters from AVO analysis are acoustic impedance (AI) along with shear impedance (SI) or Poisson’s ratio (σ). Also density (ρ) can be estimated separately with decreasing reliability due to its dependence on accurate far-offset amplitudes beyond 30°. Poisson’s Impedance (PI) attribute, Quakenbush et al., (2006) [17] was demonstrated as new inversion product, by introducing the simultaneous rotation of the AI-SI space to derive Poisson’s Impedance (PI).The new attribute was applied to data from the North Sea, offshore Angola and Gulf of Mexico. In all cases Poisson’s Impedance was shown to have greater sensitivity in discriminating lithology than the acoustic Impedance (AI), Lambda-Mu-Rho (LMR) and, Elastic Impedance attribute at 30° (EI30°) etc., when the axis of the AI-SI space was rotated by a constant ‘’c’’. The significance of the ‘’c’’ term, which is theoretically assumed to be √2, is to optimise rotation of the AI-SI space. While neither AI nor SI alone completely discriminates oil sand, brine sand and shale, a new coordinate system represented by the dotted box completely discriminates the data groups in this example as represented by the rotated distribution plots [17]. Based on the work of Quakenbush et al. (2006) [17] namely, estimation of Poisson’s Impedance, [13], introduced the concept of Poisson’s Dampening Factor (PDF) attribute derived also from acoustic impedance (AI) along with shear impedance (SI) values making density estimates intrinsic within it. This intrinsic density estimate gives the Poisson’s Dampening Factor (PDF) attributes an edge over some other inversion products that relied mainly on density estimates from AVO analysis which requires accurate far-offset amplitude beyond 300. Mazumdar, (2007) [13] applied the new method to the Krishna-Godavari well in India that was tied to a seismic section. It was found that the method had better capabilities in identifying reservoir and non-reservoir units. However, a major setback was the difficulty in discriminating between brine sands and shale due to calcite cementation in brine sands which brings its bulk density higher and close to that of shale. Calcite cementation occurs mostly in carbonate rocks [19]. However, in Niger Delta reservoirs are predominantly unconsolidated sandstones [2] and therefore a better geological setting for the application of the Poisson’s Dampening Factor (PDF) analysis.
2. Methodology
- The variation in Poisson’s ratios play an important role when seismic waves inter from one lithology to other and indicative of material properties [14]. Basic rock physics shows that density and acoustic wave velocity can be affected by the following; 1) The number of minerals and their percentages, as well as the shape of grains (rock matrix)2) The porosity of the rock and3) The type of fluid filling the pore space.These effects determine the acoustic and shear impedance values of rocks which are used to simultaneously differentiate lithology and fluid content.Mathematically,
 | (1) |
 | (2) |
 | (3) |
 | (4) |
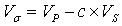 is the Poisson’s velocity that is a function of VP and VS which are the compressional and shear wave velocities respectively.Also Poisson’s ratio can be expressed in terms of VP and VS as;
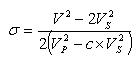 | (5) |
 | (6) |
 | (7) |
 | (8) |
 is called the Poisson’s dampening- factor (PDF).Alternatively,
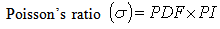 | (9a) |
 | (9b) |
 | (10) |
 | (11) |
 | (12) |
 | (13) |
 | (14) |
 | (15) |
3. Discussion of Result
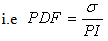
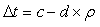
- WELL 01At well 01, the interval 2910 – 3010m is chosen (figure1). Shale, Shale- sand and Brine- sands are identified by combining gamma ray and PDF logs responses. PDF values are typically low 0.08-0.1 ms/m*cc/g but sensitivity to acoustic impedance (AI), shear impedance (SI), and Poisson’s impedance (PI) logs is high. Sand quality in the interval is generally poor with an average of 55 API. HCPV is low 0 - 0.2 Frac. While Gas saturation is overestimated at 0.7 Frac. Since low PDF values exclude the presence of gas sand in the interval. Low porosity region corresponds with shale sections of the well see fig. 1a, b, c and fig 1d in this section PI values lies behind AI and SI log values. And no reservoir detected.
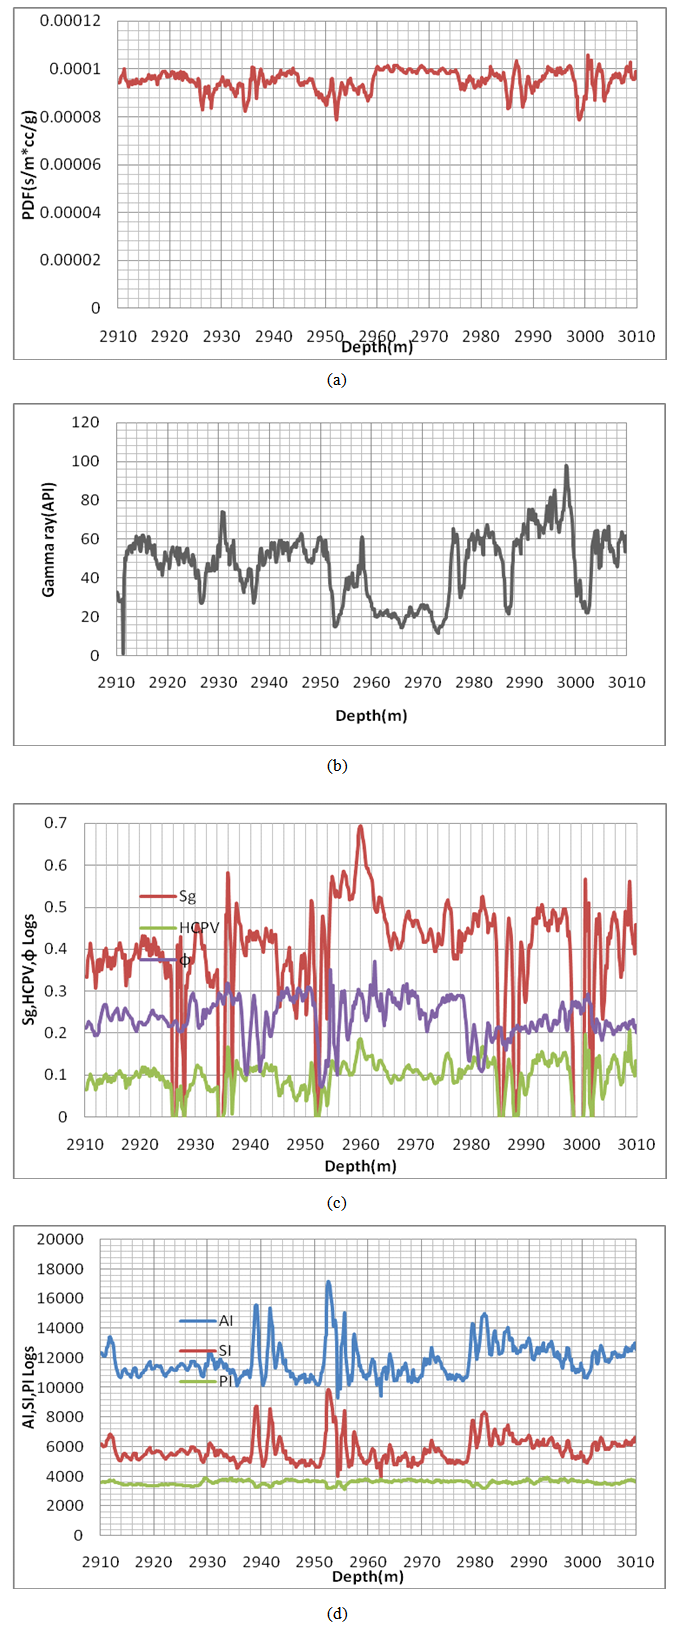 | Figure 1. (a) PDF, (b) Gamma ray, (c) Sg, HCPV and Porosity, (d) AI, SI and PI logs for well 01 |
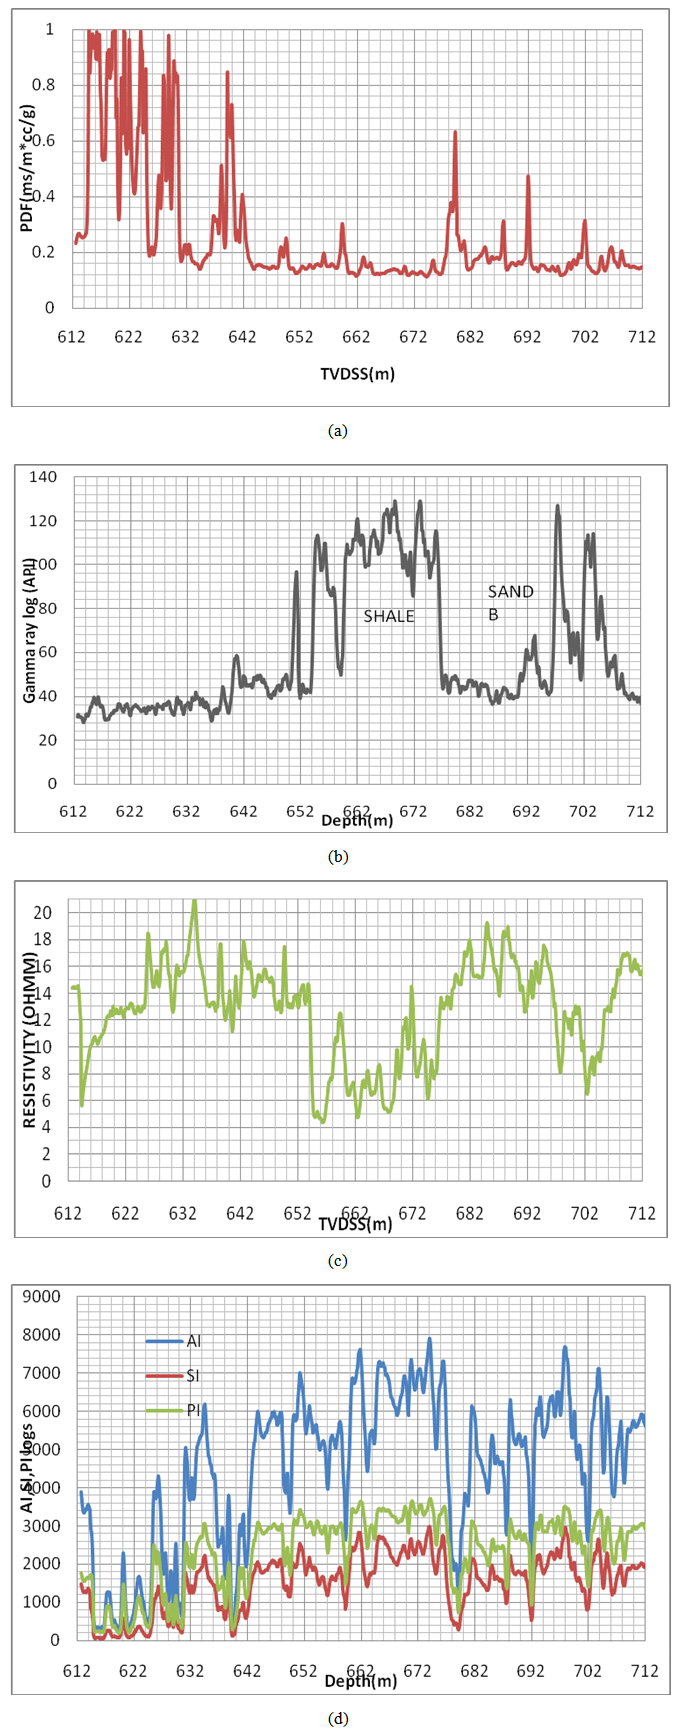 | Figure 2. (a) PDF log, (b) Gamma ray log and (c) Resistivity log for well 02 |
4. Conclusions
- In conclusion, Poisson’s Dampening-Factor (PDF) is shown to be a useful method in detecting gas sands, identifying lithology and showing sand quality in the Niger Delta region.In the two Wells sampled, only Well 02 shows evidence of a gas reservoir. The well01 was characterized by very low values of PDF which are inconsistent with the presence of gas sand also, attempt has been made in this work to infer lithology where possible.