A. S. Adebayo , E. A. Ariyibi , M. O. Awoyemi , G. C. Onyedim
Department of Physics and Engineering Physics, Obafemi Awolowo University, Ile - Ife, Nigeria
Correspondence to: A. S. Adebayo , Department of Physics and Engineering Physics, Obafemi Awolowo University, Ile - Ife, Nigeria.
| Email: |  |
Copyright © 2015 Scientific & Academic Publishing. All Rights Reserved.
Abstract
Geophysical survey involving electrical resistivity method, soil sampling analysis and hydro-chemical was conducted around Olubonku dump site in Ede, Osun State, Southwestern Nigeria with the view to assess the degree and extent of impact of the waste dump site on the quality of the groundwater in the study area. Ten vertical electrical sounding stations were established using Schlumberger configuration with half – currents electrode spacing that ranged from 1 to 150 m. Eight soil samples were collected at Horizon C close to and away from the dump site along NW – SE direction at sampling interval of 5 m and were analyzed for trace metals; and five water samples were also collected from hand dug wells for analysis. The VES interpreted results delineated three subsurface layers comprising topsoil, weathered layer and the fresh basement. The elemental concentrations of K, Ca, Mn, Zn, Ni, Cu, Cr and Fe in the soil samples located at the periphery of the dump site are much higher than those of the control sample point indicating pollution while water quality analysis from existing hand dug wells showed increase in concentrations of nitrate exceeding the permissible WHO limits. It can be concluded that the soils and the groundwater in the vicinity of investigated dump site had been polluted.
Keywords:
Geophysical technique, Hydrochemistry, Soil chemistry, Groundwater, Dumpsite, Leachate
Cite this paper: A. S. Adebayo , E. A. Ariyibi , M. O. Awoyemi , G. C. Onyedim , Delineation of Contamination Plumes at Olubonku Dumpsite Using Geophysical and Geochemical Approach at Ede Town, Southwestern Nigeria, Geosciences, Vol. 5 No. 1, 2015, pp. 39-45. doi: 10.5923/j.geo.20150501.05.
1. Introduction
The groundwater has become the safest and most abundant source of potable water in comparison to the surface water as it is often shielded from direct human activities. The state surface water scheme in Ede has not been able to fully meet the water needs of the populace which has necessitated recourse to groundwater. However, pollution of groundwater resources can occur directly from municipal waste water, industrial discharges, agricultural waste, urban runoff, landfills or waste dump and indirectly from air pollution. The over fifty years old waste dump materials are expected to biodegrade and generate effluent. The generated effluent may have found its way into the groundwater through percolation. There is the possibility that the groundwater within the premises of the dump site could have been polluted. Therefore there is need to carry out a geo-electric investigation of the area around the Olubonku waste dump site; delineate the lithological sequence, identify the aquifer units and map subsurface geologic structures (faults and fracture zones); determine the geoelectric parameters of the delineated subsurface layers and use the resistivity values to assess the groundwater quality; evaluate the quality of the groundwater by carrying out chemical analysis of sampled hand dug wells and soil samples; and use it to assess the degree and extent of impact of the waste dump site on the quality of the groundwater in the study area.A vast literature exists showing the applications of geochemical and geophysical methods in environmental problems associated with groundwater contamination due to leachate percolation. [1] used the electrical resistivity (vertical electrical sounding) and hydro-physicochemical methods to map the contamination patches at the subsurface and investigate the contamination level of the various hand dug wells situated in the Aarada area, Ogbomoso, Oyo State, Nigeria. Surface electrical resistivity has been proven as a useful practical method in detecting groundwater contamination from sewage pond [2] and from solid waste [3].
2. The Study Area
The survey area (Figure 1) is located within geographical co-ordinates of longitudes 658620 E and 658800 E and latitudes 855860 N and 855980 N on the Universal Transverse Mercator (UTM Zone 31) in Ede North Local Government Area, Osun State, Southwestern Nigeria. The over fifty years old Olubonku dumpsite consists of heterogeneous refuse with a maximum difference in elevation between the top of the solid waste and the surrounding area of 5 m. Geologically, the study area lies entirely within the Basement Complex of Southwestern Nigeria [4] and is underlain by schist pegmatite and a sequence of lateritic clay, clayey sand/sand and weathered / fractured bedrock. The area has annual rainfall of 1500 mm – 2100 mm and the temperature varies from about 26℃ in August/September (i.e. the peak of the raining season) to about 34℃ in March (the peak of the dry season).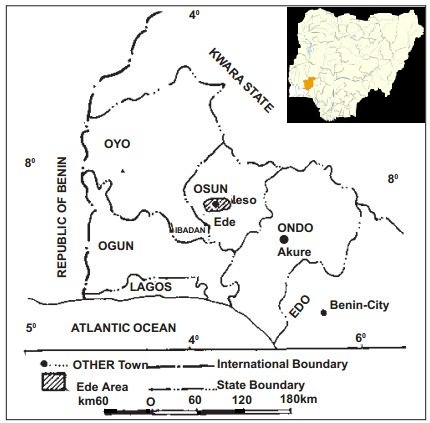 | Figure 1. Location of Ede Area (Modified after [5]) |
3. Methods of Study
3.1. Geoelectric Survey
Vertical Electrical sounding (VES) measurement involves passing electric current (I) into the ground through a pair of electrodes A and B, while electrodes M and N measured the potential difference (∆V). This operation is repeated when the distance between A and B electrodes are increased, together with an increase of the study depth. A value of apparent resistivity (ρa) is calculated in each distance AB using equation: | (1) |
where G = ∏(AB/2)2/MN is geometrical factor which is determined by the electrode configuration of the array. The Schlumberger electrode configuration was used to acquire the vertical electrical soundings (VES) with maximum half current electrode spacing (AB/2) of 150 m using syscal junior resistivity meter. The field data was interpreted by applying partial curve matching technique [6] using master curves [7] and sets of auxiliary charts [8, 9]. From the preliminary interpretation, initial estimates of the resistivity and thickness of the various geoelectric layers at each VES locations were determined. These geoelectric parameters were then employed as starting models for the computer-aided iteration using Resist software [10]. The resulting sounding curves were interpreted quantitatively and geoelectric sections were drawn along NW – SE and NE – SW direction as a means of providing an insight into the subsurface sequence and the structural disposition.
3.2. Soil Chemical Analysis
Chemical analysis was done on the soil samples collected close to and away from the dump site. The preliminary assessment of the extent of pollution with respect to exchangeable metals were carried out at the Centre for Energy Research and Development (CERD), Obafemi Awolowo University (OAU) Ile – Ife, Nigeria, using X-ray fluorescence. Soil samples from eight sampling points at about the Horizon C were obtained and analyzed for their elemental concentrations in ppm (part per million). The sample points were designated as S1 to S8 with each sampling point separated by 5 m and S8 serves as the control point and was at a distance of 50 m away from S7. The results of the chemical analysis are tabulated and presented under results and discussion.
3.3. Hydro-chemical Analysis
In order to carry out a complete pollution assessment of the study area, hydro-chemical analysis of water samples collected from five hand dug wells around the dump site were carried out. The sampling wells were designated W1, W2, W3, W4 and W5. The physico-chemical parameters that are indicative of groundwater pollution such as Total dissolved Solid, Chloride, Nitrate, Sulphate, Lead, Iron, Calcium, Magnesium and Sodium were analyzed. The cations concentrations were determined using Atomic Absorption Spectrophotometer (AAS); Concentrations of sulphate in the water samples were determined using Turbidimetric method while the concentrations of nitrate
  in the water samples were determined by using the Ultra Visible Screening Method at the Centre for Energy Research and Development (CERD), Obafemi Awolowo University (OAU) Ile-Ife. The results of the hydrochemical analysis of the groundwater samples from the study area are presented results and discussion.
4. Results and Discussion
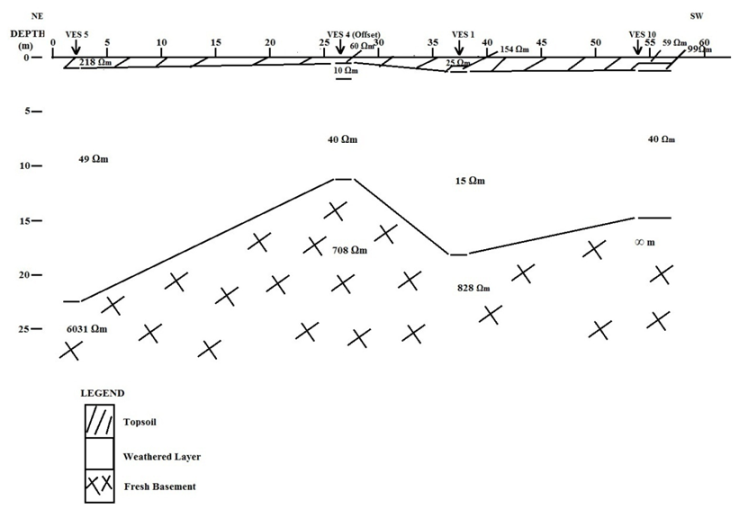
Geoelectric Sections, Characterization and Lithologic DelineationTwo dimensional (2D) geoelectric sections (Figures 2 and 3) which shows, for each locality, the variations of resistivity and thickness values of layers within the depth penetrated in the study area, were generated from the series of 1-D VES interpretation. These VES sections were generated based on the geo-electrical parameters (resistivity and thicknesses of the layers) iterated.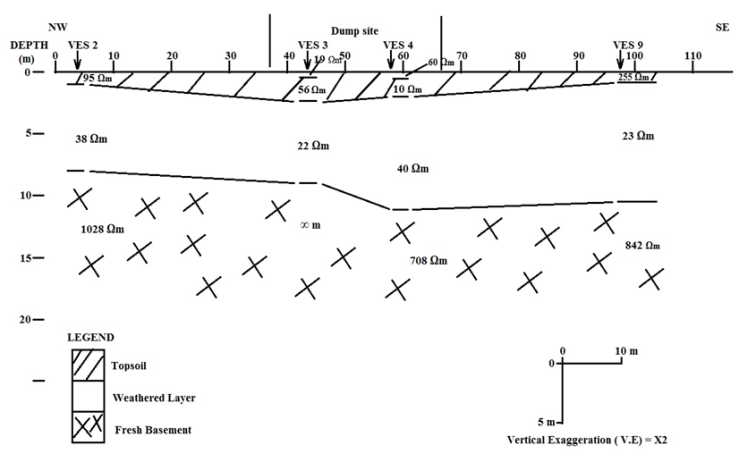 | Figure 2. 2–D Geoelectric Section along NW – SE Direction |
 | Figure 3. 2–D Geoelectric Section along NE – SW Direction |
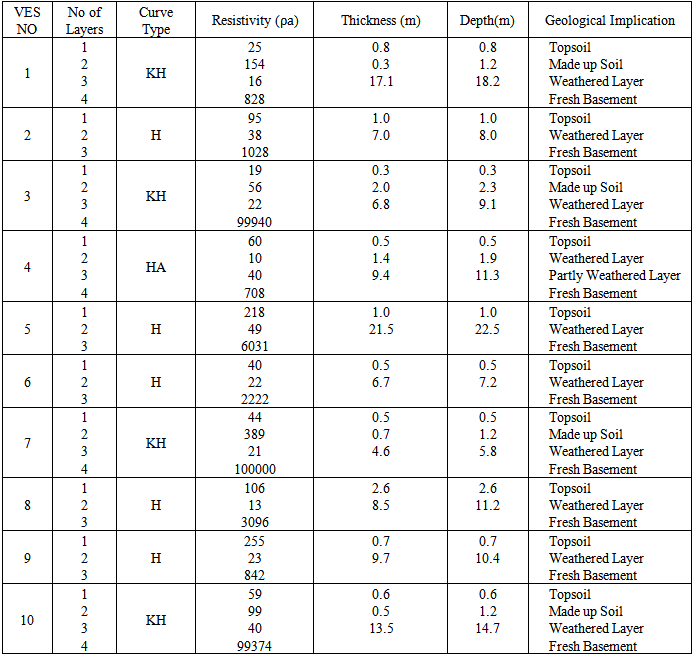
Figure 2 shows a geoelectric section that links VES stations 2, 3, 4 and 9 along a Northwest - Southeast direction. The result of the sounding curves showed; three geoelectric layers (H type) at VES 2 and VES 9, four geoelectric layers at VES 3 (KH type) and VES 4 (HA type) which can be classified into three geologic layers. These include the topsoil, the weathered layer and the fresh basement. The topsoil varies in thickness from 0.5-2.0 m with layer resistivities of between 56 and 255 ohm-m. The relatively low resistivity value of 10-56 ohm-m obtained beneath the dump site may be indicative of polluted topsoil. The weathered layer thicknesses and resistivities are 6.8-9.7 m and 22-40 ohm-m, respectively. The horizon is composed of clay. The bedrock model resistivity values includes 708 ohm-m and beyond. The depth to the bedrock varies from 8.0-11.3 m.Figure 3 shows a geoelectric section that connects VES stations 1, 4, 5 and 10 along Northeast - Southwest direction. The result of the sounding curves showed; three geoelectric layers (H type) at VES 5 and four geoelectric layers at VES 1 and 10 (KH type); and VES 4 (HA type). The profile revealed three subsurface layers; the topsoil, the weathered layer and the fresh basement. The topsoil thickness is 0.6-0.8 m and has resistivity values varying from 25-59 ohm-m. The dump site is characterized by relatively low resistivity values of 25 ohm-m which may be indicative of polluted topsoil. The second layer is the weathered layer. The weathered layer thicknesses and resistivities are 4.6-21.5 m and 15-49 ohm-m, respectively. This layer is composed of clay. The bedrock resistivity values range from 708 ohm-m to infinity. The depth to the bedrock varies from 5.8-22.5 m. The summary of the geoelectric parameters and the geoelectric characterization of the investigated dump site are shown in Tables 1 and 2 respectively. Table 2 shows that the area around the dump site is characterized by relatively low resistivity topsoil and weathered layer. It is suspected that leachates generated at the dumpsite may have migrated downward from the topsoil into the weathered layer. Table 1. Geoelectric layer parameters of the delineated area
 |
| |
|
Table 2. Summary of the Geoelectric Characterization of the Investigated Dump Site
 |
| |
|
Soil Chemical Analysis ResultFigure 4 shows histogram of the concentration levels of the analyzed elements for the different sampling locations. Except for the sample points S6 and S7 whose elemental concentration levels are close to that of the control point S8, other sample points show concentration levels most especially Cr, Fe, Ni, Cu and Zn that are much higher than that of the control point S8, indicating pollution presumably from the dump site. The sampling points S1 to S5 shows evidence of pollution bound the dump site.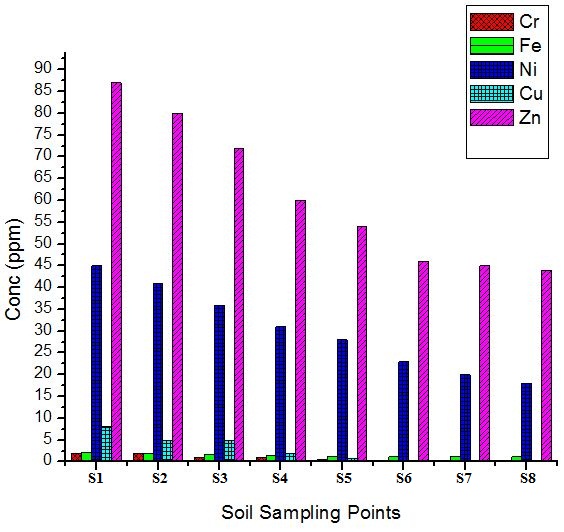 | Figure 4. Plot of Concentration level (ppm) against the Soil Sampling Points |
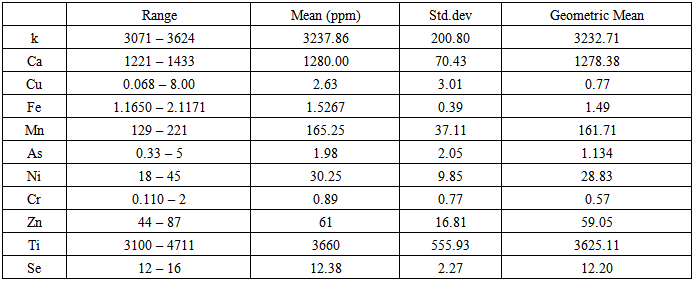
Table 3 provides the descriptive statistics of the concentration of the elements in the soil samples. From the table Ti has the highest concentration level while Cr has the least concentration level and the order observed for this study is Ti > K > Ca > Mn > Zr > Zn > Ni > Sr > Se > Cu > As > Cr.Table 3. Descriptive Statistics of the Elements
 |
| |
|
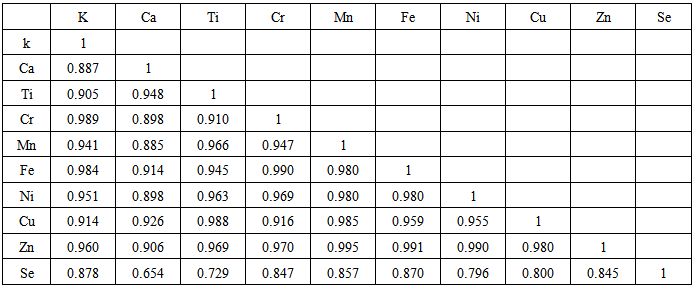
Inter-elemental analysis (Table 4) of the metals showed a strong and positive correlation with all the metals, these revealed that all the metals are from the same source which may be coming from the dumpsite and thus, makes it anthropogenic in origin. Geochemical evaluation (Figure 4) shows that there is a higher concentration of the metals at the dumpsite, with decreasing concentration to the NW and SE part of the dumpsite. This implies that the dumpsite is the main source of accumulation of the metals in the study area.Table 4. Correlation Coefficients Matrix of the Elements
 |
| |
|
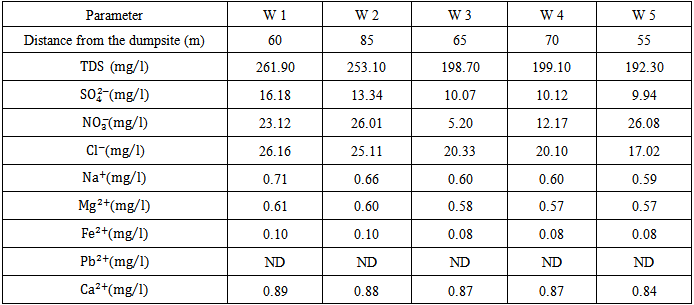
Hydro-chemical Analysis Result Hydro-chemical analysis of water samples collected from five hand dug wells located within the radius of about 85 m from the centre of the dump were carried out and the results are presented in Table 5. The result reveals that the Total Dissolved Solids (TDS), which is used as an indicator to determine the general chemical quality of water falls in the class of freshwater using [11] classification of ground water in all the water samples, The values ranges from 198 – 262 mg/l which were within the maximum allowable concentrations by [12].Table 5. Hydro-chemical Analysis Result
 |
| |
|
The concentrations of the anions are shown in Table 5. The table shows that the concentration of Sulphate ranged from 9.94 to 16.18mg/l. Most sulphate compounds are readily soluble in water. Hence, these concentration ranges is lower than the maximum allowable limits of 200 mg/L recommended by [12]. Sulphate, within this concentration range has no known adverse health implications.Nitrate
  concentration ranges from 5–26 mg/l. The background nitrate concentration levels for the basement complex area of Nigeria ranges from none detectable – 22.94 mg/l (Table 6). Nitrate concentration of greater than the 10 mg/l maximum permissible level recommended by [12, 13] were obtained from water samples collected around the dumpsite and are regarded as evidence of pollution.
Table 6. Baseline Concentration values for Groundwater Conductivity, Chloride and Nitrate obtained in Parts of the Basement Complex Area of Nigeria
 |
| |
|
5. Conclusions
The Geophysical and geochemical investigations have been used to assess pollution of soil and groundwater in the area around Olubonku dump site in Ede, Osun State, Southwestern Nigeria. The geoelectric section delineated a maximum of three subsurface layers. They are the topsoil, weathered layer and fresh basement rock. The weathered layer constitutes the major aquifer unit with characteristic low resistivity values of 15 – 49 ohm-m and thickness range of 4.6–21.5m. Elevation in concentration of metals (especially heavy metals) around the dumpsite as compared to the control point indicate contamination of the topsoil around the dump site. The results of hydrochemical analysis of water samples from hand dug wells show that nitrate concentration levels of > 10 mg/l. These values are higher than the maximum permissible save values recommended by [12, 13] and hence a confirmation of groundwater pollution. It can be concluded that the soils and the groundwater in the vicinity of investigated dump site have been polluted.
References
| [1] | E. R. Olafisoye, L. A. Sunmonu, Adagunodo and O P. Oladejo, Groundwater Contaminants’ Investigation at Aarada Waste Disposal Site Using Geophysical and Hydro-Physicochemical Approach. Journal of Environmental Science, Toxicology And Food Technology, Vol. 2(4): pp. 01-10, 2013. |
| [2] | A. A. Adepelumi, B. D. Ako, O. Afolabi, J. B. Arubayi, Delineation of Contamination Plume around Oxidation Sewage-Ponds in Southwestern Nigeria. Environmental Geology, Vol. 48(8), pp. 1137-1146, 2005. |
| [3] | E. A. Ayolabi and Y. P. Daniel, Hydro-chemical and Electrical Resistivity Assessment of the impact of the solid waste on the Groundwater at Oke Alfa refuse Dump-site, Lagos, Nigeria. Environment Science Engineering Technology, Vol. 12, pp. 5936 – 5946, 2005. |
| [4] | M. A. Rahaman, Review of the Basement Geology of Southwestern Nigeria. Geology of Nigeria, Kogbe, C.A; (Ed). Elizabethan Publ. Co; Lagos, Nigeria, pp. 41 – 58, 1976. |
| [5] | A. Adediji and L. T. Ajibade, Quality of Well Water in Ede Area, Southwestern Nigeria. J. Hum. Ecol., Vol. 17(3): 223-228, 2005. |
| [6] | O. Koefoed, Geosounding Principles, 1. Resistivity Sounding Measurements. Elsevier Scientific Publishing Amsterdam, Netherlands 1979. |
| [7] | E. Orellana and H. M. Mooney, Master Tables and Curves for Vertical Electrical Sounding over layered Structures. Interciencis, Madrib, 1966. |
| [8] | A. A. R. Zohdy, The auxillary point method of Electrical Sounding interpretation and its relationships to the Dar Zarrouk Parameters. Geophysics, Vol. 30(4), pp. 644 – 660, 1965. |
| [9] | G. V. Keller and F. C. Frischnecht, Electrical methods in Geophysical Prospecting Pergamon Press, Oxford, 523, 1996. |
| [10] | B. P. A. Vander Velper, RESIST Version 1Resistivity Depth Sounding Interpretation Software. M. Sc. Research Project. ITC: Delft Netherlands, 1988. |
| [11] | H. A Gorrel, Classification of formation waters based on sodium chloride content. American Association of Petroleum Geology Bulletin, Vol. 42, pp. 2513, 1958. |
| [12] | World Health Organization, Guideline for Drinking-Water Quality. Virender Kumar Arya, second edition. World Health Organization: Geneva, Switzerland. 973, 1999. |
| [13] | FEPA. Guidelines and Standards for Environmental Pollution Control in Nigeria. FEPA Press: Lagos, Nigeria. 1 – 17, 1991. |
| [14] | A. S. Olatunji, M. N. Tijani, A. F. Abimbola and A. U. Oteri, Hydrogeochemical Evaluation of the Water Resources of Oke – Agbe Akoko, Southwestern Nigeria. Journal of Nigerian Association of Hydrogeologists, Vol. 12, pp. 81 – 87, 2001. |
| [15] | A. F. Abimbola, A. M. Odukoya and A. S. Olatunji AS (2002). Influence of Bedrock on the Hydrogeochemical Characteristics of Groundwater in Northern Part of Ibadan Metropolis, SW Nigeria. Journal of Nigerian Association of Hydrogeologists (NAH), Vol. 13, pp. 1- 6, 2002. |
| [16] | V. O. Olarewaju, M. O. Olorunfemi and O. Alade O (1997). Chemical Characteristics of Groundwater from Some Parts of the Basement Complex of Central Nigeria. Journal of Mining and Geology, Vol. 33(2), pp. 135 – 139, 1997. |
| [17] | A. E. Bala and A. Onugba, Preliminary Chemical Assessment of Groundwater in the Basement Complex Area within the Bunsuru and Gagere Sub – Basin, Northwestern Nigeria. Journal of Mining and Geology, Vol. 37(1), pp. 45 – 52, 2002. |


 in the water samples were determined using Turbidimetric method while the concentrations of nitrate
  in the water samples were determined by using the Ultra Visible Screening Method at the Centre for Energy Research and Development (CERD), Obafemi Awolowo University (OAU) Ile-Ife. The results of the hydrochemical analysis of the groundwater samples from the study area are presented results and discussion.


 ranged from 9.94 to 16.18mg/l. Most sulphate compounds are readily soluble in water. Hence, these concentration ranges is lower than the maximum allowable limits of 200 mg/L recommended by [12]. Sulphate, within this concentration range has no known adverse health implications.Nitrate
  concentration ranges from 5–26 mg/l. The background nitrate concentration levels for the basement complex area of Nigeria ranges from none detectable – 22.94 mg/l (Table 6). Nitrate concentration of greater than the 10 mg/l maximum permissible level recommended by [12, 13] were obtained from water samples collected around the dumpsite and are regarded as evidence of pollution.
 Abstract
 Reference
 Full-Text PDF
 Full-text HTML


