Ayibawari O. Egai 1, Reward K. Douglas 2
1Department of Geology, University of Benin, Benin City, Nigeria
2Department of Environmental Science and Technology Cranfield University MK43 0AL, Bedfordshire, United Kingdom
Correspondence to: Ayibawari O. Egai , Department of Geology, University of Benin, Benin City, Nigeria.
| Email: |  |
Copyright © 2015 Scientific & Academic Publishing. All Rights Reserved.
Abstract
An aspect of geophysical study using the Vertical Electrical Sounding (VES) technique was applied in Ishiayi community in Ahoada west Local Government Area of Rivers State to delineate geo-electric stratigraphy and to access hydro-geological conditions. Six (6) VES points with an electrode spacing’s of AB/2 147M and AB 294M were occupied along the traverses. Surface data were acquired with an ABEM SAS 1000 terrameter set. The data were interpreted using IP2 win computer software’s. The results of the interpreted VES data and the drilled borehole logs confirms the following stratigraphy top moist soil (86-319Ωm), lateritic sand (44-631Ωm), silty clay layer (44-335Ωm), and saturated brownish sand (999-1056Ωm) as aquifer. Geophysical VES reports and borehole logs confirms that the area is a homogeneous formation consisting of consistent lithology of sand with intercalation of silty clay layer. Borehole logs further envisaged that the groundwater distribution network is uniform. Geo-electric sections further reveal that depth to groundwater is relatively shallow reflecting less than 5m virtually in all the locations. Water level generally reflects consistency within the surveyed area. Furthermore, the results of the interpretation of the VES data indicate that the thickness values of the aquifer vary from 8.16m to 30.91m. VES 1 and 2 reflect little thickness of aquifer within a depth ranges of 50-65ft and 30-35ft. However, VES 3, 4, 5 and 6 showed relatively thick column of the aquifers. Although, all the mapped aquifers in the investigated area are prolific but the thickness of the aquifer is a reflection of the hydraulic properties, such as water retention capacity and transmissivity. Hence, VES 3, 4, 5 and 6 show better hydraulic properties as a result, water abstractions wells were sited within depth range of (115.5-132ft). Thus, four (4) boreholes were drilled in aforementioned locations confirming the water to be good and free of iron concentration.
Keywords:
Vertical Electrical Sounding (VES), Hydro-geological conditions, Aquifer, geo-electric sections
Cite this paper: Ayibawari O. Egai , Reward K. Douglas , Aspects of Geophysical Survey Using Vertical Electrical Sounding (VES) for Groundwater Exploration in Parts of Ahoada West LGA of Rivers State, Southern Nigeria, Geosciences, Vol. 5 No. 1, 2015, pp. 31-38. doi: 10.5923/j.geo.20150501.04.
1. Introduction
Water is one of the abundant resources available in the Niger Delta, yet quality of the water is debatable for human consumption. Population growth, increase in oil and gas explorations, poor environmental stewardship has tremendously destroyed the quality of drinkable water in the area. This effect becomes enunciated in both surface and underground waters in the region.The investigated area (Ishiayi Community) in Ahoada west Local government Area of Rivers State has the problem of high iron concentration prevalence in the available boreholes in the area. Iron stains laundry, show brownish colouration in containers, objectionable taste, impair and corrodes pipes, castings, plumbing fixtures and cooking Utensils. However, inspite this degrading effects borehole drilling is being done haphazardly in the area. There seems to be no conscious effort of due preliminary geological, geophysical and hydro-geological investigations. Additionally, groundwater as the only source of potable water supply for domestic, industrial and agricultural uses is under intense pressure of degradation and contamination due to indiscriminate waste disposal, indiscriminate location of petroleum products storage tanks and the leakage of these facilities, sinking and leakage of septic tanks of various households. Unfortunately, the water table and depth to the aquiferous units are very close to the surface (Okiongbo & Ogobiri, 2011) [1]. Inspite of these reducing qualities, borehole drilling is handled inchoately, amidst a high level patronage the non-professionals (quacks) enjoy. The result is rampantly abandoned low yield water abstraction wells; a situation that yearn urgently for an action plans to improve the efficiency of sitting and mapping out areas for optimal high yield boreholes for groundwater supply becomes very tasking and imperative. This form the main thrust of this investigation using the conventional geophysical method which offers remote and non-destructive evaluation for subsurface delineation of underlying strata. The electrical resistivity method is the most commonly applied geophysical tool for groundwater exploration as it can determine aquifer thickness and depth to bedrock, it is also capable of determining the quality of groundwater i.e. whether the water is saline brackish, fresh or contaminated Idehai and Egai, (2014) [2]. The basic aim of resistivity survey is to delineate vertical and horizontal boundaries with electrical contrast. The Schlumberger array was used in this investigation to delineate water bearing formations (aquifers), because of its better depth interpretation and its usefulness in mapping subsurface aquifers and groundwater exploration this method find more superior compared to other methods Egai, (2013) [3]. Other usefulness of this geo-electrical method, particularly, the Schlumberger was chosen for this study, because it is non-invasive and quantitative technique, less expensive and easy to interpret, Fronlch et al., (1994) [4], Mbonu et al., (1991) [5]. This study is an attempt to investigate the subsurface hydro geological conditions so as to improve the efficiency of sitting high yield abstraction boreholes in the area. The significance of this investigation is to delineate the subsurface geo-electric stratigraphy and to access hydro-geological conditions, such as groundwater quality at the site to select aquiferous zones with total dissolved solids (TDS) and iron concentration within potable water limits for the sitting of a water abstraction well (boreholes).
2. Geology and Hydrogeology of the Study Area
The study area Fig (1) (Ishiayi Community) in Ahoada West Local Government Area of Rivers State is located within latitude N05° 03’ 06.4’’and longitude e E006° 25’ 11.3’’. It lies within the coastal sedimentary lowlands hydro-geological province.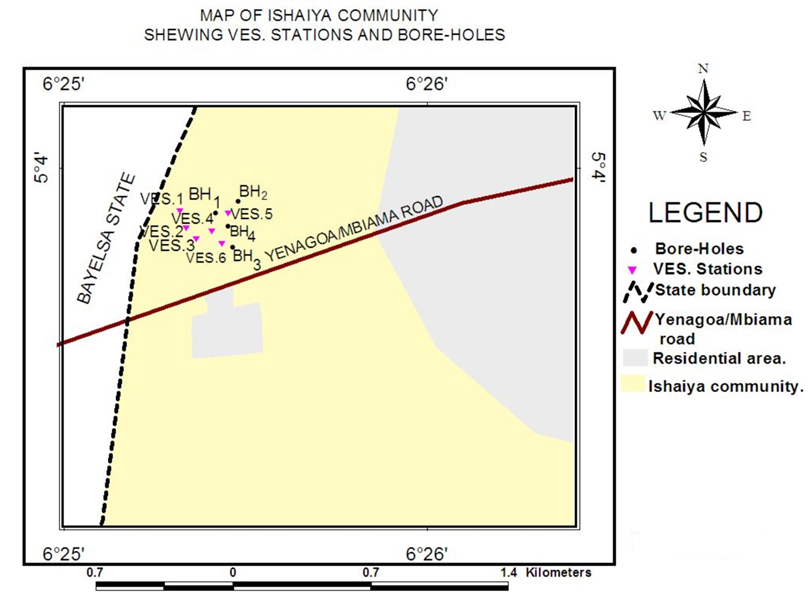 | Figure 1. Map showing the VES points and the Drilled Borehole locations in the investigated area |
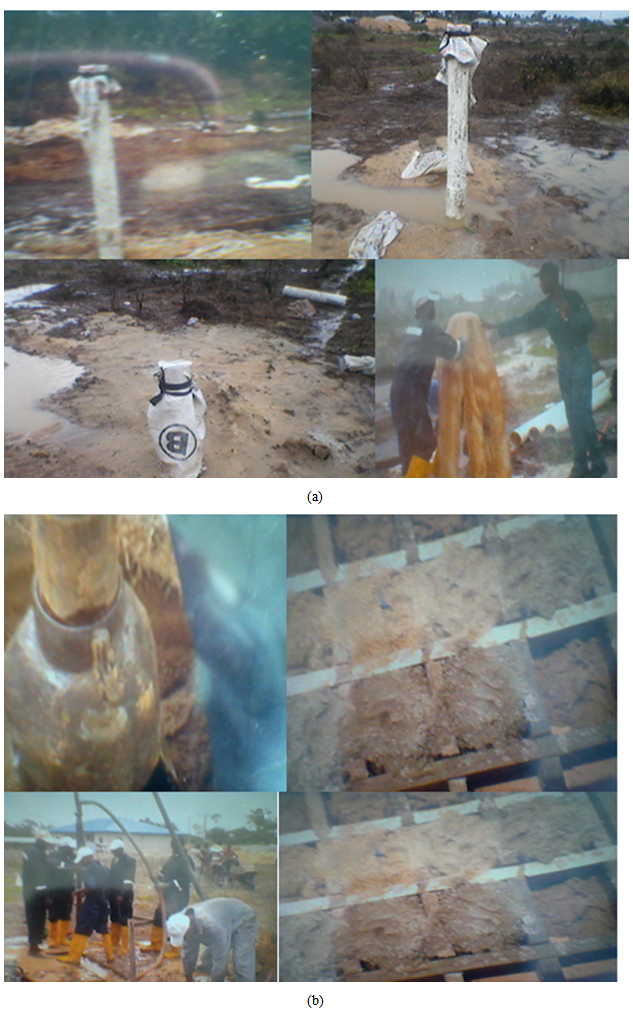 | Figure 2. Photographs showing drilled boreholes in the study area |
These deposits are characterised by pebbles, sands and intercalations of silt, mud and clay in places. They are Prototype of Quaternary sediments in the Benin Formation. It is essentially fluvial in Origin and comprises of unconsolidated massive, and porous fresh water bearing sands with localized shale inter-beds Abam, K.S 1999) [6]. The area is within the tropical Equatorial climate dominated by abundant rainfall with an annual means of 3000mm (Amajor and Ofoegbu, 1988) [7]. This ensures a large volume of water input into the environment and with the poor drainage most parts of the city are flooded during wet season, April to October/November. The climate of the study area lies within the tropical climate zone. Temperature ranges from 20℃ to about 33℃. Humidity is high with mean value of about 75℃. The area is characterized by two seasonal patterns which are the Wet and Dry seasons (Egai and Imasuen, 2013) [8]. The wet season begins from the month of April to the month of October and the dry season begins by November to the month of March. Within the rainy season a short break is observed in the month of August commonly referred to as “August break’’. The vegetation of the study area is characterized by the fresh water swamp forest and the tropical rain forest. The fresh water swamp forests in the area have fresh water vegetation they consist of mainly the raffia palms, bush mangoes etc. The Benin formation (2,100m) is made up of over 90% massive, porous coarse sands with localized clay / shale inter-beds (Allen, 1965) [9]. The Quaternary deposits (40 – 150m thick) generally consist of rapidly alternating sequences of sand and silt /clay with the latter becoming increasingly more prominent seawards. Benin formation is where all boreholes are sunk.
3. Material and Methods
The Schlumberger Configuration was used by applying current to the ground through two electrodes (A and B) and then measuring the resultant potential difference (V) between the potentials M and N. The centre point of the electrode array remains fixed but the spacing’s of the electrodes was increased so as to obtain the information about the stratification of the ground. The schlumberger data are often taken in overlapping segment because at each step of AB spacing, the signals of the resistivity meter become weaker. Therefore, MN spacing was enlarged and two values for the same AB/2 were measured, one for the long MN spacing’s. The schlumberger configuration was employed not only because it is faster and less likely to be influenced by lateral model and it requires a fewer number of field personnel as the only the current electrode A and B requires changes. A total of six VES points were engaged occupying one site location. Electrode spacing’s AB/2 of 147m was used along the transverse. Data were acquired using surface geophysical equipment SAS 1000 terrameter set. Apparent resistivity values were determined by taking the product of the resistance as measured by the terrameter and the geometrical factor a parameter which is dependent on the potential and the current electrode spacing’s. The apparent resistivity values are plotted against the half-current spacing’s on the log-log graph. Guided by the general trend of the field curves were made. The plots generate the field curves. A qualitative interpretation of the curves is discussed in terms of the resulting geo-electric parameters. The data obtained was later subjected to computer assisted iterative interpretation using 1-D inversion technique software IXID, interpex, USA). This programme was used to perform quantitative analysis and interpretation of the field curves. The software requires that the operator introduce the number, thickness, and of the resistivity’s of the subsurface layers. The theoretical curve for the initial input parameters is compared with the measured data. The starting model and its corresponding resistivity are transformed, refined or modified by the programme to obtain a best fit relation to the field data. The method of iteration was performed until fitting error between field data and synthetic model curve becomes least and constant. Thus, the software yields the number, thickness and resistivity of the various layers.
4. Result and Interpretation
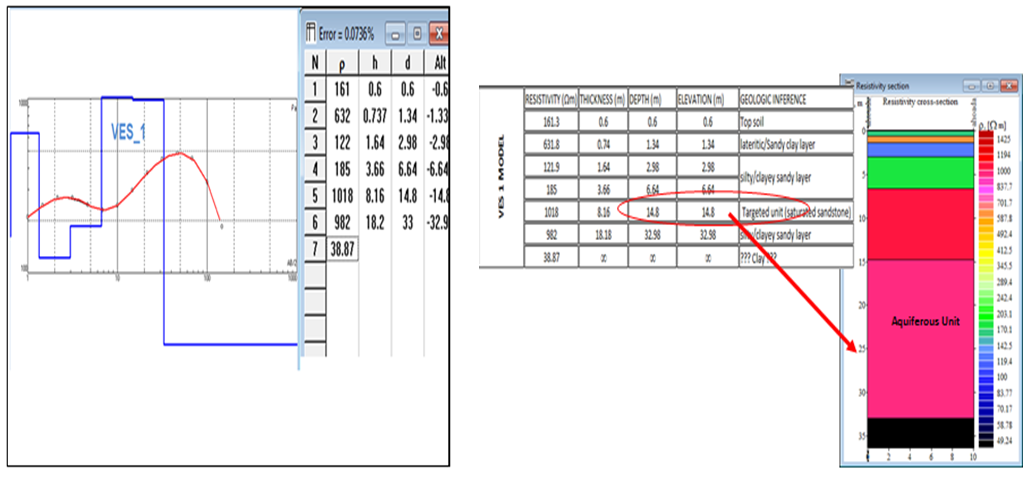 | Figure 3. VES 1 Modelling result showing the geo-electrical layers |
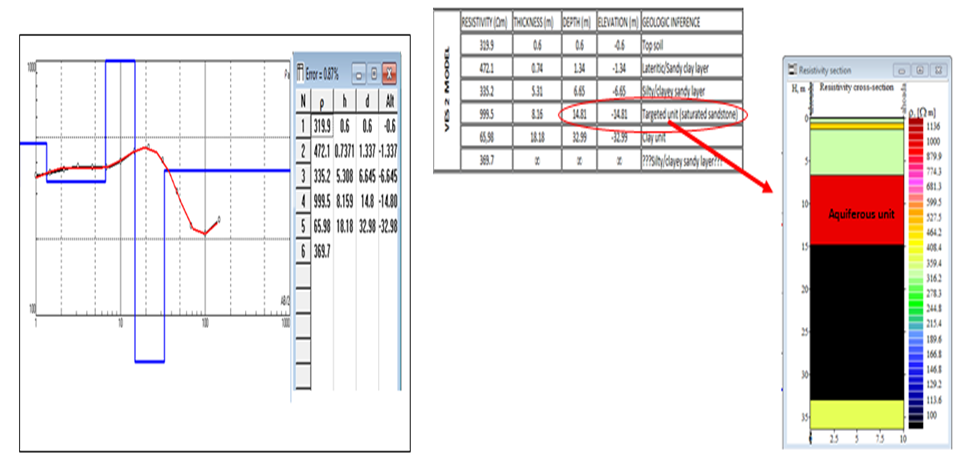 | Figure 4. VES 2. Modelling Result showing the geo-electrical layers |
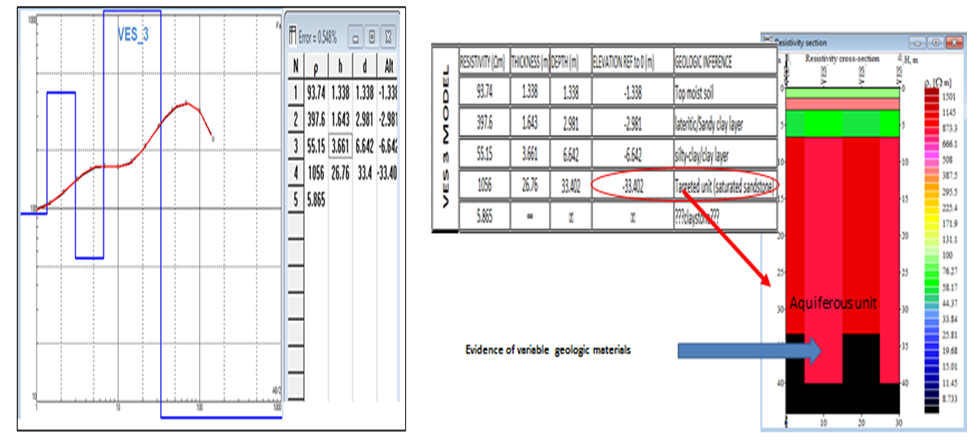 | Figure 5. VES 3. Modelling Result showing the geo-electrical layers |
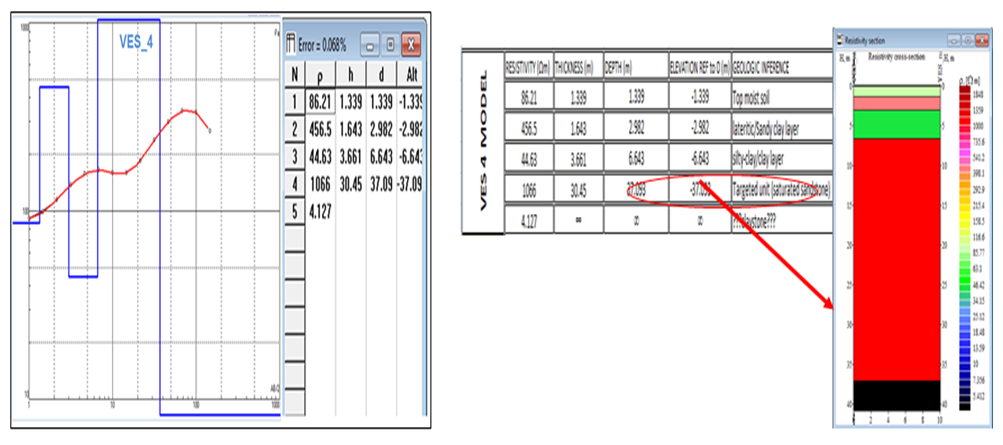 | Figure 6. VES 4. Modelling Result showing the geo-electrical layers |
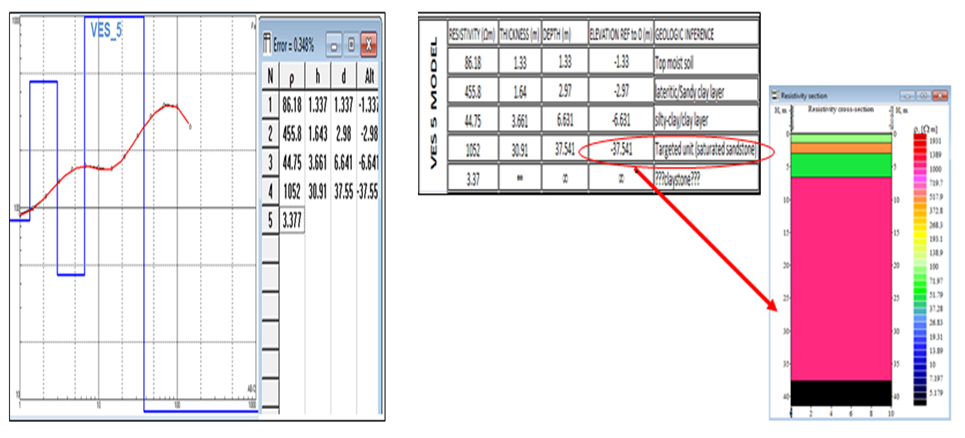 | Figure 7. VES 5. Modelling Result showing the geo-electrical layers |
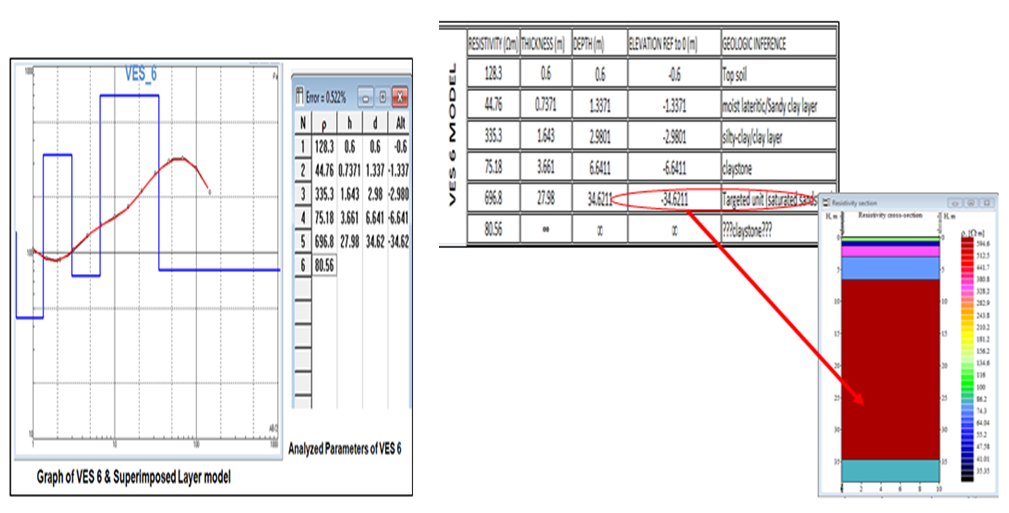 | Figure 8. VES 6. Modelling Result showing the geo-electric layers |

5. Discussion
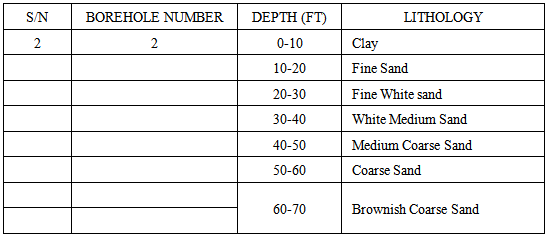
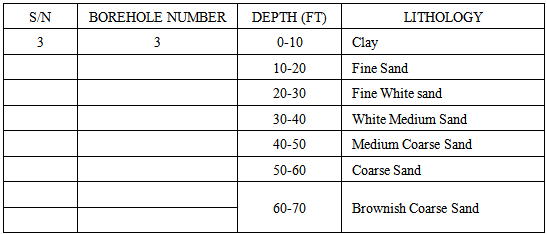
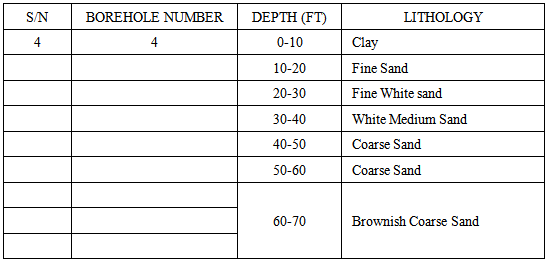
The geo-electrical sections were succinctly derived in order to know and understand their intrinsic geological components of the aquifers beneath each VES site and to determining possible hydro-geophysical/hydro-geological parameters of thickness and resistivity characterising each aquifer. The interpreted result of each VES data points are presented from fig 3-8. The boreholes logs are presented from table (1-4). Four boreholes were drilled with 7’’ drag bits to the depth of 35-40m, and casing was done immediately. The screen and casing were loaded into the borehole and was back flashed immediately after the installations. The borehole casing were made of 6’’ UPVC casing and the screen were 6’’ also the screen, casing shoe, casing were lowered carefully into the boreholes and was hanged. The borehole logs confirm homogeneous lithology in all the four boreholes drilled. Aquifers were encountered at the same depths (table 1-4). The boreholes logs further envisaged brownish and coarse sand with stained precipitate as the aquifers in which casing was done. The groundwater distribution network appears to be homogeneous; the depth to the water table is shallow which can fluctuate seasonally.Table 1. Litho-log of Borehole 1
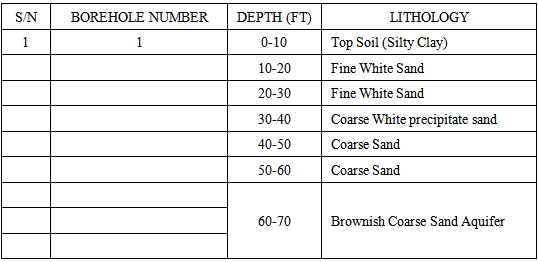 |
| |
|
Table 2. Litho-log of Borehole 2
 |
| |
|
Table 3. Litho-log of Borehole 3
 |
| |
|
Table 4. Litho-log of Borehole 4
 |
| |
|
In VES 1 (fig 3), five sounding layers were delineated with resistivity ranges of (38-1018Ωm), indicating topsoil, lateritic sandy clay layer, silty/clayed sandy layer, saturated sand and silty/clayed sand layer. However from geo-electric sections of VES 1 (fig 3), the highest resistivity is delineated at the fourth layer with a resistivity value of (1018Ωm) and thickness of (8.1m). The targeted aquiferous zone for groundwater prospecting lies within a depth of 50-65ft. Hence, borehole sitting is recommended within this depth with the spread of VES 1 (fig 3). Five geo-electric layers were delineated in VES 2 with a resistivity and thickness range of (65-999Ωm) and (0.6-18.2m). The subsurface geo-electric layers show- case as top soil (319.9Ωm), sandy clay layer (472.1Ωm), silty clayed sandy layer (335.2Ωm) and saturated sand as aquifer within the VES 2 coverage. However, the target aquiferous zone reflected on the fourth layer. Groundwater abstraction well can be suitable sited at a depth of (30-35ft) in VES 2. The geo-electric layers showing at VES 3 with resistivity and thickness range as (5-1056Ωm) and (26.76m) respectively. The first layer is shown as top soil (93Ωm), the second layer as sandy clay layer (397Ωm), the third and the fourth layers as silty clay/clay layer and saturated sand as aquifer respectively. Groundwater occurrence was reflected at the fourth layer with a resistivity value of (1056Ωm) and appreciable thickness of (26.76m). Hence borehole sitting can be done at depth between (115.5-132ft). Four geo-electric layers were delineated in VES 4 with resistivity thickness ranges of (4-1066Ωm) and (1.33-30.45m). The subsurface stratigraphy is delineated as follows top moist soil (86Ωm, 1.33m), sandy clay layer (456Ωm, 1.6m), silty clayed/clay layer (44Ωm, 3.66m) and saturated sand as aquifer (1066Ωm, 30.45m). The aquiferous target zone for groundwater occurrence was at the forth layer with resistivity value of (1066Ωm, 30.45m). Five geo-electric layers were delineated in VES5point with resistivity and thickness range of (3-1052Ωm) and (1.33-30.91m) respectively. The inferred layer lithology’s are top soil as (86Ωm, 1.337m), sandy clay layer (455Ωm, 1.6m), silty clay/clay layer (44Ωm, 3.66m) and saturated sand (1052Ωm, 30.91). The fourth layer shows more prolific for groundwater occurrence at a resistivity value (44.75Ωm) and thickness (3.66m). For optimal groundwater supply borehole sitting can be made at depth of (115.5-132.5ft). Five geo-electric layers are delineated in VES 6 with a resistivity and thickness range of (44-696Ωm) and (0.6-27.98m). The inferred lithology is delineated as topsoil (128Ωm, 0.6m), silty clay/clay layer (335.3Ωm, 0.73m), clay stone (75.18Ωm, 3.66m) and saturated sand as an aquifer in VES 6(696.8Ωm, 27.98m). The target aquiferous layer with resistivity value of (696Ωm, 27.98m), which validates appreciable groundwater potentials, due to thickness and lithology exhibited. However, a depth of 115.5-132ft is recommended for borehole sitting within this VES area. In essence, the investigated area delineated groundwater potentials confirming more prospects and less in iron concentration within the stated depths of VES 3, 4, 5 and 6 areas.
6. Conclusions
The delineated aquifers in all the VES points were prolific but occur at different depths within the probed area. The thickness of the aquifers varies from 8.15m to 30.91m and the aquifer resistivity values range from (696Ωm-1056Ωm). The geo-electric sections delineated enunciated un-confined aquifers types in the Niger Delta. Geo-electric layers further reflected impermeable layers of the underlying and the overlying aquifers in the area. The depth to groundwater flow is relatively shallow 5m (22.96ft) virtually in all locations. Geophysical findings reveal that the aquifers in the area are vulnerable and groundwater distribution is not uniform as water quality should be guided with due diligence as fluctuation of the groundwater flow will affect the water quality of the aquifers. Consequently, VES 1 and 2 locations, borehole sitting were recommended at depths of 50-65ft and 30-35ft respectively. VES 3, 4, 5 and 6 boreholes sitting were recommended at depths within (115.5-132ft). For proactive optimal groundwater supply within the surveyed area and the probed depth, VES 4 and 5 have the best prospects for groundwater production in the area due to their large aquiferous thickness exhibited. The screen was guided strictly and boreholes were cased by the occurrence of precipitated ferric hydroxide and stained brownish sand confirming the water to good and free from iron concentration.
References
| [1] | Abam, T.K.S., (1999). Dynamics and quality of water resources in the Niger Delta. Impacts of urban growth on surface water and groundwater quality. Proceedings of IUGG symposium, Birmingham, publication no. 259. |
| [2] | Allen, J.R.L., (1965). Late Quaternary Niger Delta and adjacent Areas; Sedimentary Environment and lithofacies AAPG Bull, 48, 547-600. |
| [3] | Amajor, L.C., and Ofoegbu, (1997). Determination of polluted aquifers by stratigraphically controlled biochemical mapping; Examples of the eastern Niger Delta, Nigeria,’’ Groundwater and mineral resources of Nigeria, vieweg, Braunschweig/Wiesbaden, pp62-73. |
| [4] | Egai, A.O., (2013). Environmental impacts of crude oil activities in Aguobiri, Southern Ijaw LGA, and Bayelsa State. Unpublished M.Sc. thesis university of Benin, Nigeria. |
| [5] | Egai, A.O., and Imasuen, O.I., (2013) Geo-electric Characterization of Subsurface crude oil Leachate plume in Aguobiri, Southern Nigeria. Research Journal of Engineering and Applied Sciences (RJEAS) Seattle USA.Vol 2 (6) pp. 427-433. |
| [6] | Fronlch, R.K, Urish, D.W, Fuller, J, Reilly, M.O (1994). Use of geoelectrical method in groundwater pollution surveys in coastal environment. Journal of applied geophysics 32; 139-154. |
| [7] | Idehai, I.M., and Egai, A.O., (2014) Aspects of Geophysical Exploration Using Vertical Electrical Sounding (VES) for Groundwater in Parts of University of Benin, Benin City. Nigerian Journal of Applied Sciences and Environmental Management (JASEM) Vol 18 (1) pp. 21-28. |
| [8] | Mbonu, P.D.C., Ebeniro J.O Ofoegbu C.O and Ekine A.O (1991). Geo-electric sounding for the determination of aquifer characteristics in parts of the Umuahia area of Nigeria. Geophysics, 56; 284-291. |
| [9] | Okiongbo, K.S., and Ogobiri, G. (2011). Geo-electric Investigation of Groundwater Resources in Parts of Bayelsa State, Nigeria. Research Journal of Environmental and Earth Sciences 3(6); 620-624. |


 Abstract
 Reference
 Full-Text PDF
 Full-text HTML


