-
Paper Information
- Paper Submission
-
Journal Information
- About This Journal
- Editorial Board
- Current Issue
- Archive
- Author Guidelines
- Contact Us
Geosciences
p-ISSN: 2163-1697 e-ISSN: 2163-1719
2015; 5(1): 26-30
doi:10.5923/j.geo.20150501.03
Satellite Remote Sensing for Mineral Deposit Assessment of Clay in Mubi Local Government Area of Adamawa State, Nigeria
 Abstract
 Reference
 Full-Text PDF
 Full-text HTML
Adegoke Kayode Martins1, Bulus Luka Gadiga2
1Department of Surveying and Geomatics, Federal Polytechnic, Mubi, Nigeria
2Department of Geography, Adamawa State University, Mubi, Nigeria
Correspondence to: Adegoke Kayode Martins, Department of Surveying and Geomatics, Federal Polytechnic, Mubi, Nigeria.
| Email: |  |
Copyright © 2015 Scientific & Academic Publishing. All Rights Reserved.
The conventional method for hydrothermal altered/Mineral deposits using Lands at TM image is an effective tool in the field of Remote Sensing. The band rationing method was used to create the False Colour Composite (FCC) of the image using Chica-Olma ratio (5/7:5/4:3/1) RGB. This is to enable the identification of spectral reflectance of mineral deposits’ within the area of study, the minerals detected by the use of band rationing RGB composite was then classified using image extraction of Supervised classification (Maximum Likelihood), the method helps in identifying alteration zones in the studied area by virtue of the resulted classified classes. This technique involves selecting individual pixel or a cluster of pixels with known geologic significance and using these as training sites to locate regions with similar spectral characteristics. Field surveys of alteration zones were chosen as a training site for this purpose and classes of alteration were quantified using the classification distribution summary of which clay covers 64.647% of the total area, iron-oxide 4.830% and Ferous oxide 30.523% of the area. Hence, study revealed that the spatial distribution of altered mineral deposites can be effectively mapped using remote sensing techniques thereby reducing the cost of mapping using the conventional methods. The hydrothermal alteration zone using satellite images is restricted to the area covered by the deposits’ but the quantity and types of clay deposit within the spatial location cannot be quantify by this method.
Keywords: Remote sensing, Image classification, Spectral reflectance, Clay, Minerals, Satellite imge, Composites
Cite this paper: Adegoke Kayode Martins, Bulus Luka Gadiga, Satellite Remote Sensing for Mineral Deposit Assessment of Clay in Mubi Local Government Area of Adamawa State, Nigeria, Geosciences, Vol. 5 No. 1, 2015, pp. 26-30. doi: 10.5923/j.geo.20150501.03.
1. Introduction
- The passion for mineral deposits has become a task engaged in by individuals and government at large. The financial enrichment and regional growth enhanced by mineral deposits cannot be over emphasized. Remote sensing produce information on the properties of exploration targets of the surface. Alteration provides mineral deposits that vary by virtue of their locations, degree and longevity of the process. In the previous years, geological maps are prepared using conventional ground survey method based on field observation but the development of image processing changed thee mapping procedures (Abrams, Brown Sadowski 1983). In most of inaccessible areas due to thick forest and terrain, mapping of lithology and alteration zones always posed a challenge on the process (Prost 1980). One major advantages of Remote Sensing is in the synoptic view of large coverage that it provides. It gives the spatial and integrated perspective of different land features, the multispectral high resolution data and digital image processing techniques has enhance the potential of RS in delineating the lithology and geological structures in detail with better accuracy. The multispectral satellite systems are designed to investigate natural resources which focus on vegetation coverage, lithology and mineral exploration. The use of remote sensing in mineral deposits detection is today a generally acceptable means all over the world. It is on this vein that this paper discusses the clay detection of Mubi region using remote sensing and GIS techniques.The band ratio method of Remote Sensing depicts spectral reflectance variation base on the different brightness values, and these differences occurred mainly due to topography, shadow and aspect which are taken care of by the band rationing method and in turn reducing the effects of environmental conditions (Goetz, Rock and Rowan 1983). Ratio technique provide distinctive information that may not be gotten using a single band analysis which is useful in separating surface materials (Jenson 1996). According to Segal, 1983 and Kenea, 1994, Ratio images are good method of enhancing spectral contrasts among image bands and this have been successfully used in several mapping of alteration zones.
2. Study Area
- The study area is MubiNorth and MubiSouth Local Government Areas of the Northeastern part of Adamawa State, Nigeria and is located between latitudes 10° 11 '30” and 10° 22' 30”N and between longitudes 13° 13' 00’’ and 13° 30’ 00” 'E (Figure 1). The area is drain by River Yadzaram. It is one of the major rivers that drain into the Lake Chad. It has a total length of about 330 kilometer (Uba Topographic sheet 156, Edition 1, 1974). It takes it source from the Hudu hills south-east of Mubitown and flows northward into the Chad (Adebayo and Dayya 2004).
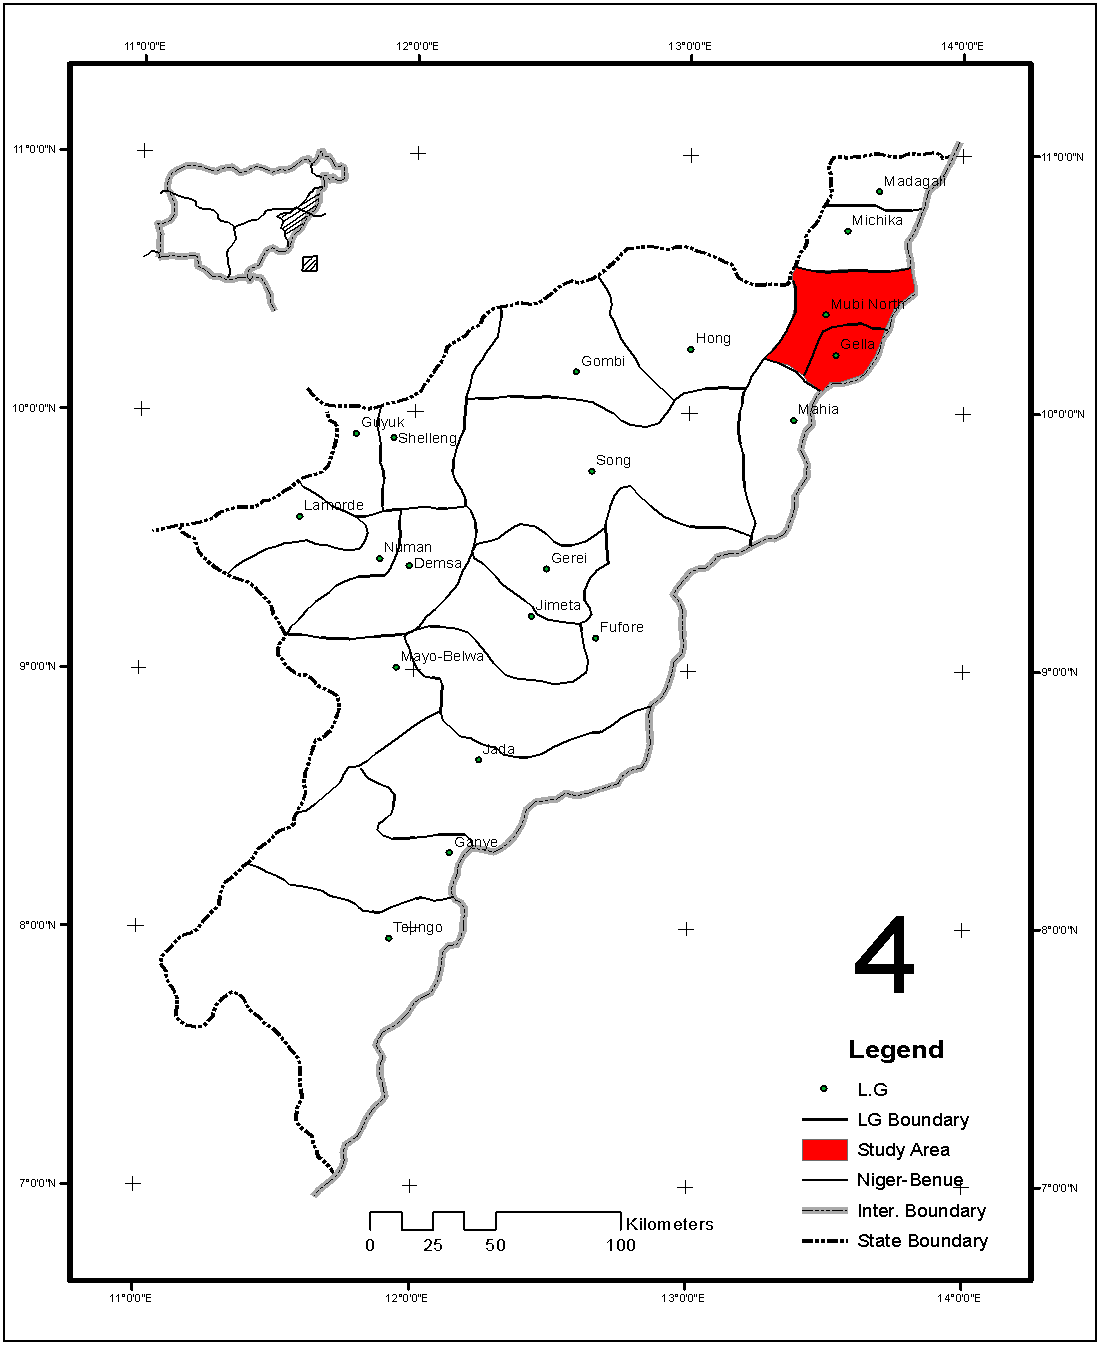 | Figure 1. Administrative Map of Adamawa State showing the Study Area |
3. Methodology
- In this paper, the band rationing was used to create the False Colour Composite (FCC) image (Figure 2). This enables the identification of spectral reflectance in detecting the mineral deposits within the area of study. The minerals detected were then classified using image extraction base on supervised classification. The method helps in identifying alteration zones in the studied area. This technique involves selecting a pixel, individual pixels, or a cluster of pixels with known geologic significance and using these as training sites to locate regions with similar spectral characteristics. Field surveys of alteration zones were chosen as a training site for this purpose and classes of alteration were quantified in percentage of area cover.
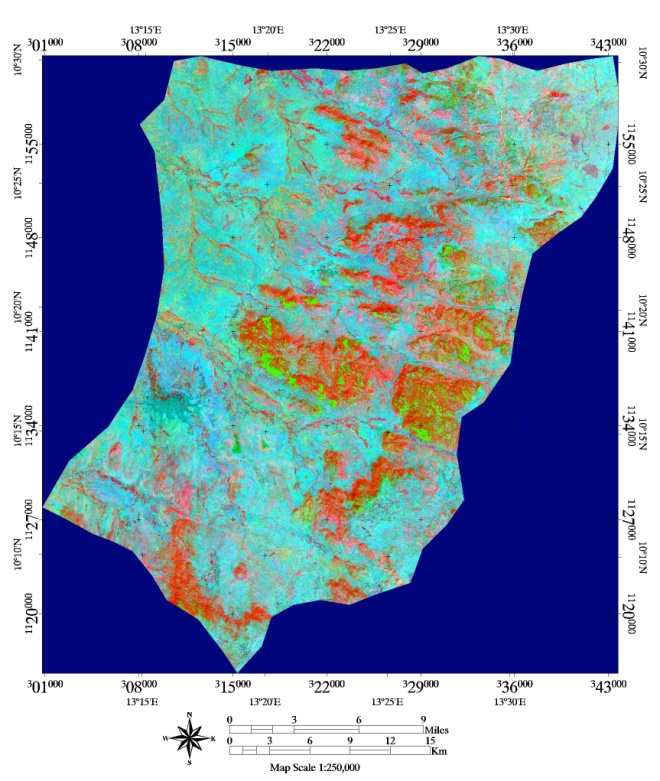 | Figure 2. Composite (RGB) Image of the area using band ratios 5/7:5/4:3/1 |
4. Results and Discussions
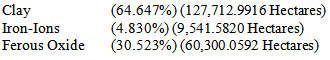
- For the purpose of this paper, the Chica-Olma Ratio was used to detect alteration of the deposits where red colour depicts Clay, Iron-ions were in green colour, and Ferous Oxide represented in blue colour. The ratio pattern is described as shown in figure 2. The band ratio of 5/7:5/4:3/1, were the three used for the (RGB) composite, these ratios was used because of the easy interpretation of the colour reflectance in depicting the spatial mineral deposites using the LandSAT image.After using the conventional alteration mapping methods on the Landsat image in the study area, we found that the colour composite and band ratio methods showed their efficiency to define the area of hydrothermal alteration which illustrated the clay, iron-oxides and hydroxyl altered minerals area of this region very clearly.The altered mineral deposits were mapped and the spatial distribution of clay covers 64.647%, iron-oxide 4.830% and Ferous oxide 30.523% and was successfully mapped using ENVI mineral detection approach which shows a very efficient tool to identify the specific hydrothermal altered minerals using LandSAT TM. The study further revealed that the clay mineral in Mubi is more concentrated towards the South-Central. Thus, it is quite clear that this method is quite efficient to delineating hydrothermal alteration products using Landsat ETM+ images.
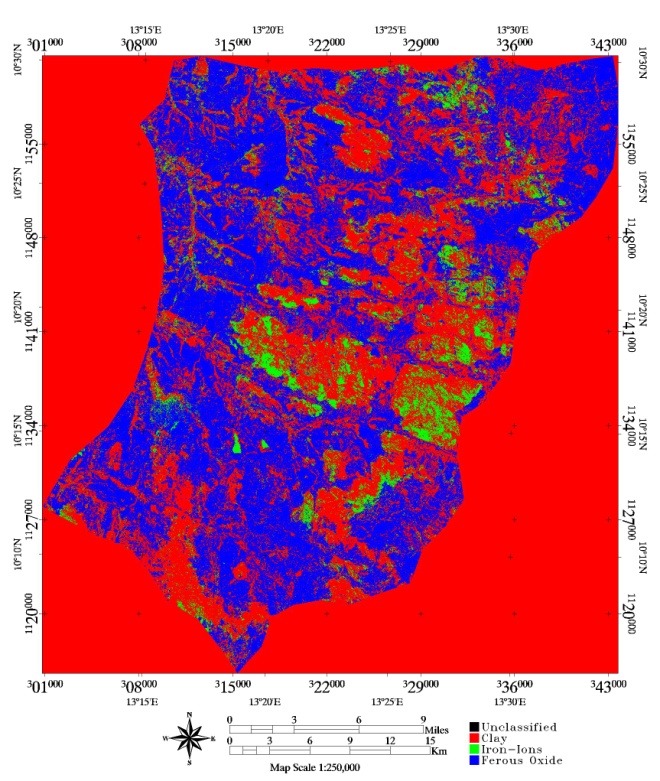 | Figure 3. Classified image showing spatial distributions of Clay deposits |
5. Conclusions
- The study revealed that the spatial distribution of altered mineral deposits can be effectively mapped using remote sensing techniques thereby reducing the cost, time and resources expended on mineral mapping using conventional methods. Thus, mineral exploration companies will greatly benefit by reducing cost if remote sensing is incoperated in their operation.