-
Paper Information
- Previous Paper
- Paper Submission
-
Journal Information
- About This Journal
- Editorial Board
- Current Issue
- Archive
- Author Guidelines
- Contact Us
Geosciences
p-ISSN: 2163-1697 e-ISSN: 2163-1719
2015; 5(1): 8-25
doi:10.5923/j.geo.20150501.02
Satellite Imagery for Structural Geological Interpretation in Western Sirt Basin, Libya: Implication for Petroleum Exploration
 Abstract
 Reference
 Full-Text PDF
 Full-text HTML
Abdunaser K. M.
Libyan Petroleum Institute, Libya
Correspondence to: Abdunaser K. M., Libyan Petroleum Institute, Libya.
| Email: |  |
Copyright © 2015 Scientific & Academic Publishing. All Rights Reserved.
Interpretation and analysis of Landsat imagery, integrated with published geological maps, has provided the basis for a re-examination of the structural geology of the area, and has enabled a new interpretation of the tectonic development of the western part of the Sirt Basin to be made. In addition to detecting normal faults, and strike-slip fault systems, a number of important fold structures were mapped and analysed using the imagery, and the resulting maps represent an improvement on existing publications. Tectonic features, particularly folds and faults near the basin margin, may provide traps for hydrocarbon accumulations. Direction statistics and rose diagrams for all the interpreted linear features acquired in the study area were prepared and calculated which given as a total distribution and then the totals are broken down by the major basin elements of the area. Hundreds of lineaments were recognized. Their lengths, range between a hundred meters up to hundreds of kilometers long and the dominant trends are between N25W and N55W which coincides with Sirt Basin structures. The correlation between surface linear features and subsurface oil and gas traps was assessed, and the implication of using surface lineament and fracture analysis for delineating hydrocarbon reservoirs in the region discussed. It was observed that the surface linear features were extremely consistent in orientation with the basement faults in the Sirt Basin region suggests that the systematic fault systems at the basement in the study area have probably been reactivated many times and have propagated upward all the way to the surface. They may have acted as the loci for the development of other geological structures, including oil and gas traps. Indication of the relative timing of structures and movement along faults has been determined where possible. The results presented in this paper prove the validity and indicate the significance of using surface linear features for inferring subsurface oil and gas reservoirs in the study area. Any new potential oil and gas reservoirs in the study area, if they exist, will be likely associated with the northeast- and northwest-trending surface lineaments and fracture traces in the region.
Keywords: Sirt Basin, Rose diagrams, Surface lineament, Normal faults, Relay ramp
Cite this paper: Abdunaser K. M., Satellite Imagery for Structural Geological Interpretation in Western Sirt Basin, Libya: Implication for Petroleum Exploration, Geosciences, Vol. 5 No. 1, 2015, pp. 8-25. doi: 10.5923/j.geo.20150501.02.
Article Outline
1. Introduction
- Geological mapping is evolving from the conventional field survey to the use of remote sensing technologies. The remote sensing technology were useful and has shown a great promise for large-scale geological mapping to identified of structural features, such as faults and folds. In addition the integrating of remote sensing data and geographical information systems (GIS) technique has further improvised the geological mapping techniques.In other hand remote sensing provides a relatively inexpensive and quick method for assessing the exploration potential of large areas. Satellite sensors and data processing techniques can now provide enhanced resolution data, both spatially and spectrally, as well as three-dimensional models of an area.In this study a regional-scale structures have been mapped using remote sensing techniques, particularly lineament analysis, and the digitization of pre-existing geological maps. Fault structures at this scale were interpreted from Landsat enhanced Thematic Mapper (ETM) and Google Earth data. So, this paper, contributes new findings based on an integrated approach utilizing data from the various disciplines of remote sensing, and existing geological maps in the NW portion of the Sirt Basin. The aim of the study was to critically review the existing body of knowledge on the structural geology of the western part of the Sirt Basin and to build a new understanding based on my own interpretations of used data. These new insights provide a basis for a new exploration strategy that could stimulate future petroleum exploration activities in the study area.
1.1. Location of the Study Area
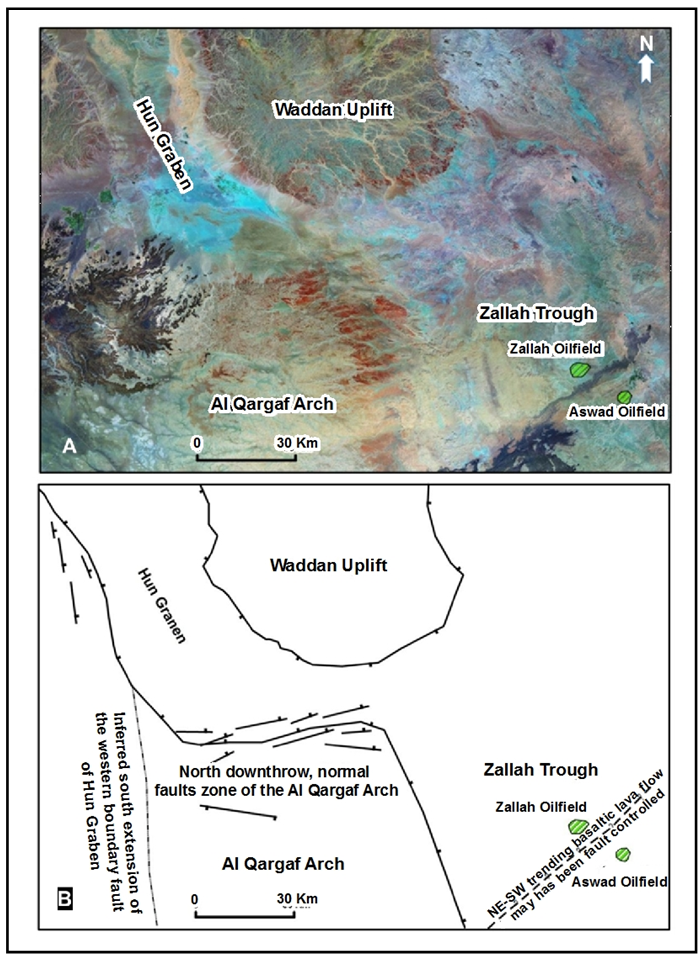
- The Sirt Basin in north-central Libya (Figure 1) covers an approximately 600,000 km² area that is bordered to the east by the block-faulted region of the Cyrenaican Platform, including Al Jabal al Akhdar, and extend as far as the Dakhla Basin in Egypt. It is bounded to the south by the Tibisti Mountains and the Al Kufrah Basin to the southeast, to the west by the Nafusah, Al Qargaf Arch, the Ghadamis-As Sawda and Murzuq Basin, and the Mediterranean Sea to the north. This study is focusing mainly on north western Sirt Basin, Libya between 1500’ E to 1830’ E and 2800’ N to 3130’ N (Figure 1).
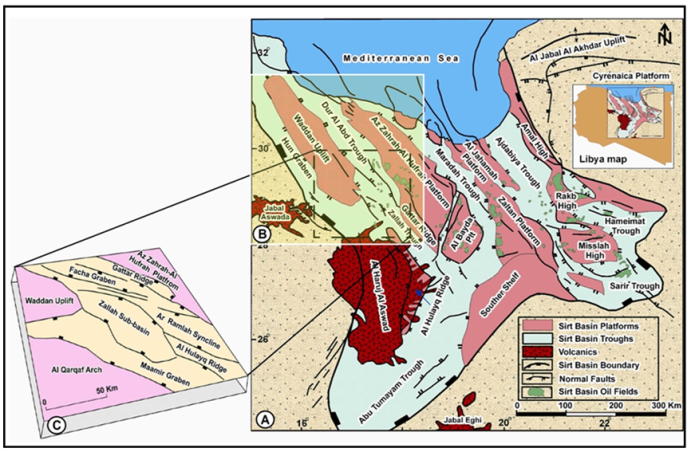 | Figure 1. A) Generalized tectonic map of the Sirt Basin as located in the north central Libya map (Modified after Abadi, 2002 [27]) showing the major structural elements and oil and gas fields, B) Location of the study area, C) Dashed box marks the Zallah Trough area with its structural domains referred to in the text. Inset illustrates the Libya map |
1.2. Database and Methodology
- A large database containing information about structural features such as faults, folds and fractures was produced in the form of GIS thematic layers enabling interpretation and analysis. This information was then integrated using GIS software and used to construct a range of thematic maps. Geographical Information Systems (GIS) have proved to be ideal for that purpose [1]. A GIS can be used for data capture, storage, analyses, prognostication, presentation, and follow-up and constitutes an excellent tool for modelling work. It is important to start building the GIS database at an early stage of any project, enabling data interpretation and prognostication as soon as enough data have been entered into the system.In specific the main purpose of conducting this remote sensing interpretation is to identify faults and fractures as well as major stratigraphic boundaries.Imagery data from Google EarthTM and MrSid (Multi-resolution seamless image database) covering the entire study area were used for the remote sensing component of this study. The Google EarthTM were used for this study because it provided the highest resolution data and is available free. The structural interpretation was performed digitally on-screen using ArcGIS software and then summarized as major faults in the region. The satellite imagery provided effective images on which to map the surface geological structure and geomorphology of the region and therefore enables validation of existing geological mapping.In addition to the satellite imagery, 1:250,000 scale published geological maps and accompanying reports were also used during the interpretation. The maps were scanned and geo-referenced to the satellite imagery.An orientation analysis was performed, and correlations between surface structures and subsurface oil and gas traps were investigated. The significance of using surface faults and fracture analysis for delineating additional traps in the region was assessed.The other satellite date used was MrSid imagery (Figure 2) with a Landsat TM (Thematic Mapper) band combination 7,4, and 2 as red, green and blue, which combines spectral information from the near- to mid-infrared part of the electromagnetic spectrum and therefore highlights features that would otherwise be invisible to the naked eye. This type of band combination enables interpretation of geological structure as well as spectral discrimination of surface lithologies [2, 3].
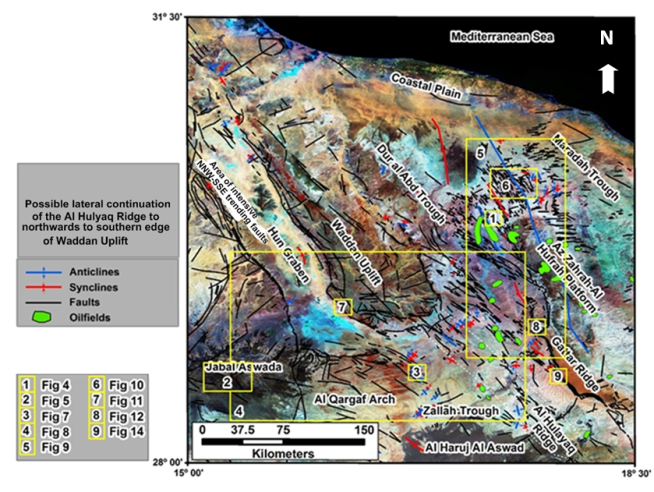 | Figure 2. MrSid imagery that covers the study area showing the interpreted surface faults and folds, the location of the structural domains and other key structural features with figures locations |
1.3. Geological Setting of Sirt Basin
- The Sirt Basin is a wide Meso-Cenozoic rift basin (Figure 1) composed of several troughs separated by intrabasin highs deepening towards the east, played as an aborted intracontinental rift of Late Cretaceous age considered to be typical of a Tethyan extensional rift system, began in the Early Cretaceous and peaked in the Late Cretaceous [4, 5]; [6], with active rifting initiated possibly in the Early Cretaceous [7], which might reactivating pre-existing Paleozoic tectonic lineaments [8, 9], possibly triggered by Cretaceous lithosphere-plume interaction [10], even though, the [11] opine that the major subsidence is recorded only later in Late Cretaceous–Eocene, over the entire basin.In the Alpine-related tectonic pulses during Middle–Late Eocene the Sirt Basin underwent compression resulted in northward tilting of the basin, causing abrupt subsidence in the north and uplift on the basin southern shoulders, possibly driving the latest stage of regional minor subsidence [12]. The complex tectonic and sedimentary history of the Sirt Basin has resulted in multiple reservoirs and conditions that favoured hydrocarbon generation, migration, and accumulation. Most oil pools discovered are located on horst structures at relatively shallow depths. Production in the Sirt Basin comes from more than 20 intervals ranging in age from Precambrian to Oligocene, but the most important finds have been in the Lower Cretaceous Nubian sandstone, although Palaeocene reefs are also important reservoirs.
2. Surface Structures Analysis
- The major faults systems were defined very clearly based on the satellite image mapping and the published geological maps (Figures 2 and 3). Most of the lineaments measured on remote sensing imagery were linear segments of stream valleys or other geomorphological alignments. These alignments are assumed to have formed as a result of differential erosion along lines of weakness (fracture zones) in the crust, produced by numerous episodes of tectonism. The main NW to NNW trending faults trend are up to tens of kilometers long. Viewed at different scales, the faults are offset by NNE trending 'hard-linked', oblique-slip transfer faults. The combined effect is a characteristic rhomboidal or zigzag fault pattern.
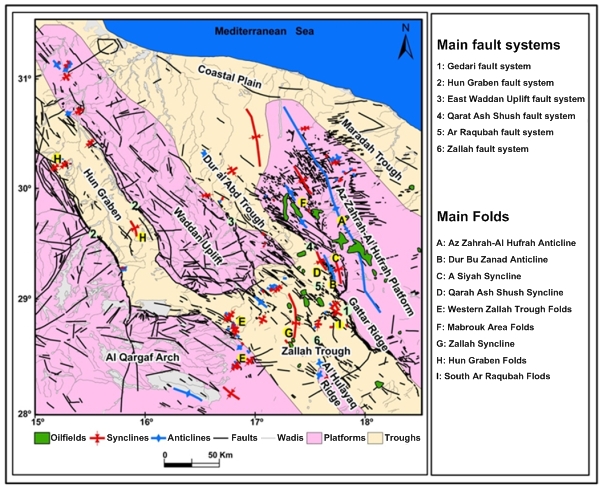 | Figure 3. The location of the main interpreted fault systems and folds overlaid on the structural map which has been interpreted from satellite imagery |
 | Figure 4. Example of fault related folds as they appear on satellite imagery. They are located sub-parallel to and bounded by the offset fault zones as well. For location see fig. 2. (adapted from Google Earth) |
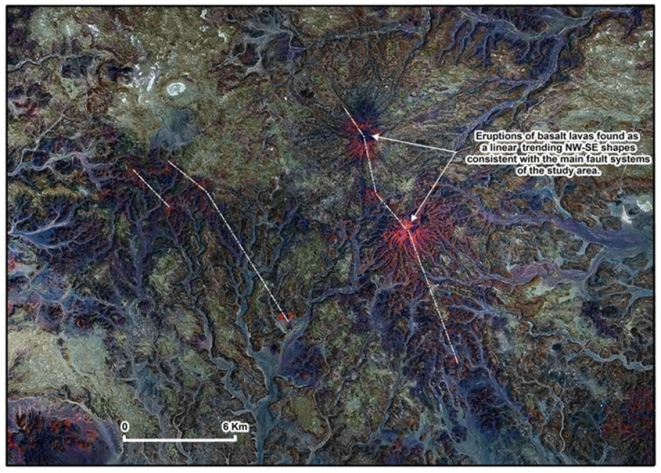 | Figure 5. Example of basalt lavas eruptions which found in the southern part of the study area form linear trending NW-SE shapes consistent with the main fault systems of the study area. For location see fig. 2 |
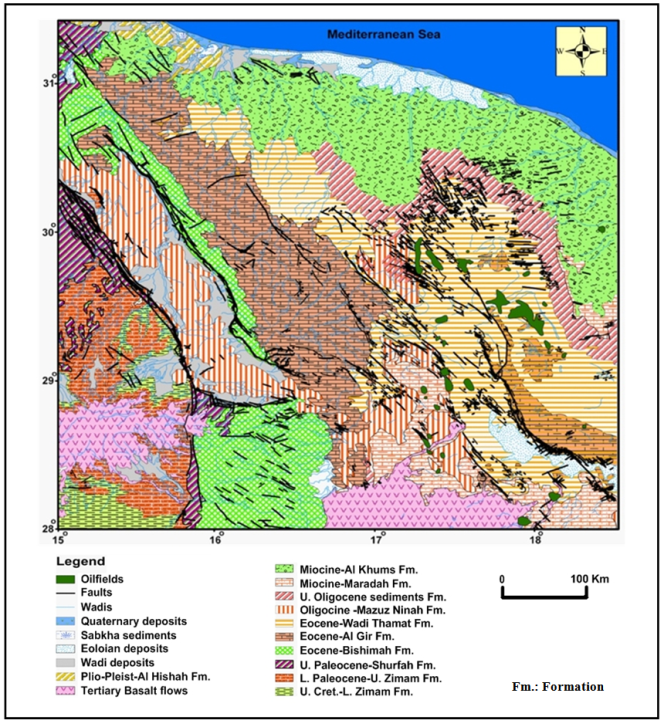 | Figure 6. Simplified surface geologic map of study area shows the exposed rock units, and oilfields compiled after Vesely, (1985) [13], Jurak, (1985) [14] and Anketell & Kumati, (1991) [21] |
3. Basin Elements and Geotectonics of the Area
- The satellite image interpretation integrated with the surface geological maps shows that the study area contains several basinal and geotectonic elements; namely, the Zallah, Dur al Abd, Maradah, Hun Graben, the Waddan Uplift, Gattar Ridge, the Az Zahrah-Al Hufrah Platforms, the Al Qargaf Arch, and the intrabasinal Al Hulayq Ridge (Figures 2 and 3).The study area can be divided into a number of tectono-stratigraphic domains based on the following criteria:• Structural grain, i.e., the dominant trend of faults and associated folds.• Homogeneity and orientation of bedding.• Relative intensity of faults and fractures.• Style of deformation.• Surface stratigraphy.• Structural geomorphology including drainage pattern and morphology.Using these criteria the following structural elements were identified from the data used. The structural domains generally show good internal correlation and are consistent with the known regional tectonic elements of the Sirt Basin.
3.1. Zallah Trough
- The Zallah Trough (Figures 2 and 3) is situated in the southern part of the study area and is an asymmetrical faulted graben which connects northwards with the Dur al Abd Trough and southwards with the Abu Tumayam Trough where they appear more or less as a continuous low NW-SE trending embayment. It is bounded by the Waddan Uplift to the northwest, the Al Qargaf Arch to the southwest and the Az Zahrah-Al Hufrah Platform to the east. On the basis of satellite image mapping and the published geological maps [13, 14] the Zallah Trough is divided into a number of sub-basins (Figure 1): the Facha Graben, Ar Ramlah Syncline, Zallah Sub-basin and Ma‘amir Graben [15, 16]. The Al Hulayq Ridge (Figures 2 and 3), projects into the area from the south, and forms a spur that divides the Ar Ramlah Syncline, to the east and the Ma‘amir Graben to the west, and then passes beneath the Al Haruj Al Aswad volcanic centre to the south. Due to down-faulting, the deepest part of the trough lies on the NE side of the axial Al Hulayq Ridge and the southwestern Az Zahrah-Al Hufrah Platform, with the Gattar Ridge recognized.This interpretation reveals that the Zallah limits are reasonably well defined at surface and from satellite images (Figures 6 and 2). The Zallah Trough is connected with the Hun Graben to the northwest by a complicated zone of wrench tectonics whose extension beneath the Al Haruj al Aswad volcanics remains uncertain. The Zallah Trough is an extremely complex area in terms of structural relationships in the western Sirt Basin.Towards the northwest the Zallah Trough is bounded by several east trending, south downthrowing faults that are part of a normal fault zone that defines the southeastern margin of Waddan Uplift.The southwestern margin is bounded by a north and east downthrowing, normal fault zone of the Al Qargaf Arch. Some large triangular bedding facets or ‘flat-irons’ of the exposed sediment along the western side of the trough indicate eastward dipping strata into the trough along the eastern end of the Al Qargaf Arch (Figure 7).
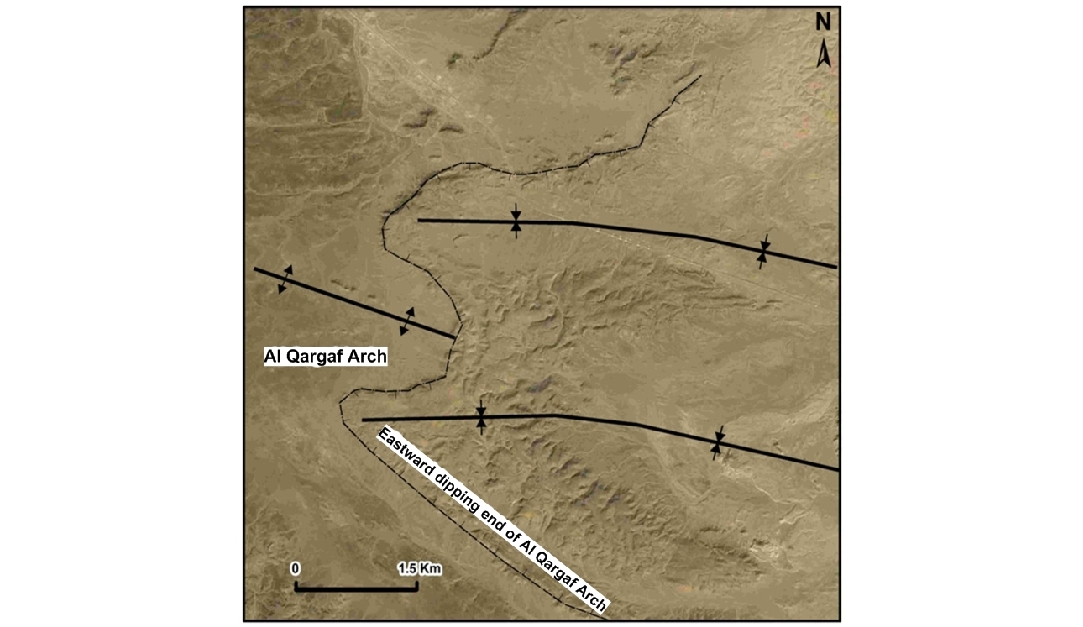 | Figure 7. Some large triangular bedding facets or ‘flat-irons’ in exposed sediment along the western side of the Zallah Trough indicate eastward dipping strata into the trough along the eastern end of the Al Qargaf Arch. (For location see fig. 2) |
 | Figure 8. (A) The southern portion of Hun Graben as appears on satellite imagery. (B) Satellite imagery interpretation of the southern portion of the Hun Graben suggests that it extends beyond the E-W cross-cutting fault and may link to a major NNE-SSW trending fault system to the south that is covered by lava flows of Jabal Al Aswda. For location see fig. 2 |
3.2. Dur al Abd Trough
- The Dur al Abd Trough (Figures 2 and 3) represents a more or less continuous elongated low of three troughs, including Dur al Abd, Zallah and Abu Tumayam Troughs from north to south respectively which runs from the Sirt embayment coast in the north to the southern (shelf) boundary of the Sirt Basin. Some authors believe that the Zallah Trough narrows northwards and becomes shallower to form the Dur al Abd Trough [18].The Dur al Abd Trough separates the Az Zahrah-Al Hufrah Platform from the Waddan Uplift in the area of the Mabruk field and it is difficult to follow north of the Mabruk field where it loses its identity in the faulted northeast flank of the Waddan Uplift. The Dur al Abd Trough is a 50km wide NW-SE trending, fault bounded graben in the Mabruk area but broadens out further south and has greatest fault displacement in the east. It extends approximately 175km northwards from the Facha field. The Dur al Abd, and Zallah Troughs seem to be in the first instance a continuous trough that follows the NNW-SSE trending structural grain of the region, however the data reveal a structure that acts as a bridge that separates them from each other possibly extending from northern Gattar Ridge to the southeastern part of the Waddan Uplift (Ar Raqubah fault system, (Figure 3). The Dur al Abd Trough is extensively faulted and characterized mainly by two fault trends, one that is parallel to the NNW-SSE dominant fault trend of the Sirt Basin and has an associated subsidiary later ENE-WSW transverse fault set and a second N-S trending fault set that are evident on the northeastern dipping flank of the Waddan Uplift and extend into the Dur al Abd Trough. Displacement across the graben bounding faults is approximately 250m [19, 18].Based on this surface interpretation it is difficult to split the northern extension of Dur al Abd Trough from the adjacent Az Zahrah-Al Hufrah Platform to the east.The Mabruk field is the only field that lies within the Dur al Abd Trough with the Facha field on its faulted western flank on the Az Zahrah-A Hufrah Platform.
3.3. Az Zahrah-Al Hufrah Platform
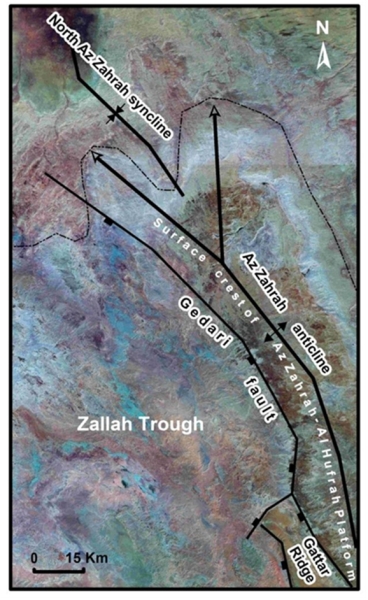
- The Az Zahrah-Al Hufrah Platform (Figures 2 and 3) is located in the eastern part of the study area between the Dur al Abd and Zallah Troughs to the west and the Maradah Trough to the east and is bounded on the south by the NNE-SSW trending Kotlath Graben which separates it from Al Bayda Platform (Figure 1). On its southwest margin, the Gattar Ridge is formed by downfaulting to the WSW. The platform occupies a 40,000 km² area and dips towards the northeast with a northern boundary that is poorly defined and may be affected by wrench-faulting close to the present coastline [20]. The western platform boundary fault in the SW region is characterised by a complex series of en echelon faults indicating a sinistral strike-slip movement, with associated riedel shears forming small-scale horst and graben structures during the Eocene [21].The western platform boundary fault (Gedari fault) lies close to the assumed junction between the basement west and east African plates, which were active during the Cretaceous and reactivated as sinistral wrench faults in the Eocene time [20, 22] as shown in Figure 1.This western boundary fault zone of the Az Zahrah-Al Hufrah Platform is defined by: NNE-SSW trending monoclinal flexures in the bedding (Figure 4) which provide a sense of relative downthrow across the fault zone. The northeasterly tilt of the platform occurred during the post-Eocene and is associated with extensive faulting and fracturing with identification of the main faults trending NNE-SSW being considered as a reactivation of pre-rift faults, NW-SE Cretaceous syn-sedimentary faults and NNW-SSE Late Eocene (post-rift) faults [19, 23, 15]. Faults within the platform have generally less than 60m displacement whereas the platform bounding faults have 800-1000m displacement [24, 19, 23, 15, 18]. From a surface perspective, the northern end of the platform is expressed at surface by a homoclinal shallow northeast dipping panel predominantly of U. Eocene Wadi Thamat Formation. An elongate erosional window occurs along the western margin of the platform exposing the M. Eocene Al Gatta Member.Large SW dipping triangular bedding facets of the lower member of the Oligocene sediments help to define the limits of the platform at surface forming elongated synclines parallel to the western platform boundary faults (Figure 4). The Az Zahrah-Al Hufrah Platform at the northern end (Figure 9) is marked by a two north-northwest plunging nose of a large low-amplitude gentle flexures anticlines which are expressed by erosional features and surface geomorphology. An anticlinal monoclinal fold (Figure 3) defines the western margin of the dominant fault trend within the platform is NNW-SSE with subsidiary E-W to ENE-WSW trending faults (Figure 4) consistent with the Sirt Basin structures. Combination of the NNW-SSE and ENE-WSW trending faults impart a grid-like pattern that resembles crosscut fault structures (Figure 10). The Az Zahrah Al Hufrah Platform comprises carbonates of the Lutetian to Priabonian (Eocene) Wadi Thamat Formation (Figure 6) and is outcrop equivalents to major deeper hydrocarbon reservoirs specifically in the eastern portion of Sirt Basin.
 | Figure 9. Satellite (MrSid) imagery showing the northern end of Az Zahrah-Al Hufrah Platform which is marked by a two north-northwest plunging nose of large low-amplitude gentle flexures anticlines which are expressed by erosional features and surface geomorphology. For location see fig. 2 |
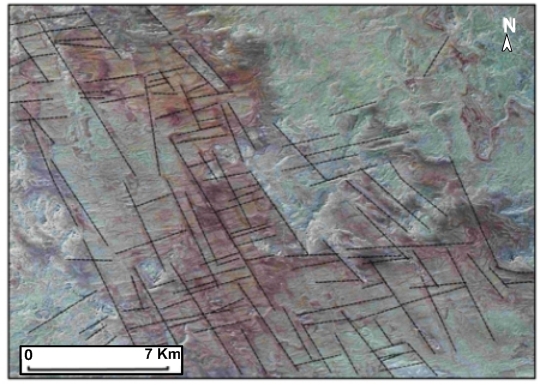 | Figure 10. Satellite (MrSid) imagery showing a combination of the NNW-SSE and ENE-WSW trending faults that impart a grid-like pattern that resembles crosscut fault structures at the northern end of Az Zahrah-Al Hufrah Platform. For location see fig. 2 |
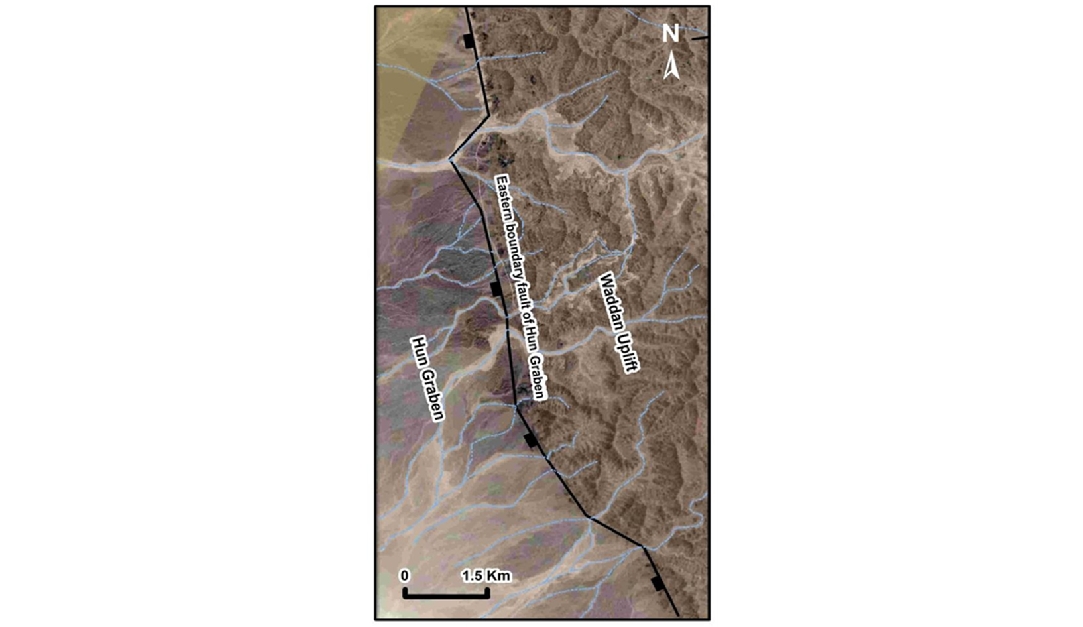
3.4. Hun Graben
- The Hun Graben (Figures 2 and 3) is an elongated structure feature measuring 300km long and averaging 40km in width, has a distinct surface expression and forms a present day fault bounded depression indicating that it is one of the youngest tectonic elements in the region. The development of the Hun Graben, however, is controversial. [25] indicated that the graben was downthrown 500-800m relative to the Tripoli-Tibesti Uplift (Figure 1) and also suggested that the graben was initiated prior to the Late Cretaceous and that the western margin was Paleocene in age. [26] estimated a vertical throw of 100-120m and an Oligocene age for the development of the graben whilst [27], suggested the major faulting occurring in post-Oligocene time.The graben narrows at the southeast near the town of Hun (Figures 2 and 3) and its connection with Zallah Trough is complicated by strike-slip faulting. The structure underlying the Al Haruj al Aswad volcanics is uncertain, but [25] inferred the presence of a remnant of the Palaeozoic Kalanshiyu Trough below the volcanics. Based on the drainage pattern analysis (Figure 6) the Hun Graben appears to cross-cut existing southwest draining wadi channels. Along the eastern margin of the basin, (Figure 11) wadis are generally narrow and become incised as they approach the margin of the graben indicating that they have been rejuvenated by a relative drop in the surface elevation within the graben.This is evidenced by a relatively linear major northeast draining channel present on both flanks of the Hun Graben. The drainage channel is deflected as it enters the Hun Graben due to normal faults and related gentle folding of strata adjacent to the faults. These relationships imply that the palaeo-drainage (at least pre-Oligocene age) was to the northeast and was subsequently modified by development of the Hun Graben in the Oligocene. Drainage within the graben is characterized by large arcuate drainage channels or Wadis (dry valleys) in the Hun Graben. The shape of these wadis reflects the deflection of the drainage channels along the bedding contact between relatively hard and soft lithological units, which have been deformed into a subtle synclinal warp (Figure 11). A northward draining NNW-SSE trending axial drainage system is located mainly along the eastern margin of the graben.
 | Figure 11. Satellite (Google Earth) imagery showing wadis along the eastern margin of the Hun Graben are generally narrow and become incised as they approach the margin of the graben indicating that they have been rejuvenated by a relative drop in the surface elevation within the graben. For location see fig. 2 |
3.5. Waddan Uplift
- The Waddan Uplift (Figures 2 and 3) is a gentle north-northeast tilted block, approximately 250km long with a width of 105km in the south, narrowing to 75km in the north before it disappears below the coastal plain. The uplift terminates in the south against the northeastern extension of the Al Qargaf Arch (Figure 8). The dominant fault trend is NNW-SSE with a subsidiary orthogonal set trending ENE-WSW (Figure 2). The northeastern margin of the Waddan Uplift is extensively faulted due to dextral shear along a WSW-ESE basement fault [20].The southern end of the uplift has a convex morphology to the south and is characterised by a discrete fault bounded margin with downthrow to the southwest, south and southeast. The western boundary is marked by the eastern boundary fault of the Hun Graben (Figure 8). The topographically highest point of the Waddan Uplift is located towards the southern end. This area characterised is by radial drainage although the crest of the structure is marked by NNW-SSE trending drainage divide, located some 20km east of the western faulted margin of the Waddan Uplift.The internal structure of the Waddan Uplift is comparatively simple with a NNW-SSE trending trellised drainage pattern controlled by NNW-SSE trending, south-southwest downthrowing normal faults (antithetic to the northeast to north-northeast drainage direction). The northern half of the platform (Figure 3) is characterised by a north and north-northeast-trending dendritic drainage pattern down the sub-horizontal dip slope of the structure. A more organized trellis drainage pattern is developed towards the northern end of the structure parallel to the NNW-SSE and ENE-WSW trending fracture system.Elongate erosional escarpments of more resistant lithologies and/or fault scarps may also control linear NNW-SSE trending Wadi channels. The southeastern part of the Waddan Uplift appears to be associated with a downthrown fault block which is defined by a broad low amplitude anticlinal structure developed in Wadi Thamat Formation.
3.6. Gattar Ridge
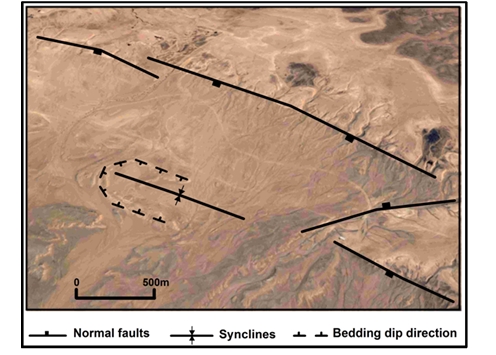
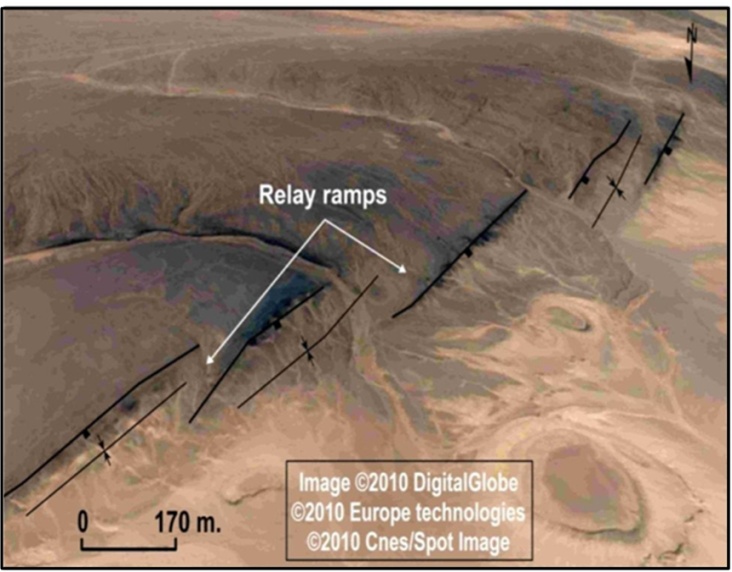
- The Gattar Ridge (Figures 2 and 3) is coincident with a 15km wide, 120km long NNW-SSE trending northeast tilted panel of Al Jir Formation at surface. It appears as a terrace adjacent to the south western boundary fault of Az Zahrah-Al Hufrah Platform which projects into the eastern side of the Zallah Trough. The western edge of the fault block is bounded by a fault zone up to 1km wide, consisting of overlapping parallel normal faults consistently downthrowing to the west. It is also characterized by segmented normal faults with relay ramp structures associated with horsetail splay faults that may indicate a component of sinistral strike-slip (Figure 12).
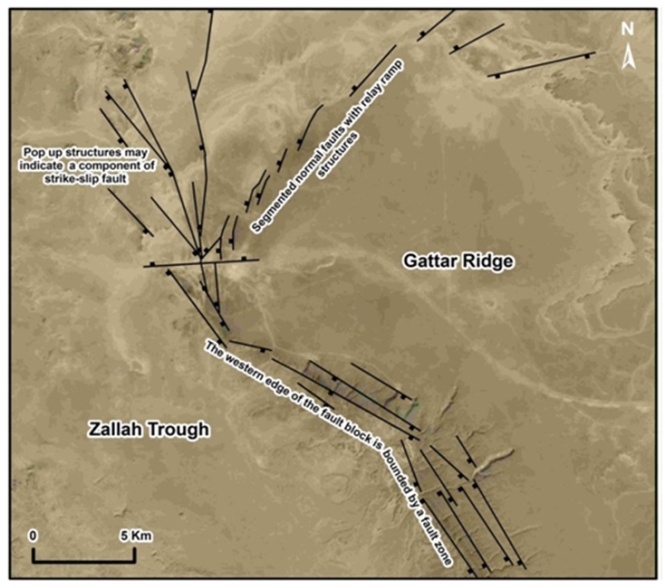 | Figure 12. Segmented normal faults with relay ramp structures associated with horsetail splay faults that may indicate a component of sinistral strike-slip as interpreted from satellite (Google Earth) imagery. For location see fig. 2 |
3.7. Maradah Trough
- The Maradah Trough (Figures 1, 2 and 3) is located in the northeastern portion of the study area and is a deep, narrow, NW-SE-trending basin bounding the Az Zahrah-Al Hufrah Platform to the west and swings to a NNE trend around the southern termination of the Al Baydah Platform and then shallows rapidly to the southeast onto the Southern Shelf. In the north, the Maradah Trough narrows and shallows rapidly between the Az Zahrah-Al Hufrah Platform and the Shammar and An Nawfalfyah Highs. North of this it widens and deepens again towards the Sirt Gulf [20]. The dominant fault trend bounding the trough is NNW-SSE with subsidiary NNE-SSW trending consistent with the Kotlath Graben and the basin southern shelf towards the south (Figure 1).
3.8. Al Hulayq Ridge
- The Al Hulayq Ridge is a NNW-SSE trending narrow basement ridge or horst block which protrudes into the southern part of the Zallah Trough (Figures 2 and 3). The western margin of the high is structurally complex and associated with a series of drag folds developed within Paleocene-Eocene strata. The folds create hydrocarbon traps and may represent part of a flower structure which formed in response to dextral shear during the Oligocene [28].The surface structure appears to suggest that there is a lateral continuation of this feature northwards to the southern edge of the Waddan Uplift (Figure 2). The Hakim and Fidda oil fields are on strike with the Al Hulayq Ridge, while two broad, low amplitude periclines at surface may be related to the reactivation of faults bounding the Al Hulayq Ridge. The fields are expressed at surface by periclines developed mainly in Eocene Wadi Thamat Formation. The Zallah fault system bounds the Al Hulayq Ridge on both sides from the Ar Ramlah Syncline to the east and the Ma‘amir Graben to the west (Figure 1). This fault system forms a series of NNW trending fault segments arranged as overlapping normal faults downthrowing to the SW, changing to NE throw when the fault bounds the Al Hulayq Ridge on the east side.
3.9. Al Qargaf Arch
- The Al Qargaf Arch (Figures 2 and 3) is an E-W trending Hercynian structure located on the southwestern edge of the study area and exposes Palaeozoic strata (outside of study area) onlapped by Oligocene cover rocks. Regionally the structure forms a WSW-ENE topographic high which separates the Murzuq and Ghadamis Basins.The core of the structure is formed by Jabal Hasawnah which is elevated 800m a.s.l. The structural grain of the Al Qargaf Arch is dominated by ENE-WSW trending faults and resistant ridges (possibly silicified relict fault planes and/or igneous dykes). Subsidiary WNW-ESE to NW-SE and N-S trending faults possibly also occur.
4. Orientation Analysis of the Structural Features
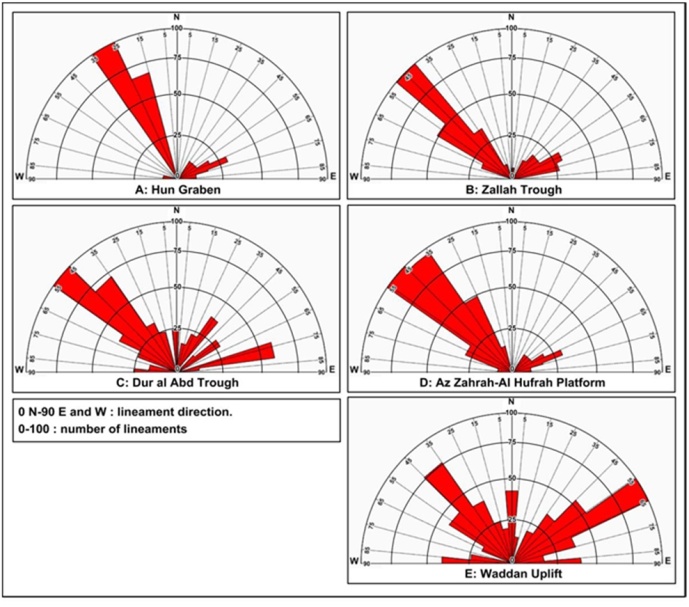
- Orientation is one of the most revealing characteristics of linear features, such as surface lineaments, surface fracture zones, and surface fracture traces. Rose diagrams provide one of the most informative ways of representing orientation data. Rose diagrams for all the linear features acquired in the study area were generated and interpreted which provide one of the most informative ways of representing orientation data [2, 3].Direction statistics for all the interpreted linear features acquired in the study area were calculated and given as a total distribution and then the totals are broken down by the major basin elements of the area. Hundreds of lineaments were recognized.Their lengths, range between a hundred meters up to hundreds of kilometers long and the dominant trends are between N25W and N55W (Figure 13) which coincides with Sirt Basin structures.
 | Figure 13a-e. Rose diagrams of the trend of surface lineaments, major fracture zones, and/or fracture traces in various parts of the study area |
 | Figure 14. Example of relay ramp structures with adjacent elongated synclines as appear on satellite imageries. It shows a fault displacement folds and relay ramp associated with stepping normal faults. (adapted from Google Earth). For location see fig. 2 |
5. Relative Timing and Styles of the Area Structures Features
- The dominant structural features in the study area are composed of NNW-SSE trending extensional faults and associated monoclinal folds which form the dominant structural grain of the area. These structures are related to pre-Upper Cretaceous NE-SW extension possibly associated with local reactivation of existing Pan-African structures. In addition the NNW-SSE to NW-SE trending broad, low amplitude, periclinal folds and intervening anastomosing synclines are likely to be related to differential compaction above and adjacent to Cretaceous age structures. On the contrary, those surface linear features oriented extensional faults of the Hun Graben which associated with present day topographic and geomorphological expressions are at least Oligocene in age. The western boundary fault of the Hun Graben appears to cross-cut the E-W northern boundary fault of the Al Qargaf Arch. Some ENE-WSW trending faults appear to off-set the bounding faults to the Hun Graben suggesting they developed during the Oligocene or during Alpine deformation.In the other hand the ENE-WSW trending normal fault zones and associated monoclinal flexures clearly offset all Cretaceous age structures and may be related to Alpine deformation. They could also be influenced by reactivation of deeper Hercynian structures. Whereas the E-W trending normal faults were probably formed by Miocene deformation and reactivation of older Hercynian structures especially around the Al Qargaf Arch.All of these trends are associated with similar trending minor faults with no apparent sense of offset. All faults appear to be steep dipping and generally associated with normal displacement. Most normal faults show soft-domino linkage and hard linkage is not common. The western boundary fault of the Gattar Ridge may be associated with transtensional sinistral strike-slip, possibly related to reactivation of an originally Cretaceous age fault [21].
6. The Significance of Surface Structure Features for Petroleum Exploration in the Study Area
- It has been observed in this study on the basis of remote sensing interpretation that at least in some parts of the study area, oil and gas traps line up well with the trends of surface major structural features such as folds, lineaments, fracture zones, and/or fracture traces. As a result, surface structural features have been used to examine any relationship with the existence of explored oilfields in the study area. Some of the existing oil and gas fields in the central part of Zallah Trough apparently are structures oriented in a northwest-southeast direction consistent with the trends of the Zallah fault system (Figure 3) which is characterized by the existence of major oil fields (Figures 2 and 15) that are located parallel to this fault system, e.g., the Hakim and Fidda oilfields, which are associated with a narrow NNW-SSE trending surface anticline expressed in Maradah Formation and Late Tertiary-Quaternary sediments (Figure 6). The Hakim and Fidda structure is approximately 36.5 km long and approximately 4km wide exposed in the erosional core of the structure along strike with the Al Hulayq Ridge, while two broad, low amplitude periclines at surface may be related to the reactivation of faults bounding the Al Hulayq Ridge. The Ghani and Zenab fields are also located in the middle portion of this fault system in the vicinity of a NNW-SSE to NW-SE trending arcuate fault zone associated with normal downthrow to the west.
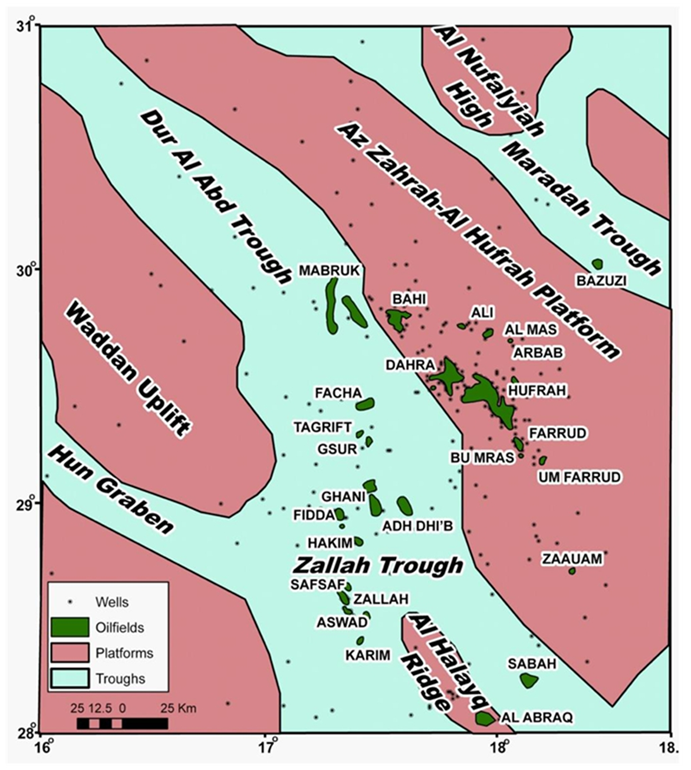 | Figure 15. Generalized tectonic map of the western Sirt Basin shows the location of the main oil and gas fields |
7. Discussion
- The surface geology of this area (Figure 6) is composed primarily of Late Upper Cretaceous, Tertiary and Quaternary surficial deposits. The study area is highly faulted, with a complex geological pattern, bounded to the west by a portion of the Hun Graben (Figures 2 and 3) and containing prominent geological features of the Sirt Basin. The faulting style exhibited in this region is that of normal and strike-slip faulting with a general NW to NNW trend.Figures 2 and 3 display the interpreted segmented fault pattern composed of NW-SE and N-S to NNE-SSW striking fault systems that have formed at both the rift borders and within the basin. As a general rule, the NW-SE faults that are parallel to the major structural trend of the basin controlled the rate of rifting and subsidence whereas the NE-SW structure modifies the pattern formed by previous system to form the block structures. The NE-SW faults are limited in length and not continuous. Based on their characteristics, the NE-SW fault system can be classified as transfer faults.Both sets of faults combine to control several structural and geotectonic elements; namely, the Zallah, Dur al Abd, Maradah Troughs, Hun Graben, the Waddan Uplift, Gattar Ridge, Az Zahrah-Al Hufrah Platforms, Al Qargaf Arch, and the intrabasinal Al Hulayq Ridge (Figures 2 and 3).These blocks are bounded on one side by a major NW trending border fault system and a predominant stratal dip direction toward the border fault system. The Al Hulayq Ridge (Figures 2 and 3), projects into the area from the south, and forms a spur that divides the Ar Ramlah Syncline, to the east and the Ma‘amir Graben to the west, and then passes beneath the Al Haruj Al Aswad volcanic centre to the south.
8. Conclusions
- The study area is highly faulted, with a complex geological pattern, bounded to the west by a portion of the Hun Graben and containing prominent geological features of the Sirt Basin. The faulting style exhibited in this region is that of normal and strike-slip faulting with a general NW to NNW trend.It is also characterized by segmented normal faults with relay ramp structures associated with horsetail splay faults that may indicate a component of sinistral strike-slip as well. In general the NW to NNW trends form a series of an elongate fault segments arranged as overlapping normal faults dipping to the SW, changing to NW dip where the faults are arranged in a closely spaced en echelon pattern with NW-SE trend. In the hangingwalls to the major faults, beds are gently inclined and warped forming synclines that trend parallel to sub-parallel to the main faults. These numerous elongate asymmetric synclines associated with shallow west limbs and steeper dipping east limbs are developed in the hangingwall adjacent to west downthrowing normal faults predominantly along the eastern fault bounded margin of the Gedari fault system and the Gattar Ridge.Segmentation of the Gedari fault system has resulted in the development of relay ramps between overlapping fault tips at the southeast part of the study area. These relay ramps are arranged as right lateral stepping faults dipping to the NW in the extreme south and to NNW when they swing to ENE-WSW.The satellite image interpretation integrated with the surface geological maps shows that the study area contains several basinal and geotectonic elements; namely, the Zallah, Dur al Abd, Maradah, Hun Graben, the Waddan Uplift, Gattar Ridge, the Az Zahrah-Al Hufrah Platforms, the Al Qargaf Arch, and the intrabasinal Al Hulayq Ridge. Moreover the Zallah Trough is divided into a number of sub-basins: the Facha Graben, Ar Ramlah Syncline, Zallah Sub-basin and Ma‘amir Graben.The produced rose diagrams reveal that the majority of the surface linear features in the region have five preferred orientations: N25-35W in the Hun Graben, N40-50W in the Zallah Trough, N45-55W in the Dur al Abd Trough, N35-55W in the Az Zahrah-Al Hufrah Platform, and in contrast in the Waddan Uplift a N55-65E trend. According to satellite interpretation most of the subtle low amplitude periclinal structures which are exposed at surface coincide with producing oil fields. It has been observed in this study on the basis of remote sensing interpretation that at least in some parts of the study area, oil and gas traps line up well with the trends of surface major structural features such as folds, lineaments, fracture zones, and/or fracture traces.It should be mentioned that some lineaments, mapped from the remote sensing data were not present in the geologic maps, which suggest that this image lineament interpretation provides new geologic perspectives even in an area which has been well mapped because of petroleum exploration.
ACKNOWLEDGEMENTS
- The author is indebted to the Management of Libyan Petroleum Institute and National Oil Corporation, Libya for their support throughout the study and funding, and the permission to publish this paper. Also I would like to express my sincere thanks to all colleagues who have offered many good ideas during the preparation of this article and for their continuous encouragement together with providing other varied assistance.