T. O. Chigbu1, R. U. Adindu1, C. S. Akoma1, C. A. Ike-Amadi2
1Department of Physics/Electronics, Abia State Polytechnic, P. M. B 7166 Aba
2Department of Chemistr, Abia state Polytechnic, Aba
Correspondence to: T. O. Chigbu, Department of Physics/Electronics, Abia State Polytechnic, P. M. B 7166 Aba.
| Email: |  |
Copyright © 2012 Scientific & Academic Publishing. All Rights Reserved.
Abstract
Noise not only degrades the quality of seismic reflection but also brings about loss of useful seismic events. Hence, there is need to enhance and/or improve the quality of seismic reflection data. By enhancing the seismic data, the interpretable part of the data significantly increases by obtaining high signal – to – noise ratio and addition of high frequency contents in the data. In this work three swathes (inline 5113) of a 3-D seismic reflection data acquired from Yakama field of Niger Delta, Nigeria were enhanced using Shell proprietary SIPMAP software. The enhancement techniques/steps which include reformatting, identing, gain recovery, editing, refraction statics correction, frequency wave number(F-K) filtering, elevation statics corrections, common-mid-point(CMP) sorting, deconvolution, residual statics, Dip move out(DMO) and migration were sequentially applied to the acquired data. For the purpose of structural interpretation of the area and the prediction of petroleum reserves, a migrated section of the seismic data was used. Well defined faults, rollover anticline and syncline were identified on the migrated section. These structures are thought to be the probable traps for the accumulation of hydrocarbons in the study area.
Keywords:
Elevation statics correction, De-convolution, Migration, Hydrocarbon deposit
Cite this paper: T. O. Chigbu, R. U. Adindu, C. S. Akoma, C. A. Ike-Amadi, Enhancement of a 3-D Seismic Reflection Data from Yakama Field, Geosciences, Vol. 4 No. 1, 2014, pp. 1-12. doi: 10.5923/j.geo.20140401.01.
1. Introduction
Exploration, the corner stone of the oil industry mainly depends on seismic methods[20]. The methods provide image of the interior of the earth and unravel its contents including the hydrocarbons. In other words, seismic exploration uses elastic waves or energy transmitted through the body of an elastic solid-earth to find out subsurface geologic structures and stratigraphic features with the aim of locating petroleum deposits[10],[11],[13]. The seismic energy is generated by explosive and/or other sources. The reflections and refractions of the seismic waves from sub-surface interfaces are detected by detector on the earth's surface and are recorded. The seismic waves from sub-surface interfaces are recorded in digital or analogue forms which are printed out as seismograms[6]. The seismograms constitute the seismic data which are digitally processed and interpreted to determine the geologic information of the seismic data[9]. In oil prospecting, the seismic reflection method is the most commonly used geophysical method because of its accuracy, great penetration and high resolution[3][14]. This particular study deals with the seismic reflection method, the seismic reflection method is applied in two different forms of survey namely: two-dimensional and three-dimensional seismic reflection surveys. These forms depend on the arrangement of both the seismic energy sources and the receivers. For three dimensional seismic profiling, the profile lines are laid out in an areal grid which results in several intersecting lines. This enables reflection events to be traced from profile to profile[3][8].The seismic data acquired undergo enhancement and/or processing before interpretation. The enhancement techniques/steps include reformatting, identing, gain recovery, editing, refraction statics, frequency wave number (F-K) filtering and elevation statics correction application. Others include deconvolution and migration [21],[16],[9]. This work primarily treats the enhancement of seismic reflection data acquired from Yakama field of Niger Delta, Nigeria. The enhanced data were interpreted.
1.1. Objectives and Scope of the Study
The aim of this work is to enhance the signal to noise ratio and/or to improve the quality of a 3-D seismic reflection data. The scope of the study includes the various enhancing techniques/steps of a 3-D seismic reflection data. Besides, the enhancement carried out in this work involves manipulating the data through all the normal enhancement steps, from reformatting up to migration plus some other auxiliary enhancements steps that help improve the effectiveness of the main technique. To obtain the desired result, this work tried to select the proper sequence of enhancement appropriate for the field data acquired and selection of proper parameters for each step. The work evaluates the resulting output from each step and detects any problems caused by improper parameter selection. This work is not on the actual interpretation of a 3-D seismic reflection data, although general and short remarks are made on interpretation of the data.
1.2. Geology of Niger Delta
The Niger Delta extends from the Benin flank in the West to the Calabar flank in the East, a distance of about 350km, and from Apex of the Delta at Abo to the coastline, which is about 150km. The Niger Delta is located between the longitude 4°-9° E and latitude 4° - 6° N. Many have written books and papers on the geology of Niger Delta. These include[2],[4],[12],[15] and[17] amongst others. In the subsurface Niger Delta,[15] suggested three main stratigraphic units, namely, the Benin Formation, the Agbada Formation and the Akata Formation (Fig.1).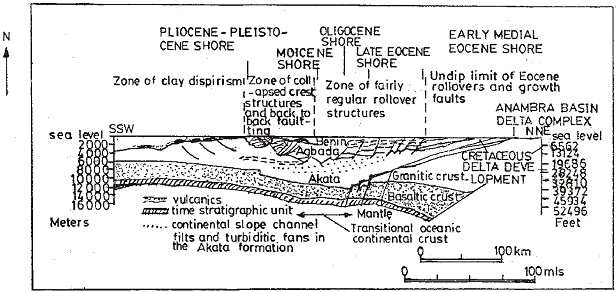 | Figure 1. Schematic structural cross section through Niger deta showing stratigraghic succession (modified from Whiteman 1982) |
The Benin Formation consists of coarse-grained poorly sorted, sub-angular to well rounded and bear lignite streaks. It is over 90% sandstone with shale intercalations. It is a continental deposit of upper deltaic depositional environment.Typical outcrops of the Benin Formation can be seen around Benin, Onitsha and Owerri[5],[18]. The thickness of the Formation varies from very thin at its present day depositional limits to about 200 – 4000m[15]. The Agbada Formation overlies the Akata and consists of alternations of sands, sand-stones and siltstones. The Agbada sands constitute the main hydrocarbon reservoirs of the Delta[1]. The thickness of the Formation varies significantly but the average thickness is more than 400m. It is time equivalent to the Ogwashi-Asaba-Amaki Formation further north.The Akata Formation is the lowest unit of the Niger Delta Sequence. It is composed of marine shales with local sandy and silty beds thought to have been laid down as turbidities and continental slope channels fills. The age of the Akata Formation ranges from digocene to recent[10], its thickness varies from 576m to about 6060m.
1.3. Location and Geology of the Survey Area
The Yakama 3-D prospect in Niger delta is located in Oil Mineral lease (OML) 22 at the North Western part of Rivers state and North Eastern part of Bayelsa state in Nigeria (Fig 2.). The field is also located on 083000.00 northing and 040000.00 easting of the global positioning system (GPS). 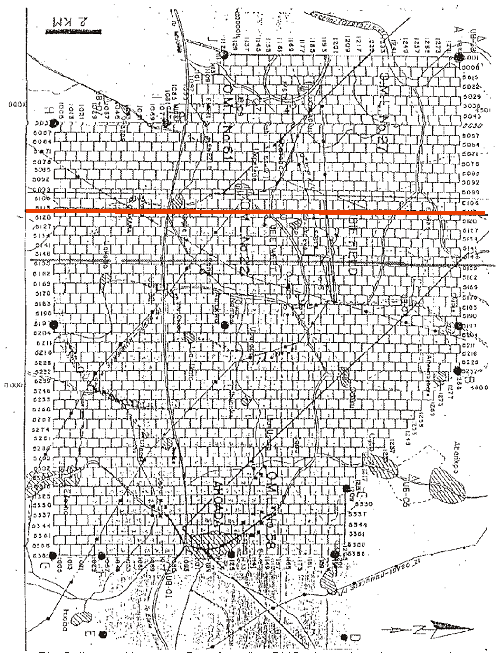 | Figure 2. Line position map. Data from line 5113,shown in red, were used |
It has an area of about 350.205KM2.Figure (3) shows the geologic map of the area.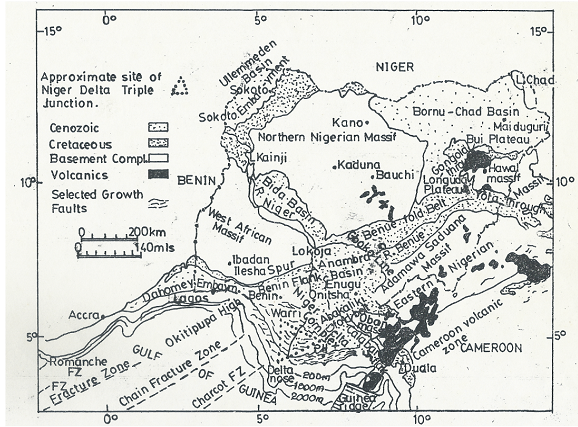 | Figure 3. General geology of Nigeria containing the survey area (modified from whiteman 1982) |
2. Materials and Methods
2.1. Reformatting
The original field data from this line was de-multiplexed by the contracting company before the field tapes were sent to the client (SPDC). At SPDC, different pre-processing stages were carried out. The brute shots on magnetic tapes and cartridges were earliest inputs to the computer. The data was given to SPDC on SEGY format, but before further processing at SPDC, it was reformatted to the SPDC internal proprietary processing package called SIPMAP format.
2.2. Identing
Following the conversion of the data to SIPMAP format, the tape was ready. The data which was recorded at the sampling interval of 2 milliseconds (ms) were re-sampled at 4ms interval. The data was idented, this makes available geometry information stored on the header to the seismic traces. It involved inputting the source static and receiver statics correctly as contained in the observer's report. The identing information was obtained from SPS file (Shell processing support format) which is an exchange format for topographical data. From the file, a total number of 36 receiver lines were used with 15,336 receiver points. This maintains a total length of 47.26m geophone array at 2.78m in-line spacing. The data also shows that there were 55 shot Lines with a total of 19,634 shot points on line. This as well maintains 50m shot point interval. Both the shot line and point numbers are even, whereas, odd in the case of receiver. The offset range of all the seismic data range up to a maximum 6500m and for cross spread data alone up to approximately 4500m. These offset records make it difficult for subtle position errors of about 50-100m to be detected via conventional means of linear move out (LMO) plots. Within a limited offset range, first break move outs are usually linear with offset such that with the application of a constant velocity reasonably accurate time shifts can be computed and applied to produce the LMO plots for geometry quality control. However, the data set had no geometry error. Figure (4) shows a raw (brute) shot of the test data-set (three swathes only).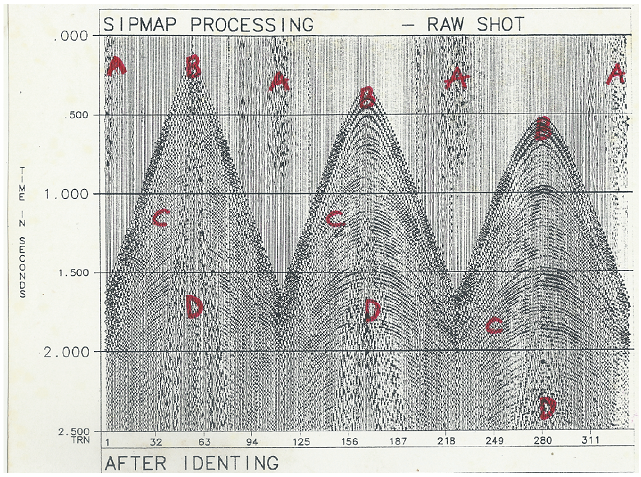 | Figure 4. Raw shot after identing |
In the Figure, the traces of each of the shots range from 1 to 342. A PICKFA identing quality control operation was used to check the identing and to normalize the data, a one constant scaling factor (AUTSCL) was used. The traces of Fig (4) were displayed in the form of wiggles. The wiggles are to the right, that is the peaks are filled in, they are wiggle variable area (VA) traces. Progressing down the record, from early to later times in the recording the traces are masked with both incoherent and coherent noises. An incoherent noise as in the section marked A, was probably caused by wind blowing across geophone or slight disturbances. Next in the time on the record comes the first break (B). They are the first wiggles on each trace caused by the first energy from the shots to reach the geophone groups on the spread. The further a group is from the source, the later its first breaks are recorded, so further down the trace it appears. Therefore, the lines of the first breaks on the record slants away from the near trace, the trace from the group nearest to the source. The first break for most of the traces arrive by refraction along the interfaces near the surface. Hence, the first break lines are straight lines or segment of straight lines, showing the velocity of the layer through which the seismic waves traveled. After the first breaks are the reflections as in the section marked C Fig.(4). These reflections appear as wiggle that line up, from trace to trace, across the record. The energy from these layers were not refracted but reflected to the geophones. Refraction along those layers could be received by geophones much further away. The reflections appear on the record as curved alignments of wiggles bending downward with distance from the source rather than the straight line segment of the refracted energy. The shallowest reflections curve considerably, and the curvature becomes less for deeper reflections. The curvature is normal move out. From the section marked (D) is a coherent noise called the ground roll. This is surface wave energy which travels along or near the surface of the ground. It is characterized by relatively low velocity, low frequency and high amplitude. The ground roll increases with increase in length of the record line. It masks the desired reflection signals. In the raw data, noticeable is a very slight decrease in amplitude of the reflection signals. Amplitude decays with increase in reflection time. In this raw data or record, there is no quiet or dead trace. A trace that is quiet for its entire length is called a dead trace. After identing, to check on the quality of the data and to provide early information on what further enhancement might show, an in-line number 5113 was brute stacked for a number of cross lines. The cross lines numbers range from 2230 to 2630. Before the brute stacking, a 1500ms automatic volume control (AVC) and normal move out (NMO) correction was applied to the data. Figure (5) shows the brute stack in-line 5113.On application of 50% single brute velocity function and stretch blanking, the reflection events improved, there is improvement in the alignment of the seismic signal especially from 1.000s to 3.000s portion of the seismic section.
2.3. Gain Recovery
A gain correction of magnitude T* Exp (0.35* T), where T is the reflection time was applied to the test data set after identing (Fig.5). The correction compensated amplitude decay of the reflection signal and the test data set was normalized with a one constant scaling factor (AUTSCL).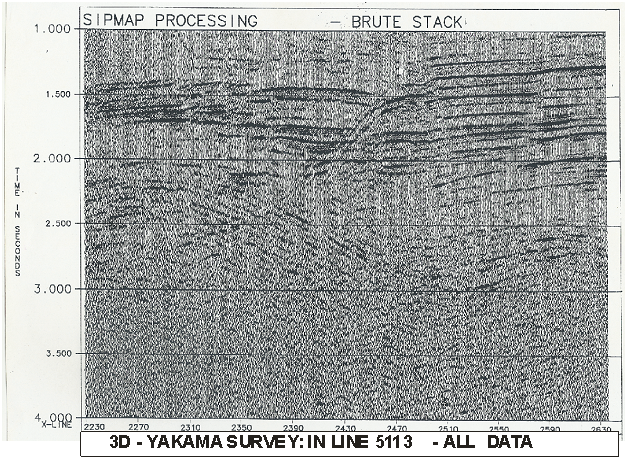 | Figure 5. Brute stack |
2.4. Editing
Editing is another step in enhancement sequence of 3-D seismic reflection data. It involves the selection and removal or correction of traces. This is appropriate when the idents are in error or the seismic data are of very poor quality, contain no signal or have reverse polarity. However, the test data set contain no dead trace. Even on brute stacking of the data, there was no indication of very strong noise. Hence, there was no need for the application of editing algorithm on the data.
2.5. Refraction Statics Correction
In refraction statics application, first arrival times at offset were picked with PICKFA. The first arrivals provided the input for the generalized linear inversion (GLI) 3-D run for the computation of refraction statics. Due to the acquisition method, some shots only contain four offsets with the first breaks at about 3,500ms. Therefore to get a proper shot static for all shots, we then need to include offsets up to 3200m. With the test data set, which has no near offset record at the taper zones, a 2 refractor model was used. But for a complete survey with near offset records at the edges, a one-layer model was found to be better in other surveys. It should be noted that for a brick wall data, an offset range of about 300-1600m and a one refractor model is sufficient to compute all statics. However, an in-line stack of the test data set was applied after refraction statics application. Figure (6) shows an in-line stack after refraction statics application.Comparing Figure (5.) with Figure (6.), there is much improvement on the quality of the seismic reflection events. In Figure (6), there are more strong and continuous seismic events than in Figure (5) especially from 1.000s to 3.000s portion of the seismic section.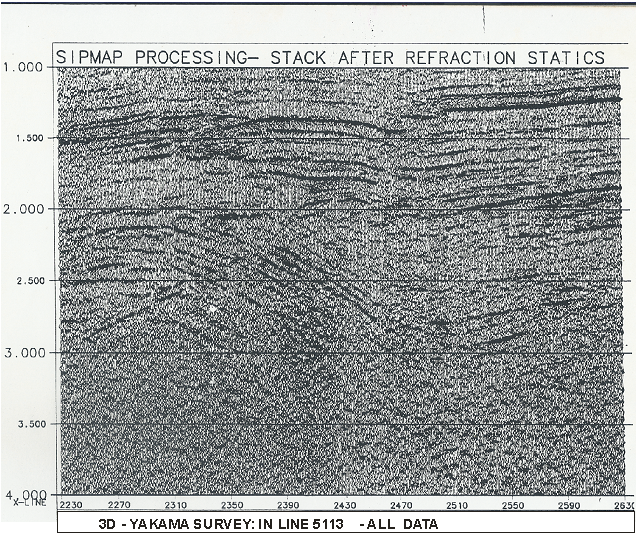 | Figure 6. Stack after refraction statics |
2.6. Frequency Wave Number (F-k) Filtering
Figure (4) shows raw shot of the test dataset before F-K filtering application. A filter was designed to remove the ground roll on the raw data. The filter has a full cut-off velocity of 1750m/s, 20% flat in V and 100% flat in K. These are called filter parameters. This velocity was the estimated velocity for the Niger Delta following series of studies carried out by SPDC and other oil exploration companies. The filter was truncated due to the sharpness of the edge. This may have adverse effect on the data as it may cut-off some useful signals. As a result, there was need for tapered filter. The filter was tapered 20% flat in V. Before it was used on the data, a 500ms automatic volume control (AVC) was applied on the data, which was removed after the filter application. Figure (7) shows raw shot of the test dataset after F-K filtering.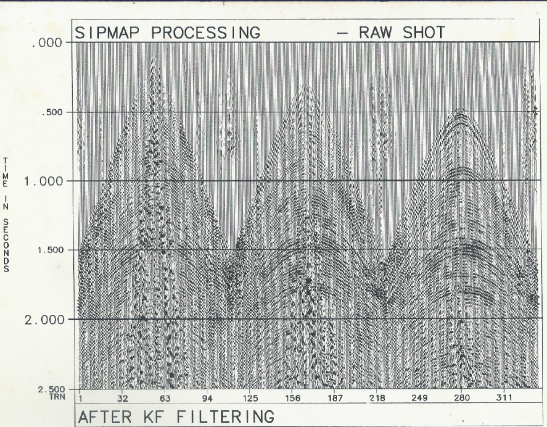 | Figur 7. Raw shot after KF filtering |
Thereafter an in-line stack was applied to the test data set. Figure (8) shows an in-line stack after F-K filtering.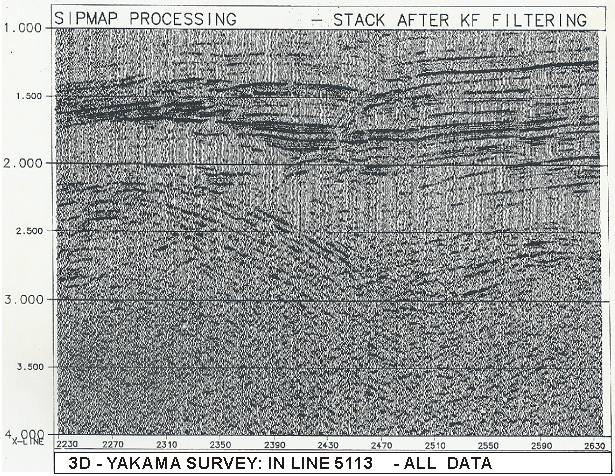 | Figure 8. Stack after KF filtering |
Through acquisition of the data, it was found that the terrain of Yakama prospect was largely flat. This provided good source and receiver coupling. The relatively simple statics problems of the area made the degree of enhancement moderate as a result there was no need for the application of elevation statics correction and common-mid-point (CMP) Sorting to the test data set.
2.7. Deconvolution
To collapse the wavelets into spikes, data Figure (7) was de-convolved using Wiener Spiking de-convolution technique. The output from this de-convolution is displayed in Figure (9). Comparing Figure (7) with Figure (9) there is much improvement on the quality of the seismic reflection events. In Figure (9), the seismic signals are more aligned and sharper than in Figure (7) especially from 2.000s to 2.500s portion of the seismic section.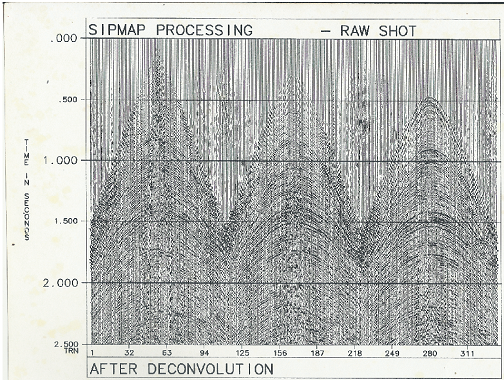 | Figure 9. Raw shot after deconvolution |
2.8. Residual Statics
3-D Land geometric induces statics decoupling in the inline and X line directions. The ratio of the inline shot spacing to inline receiver spacing gives the decoupling factor (R) for the inline direction while the X line decoupling factor(s) is given by the ratio of x line receiver spacing to X line shot spacing resulting for 3D geometry subsets of statics given as RXS fold. If decoupling of the data is ignored during this enhancement, it could cause jitters on the stacked data in inline as well as cross line direction. The routine is that, statics are coupled by combining several bins into one JAGUAR picking panel. Therefore, for this present survey, a running window of 2 bins was used and implemented by running JAGUAR in two parallel branches. Both branches create superbins of 3x2 bins. Figure (10) shows stack after residual statics.Comparing Figure (6) with Figure (10), there is much improvement on the quality of the seismic reflection events. In Figure (10), the seismic reflections are more aligned, strong and continuous than in Figure (6) especially from 1.000s to 3.000s portion of the seismic section. 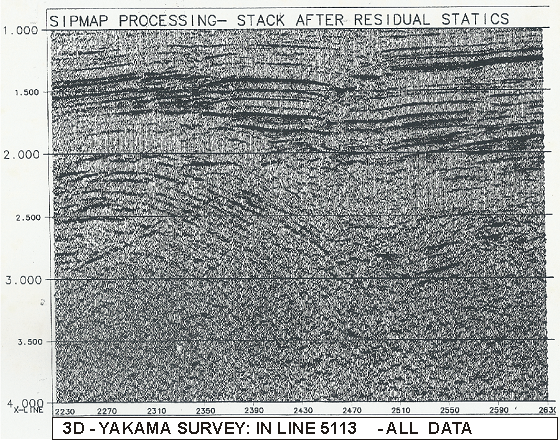 | Figure 10. Stack after residual statics |
2.9. Dip Moveout (DMO)
The aim of dip move out (DMO) correction is to get all the depth points in their proper lateral positions. A 3-D DMO with correction trace spacing of 12.5m was applied on the data to correct all the depth points to their proper lateral positions. Figure (11) shows a stack after 3D DMO.The result after DMO shows a large improvement in signal-to-noise ratio and continuity of events. Deeper events become much clearer.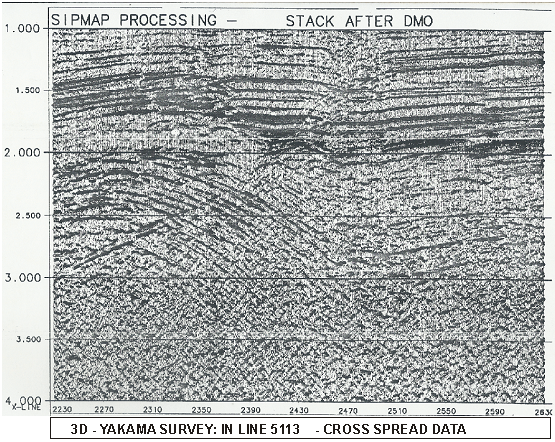 | Figure 11. Stack after DMO |
2.10. Migration
For the migration of the DMO stack, a one pass 3D post-stack time migration (SIPMAP Operation ONE PASS) was used. Figure (12) shows an inline stack after migration.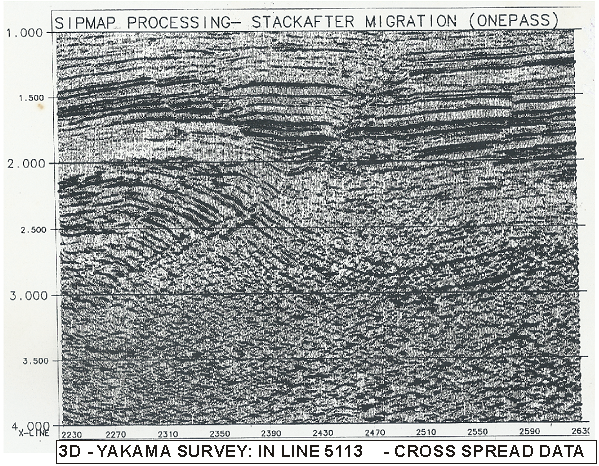 | Figure 12. Stack after migration |
Evident on the migrated section are well defined faults which were identified with red marks and roll-over anticline and syncline onFigure (13) which is a reproduction of Figure (12). 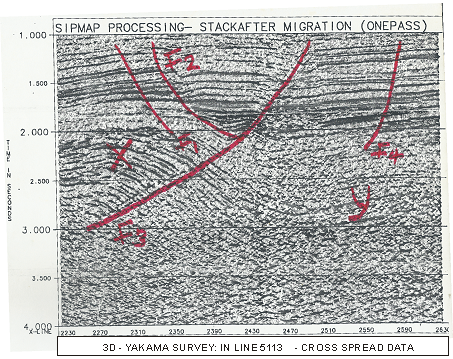 | Figure 13. Interpreted Migrated Seismic Section |
3. Results and Discussion
From the stack after a one pass 3D post migrated time section Fig (12), it is observed that the quality of the data from Yakama prospect was generally good. Though the acquisition was at the record length of 6.000s, the objective interval is 1.000s to 3.000s. The cut-off interval between 0.000s to 0.990s could represent the continental sequence mainly of the Benin Formation. Between the interval 1.000s to 3.000s, the data quality is observed to be very good with strong continuous reflections. Well defined faults, roll-over anticline and syncline were observed within this interval Fig. (13). The faults identified, marked in red, were (Fl), a reverse fault (F2), normal fault (F3) and (F4). Roll-over anticline (x) and Syncline (Y) are observed between interval 2.000s and 3.000s.This part of the seismic section represents the hydrocarbon bearing paralic/marine sequence of the Agbada Formation. From about 3.000s - 4.000s of the seismic section, the seismic reflection were discontinuous and no significant events were observed. The top of this time range could represent the onset of Akata Formation.
4. Conclusions
Enhancement of seismic signal by suppressing seismic noise and/or the improvement of quality of seismic reflection data is the main concern of this work. The acquisition methods, together with the acquisition parameters and instruments have a very important role to play in the quality of seismic reflections because seismic noise not only degrades the quality of seismic reflections but also brings about loss of useful seismic events. In order to achieve this main objective, across-spread acquisition geometry was employed incorporating a symmetrical crosspatch. It was noticed that for excellent resolution in the target zone and at processing there was need for preponderance of mid-range offsets. Besides, the terrain of the survey area made possible good quality of the data, a seismic data processing sequence such as reformatting, identing, gain recovery application, editing, refraction statics correction, frequency-wave number (F-K) application, elevation statics correction, de-convolution, residual statics correction, dip move out and migration were employed. The migrated section of the seismic data was interpreted using fault delineation and identification of anticline and syncline. The structural features are probably, the traps for the accumulation of hydrocarbons in the study area which were exactly on the target zone of 1.000s - 3.000s of the prospect.
References
| [1] | Able white, P. (ED), (1985); Outline of Niger Delta Geology.Well Evaluation Conference, Nigeria, 51-55. |
| [2] | Allen, J.R.L (1965), Sediments of the Modern Niger Delta in J.P. Morgan (Editor). Deltaic Sedimentation Modern and Ancient. Society for Exploration of Petroleum and Mining Special Publication Vol. 15, P.138 – 131. |
| [3] | Anstey, N.A, (1983). Introduction to Field Work; International Human and Resources Development Corporation (IHRD), Exploration Geophysics, Boston. |
| [4] | Burke, K.C, Dessau Vagic; T.F.J; Whiteman, A. J.(1971). The opening Gulf of Guinea and the geological history of the Benue depression and Niger Delta. Nature physical science, vol.33 P.51. |
| [5] | Bustin, R. M (1988); Sedimentology and characteristics of dispersed organic matter in tertiary Niger Delta, origin of source rocks in a deltaic environment. American Association of Petroleum Geologists(AAPGP) Bulletin, vol.72/3,P.55-67. |
| [6] | Coffen,J.A (1986). Seismic exploration fundamentals. Penn Well Publishing Company, Tulsa. |
| [7] | Dobrin, M.B and Savit, C.H (1988 ) Introduction to geophysical prospecting. M. C Graw, Hill, New York. |
| [8] | Getkens, J.C (1989), Foundations of Explorationgeophysics. Elsevier Science Publishers Netherlands. |
| [9] | Hatton, L; Worthington, M.H. and Malari, J. (1986); Seismic data processing. (Theory and Practic). London: Blackwell Scientific, Publication. |
| [10] | Murat, R.C. (1972). Stratigraphy and Palaeography of the Cretaceous and lower tertiary in southern Nigeria, in T.F.J. Dessauragie and A.J. Whiteman (editors). African geology, Ibadan University Press P. 266. |
| [11] | Parasnis D.S. (1986). Principles, of Applied Geophysics. London; Chapman and Hall. Reyment, R.A. (1965). Aspects of Geology of Nigeria, University Press, Ibadan, Nigeria. |
| [12] | Robinson, E.S. and Corugh, C. (1988). Basic Exploration Geophysics. John Willey and Sons New York. |
| [13] | Selley, R.C. and Morrill, D.C. (1983). Generation and migration of hydrocarbons, IHRDC, Boston. |
| [14] | Short, I.C. and Stauble, A.J. (1967); Outline of Geology of Niger Delta, AAPA Bulletin Vol. 51, P 761-779. |
| [15] | Sodbinow, E.S. (1984). Initial Processing. Exploration Geophysics. IHRDC, Boston. |
| [16] | Stonely R. (1966)’; The Niger Delta Region in the light of the Theoryof continental drift, Geol. Mag. Vol. 105, 385-397. |
| [17] | Uko E.O. Ekine, A.S. Ebeniro, J.O, and Ofoegbu, C.O, (1992); Weathering Structure of the East-Central Niger Delta, Nigeria; Geophysics 57, 1228-1233. |
| [18] | Whiteman, A. (1982) Nigeria: Its Petroleum Geology Resources and Potentials, Vol. 1 and 2, Graham Trothman, London. |
| [19] | William, C.P. (1986). Acquiring better seismic data. Champman and Hall, London. |
| [20] | Yilmaz O. (1987); Seismic Data processing. Society of Exploration Geophysics Tulso Okla. |


 Abstract
 Reference
 Full-Text PDF
 Full-text HTML