-
Paper Information
- Paper Submission
-
Journal Information
- About This Journal
- Editorial Board
- Current Issue
- Archive
- Author Guidelines
- Contact Us
Geosciences
p-ISSN: 2163-1697 e-ISSN: 2163-1719
2013; 3(4): 99-107
doi:10.5923/j.geo.20130304.01
Characterization of Infiltration Capacities of the Soils of Michael Okpara University of Agriculture, Umudike – Nigeria
 Abstract
 Reference
 Full-Text PDF
 Full-text HTML
Adindu R. U.1, Igboekwe M. U.2, Ughegbu A. C.2, Eke K. T.1, Chigbu T. O.1
1Dept. of Physics/Electronics, Abia State Polytechnic, Aba, P.M.B 7166, Aba, Nigeria
2Department of Physics, Micheal Okpara University of Agriculture, Umuahia, Nigeria
Correspondence to: Adindu R. U., Dept. of Physics/Electronics, Abia State Polytechnic, Aba, P.M.B 7166, Aba, Nigeria.
| Email: |  |
Copyright © 2012 Scientific & Academic Publishing. All Rights Reserved.
The study characterized the infiltration capacities of soils of Michael Okpara University Of Agriculture Umudike, Nigeria using a Double Ring Infiltrometer – falling head method. The field experiments were carried out in two seasons. Each experiment lasted for three hours. The dry season infiltration rates were found to be higher than those of the rainy season. The highest infiltration rate was obtained from Poultry Block with an average rate of 9.9 cm/hr while the lowest was from Admin. Block(1.35cm/hr). The water intake also seemed to follow the same trend, being highest at the Poultry Block (29.1cm) and lowest, with an average value of 4.3cm at the Admin Block .Other values obtained were between 2.0cm/hr and 9.7cm/hr. Soil samples were collected from each location at a dept of 0 - 30 cm into the soil profile for laboratory determination of physical properties. The mean percentage of sand was 65.5%, silt had an average value of 16% while that of clay is 18.5%. Porosity ranged from 34% - 46% .Bulk density was between 1.6g/cm3 and 1.8g/cm3. Organic matter ranged from 1.3% – 3.4% and a mean pH of 5.4 was observed. Umudike soils supported good infiltration rates.
Keywords: Infiltration, Soil, Umudike, Water Intake, Moisture Content
Cite this paper: Adindu R. U., Igboekwe M. U., Ughegbu A. C., Eke K. T., Chigbu T. O., Characterization of Infiltration Capacities of the Soils of Michael Okpara University of Agriculture, Umudike – Nigeria, Geosciences, Vol. 3 No. 4, 2013, pp. 99-107. doi: 10.5923/j.geo.20130304.01.
Article Outline
1. Introduction
- Infiltration is the process by which water on the soil surface penetrates the soil. It also refers to the vertical movement of water down wards from the soil surface to replenish the soil water/moisture deficiency, with excess percolating down to build up the water table by gravitational flow[1],[2],[3]. It also carries with it some amounts of nutrients to replenish the soil[4],[5]. It is related to overland flow, determining the fraction of irrigation or rain water that enters the soil to become groundwater and thus, affecting the amount of runoff responsible for subsequent soil erosion[6].Infiltration rate is the volume flux of water flowing into the soil profile per unit area of soil surface[7]. It is the rate at which infiltration occurs. It is usually measured by the depth in mm/hr mm /min, cm/min, or cm/hr. Therefore an infiltration rate of 25mm/hr means that a water layer of 25mm on the soil surface will take one hour to infiltrate. The downward speed of infiltrating water depends on the characteristics of the soil. Saxton et al, (1986)[8], reported that the soil and water characteristics affecting infiltration are; initial moisture content, conditions of the soil surface, hydraulic conductivity of the soil profile, texture, porosity and the degree of swelling of soil. Others include colloids, organic matter, vegetation cover (land use), duration of irrigation or rainfall and topography.Infiltration can be quantified by infiltrability (infiltration capacity) and / or cumulative infiltration. Cumulativeinfiltration and soil infiltration rate are related as follows;
 | (1) |
1.1. Literature
- Umudike is a town in Abia state inhabited by mostly famers. This town is known for its farm products especially root crops. Owing to this reason, the National Root Crop Research Institute, a meteorological station and also a university of agriculture – Micheal Okpara University of Agriculture were established in this area to assist the local farmers in providing improved crop species and useful information with respect to the soil, weather, farming and other agricultural activities. Although many authors have written reasonably on Umudike, the infiltration capacities has not been characterized. Infiltration data will help the local farmers in the management of agricultural lands and to categorize crops according to their water tolerance level during planting seasons. If the infiltration characteristics of this area is kept constant, the irrigation efficiency could be increased to a high level[12]. Therefore, it is the objective of this paper to characterize the infiltration capacities of Umudike soils.
1.2. Infiltration Models
- Although many infiltration models have been developed using both physical and empirical approaches, Kostiakov’s and Philip’s models are more frequently used because of the simplicity and the ease to calculate their parameters[13]. Kostiakov suggested a formula which assumes that at time t = 0, the infiltration rate is infinite and at time t = ~, the rate approaches zero . His equation is given by:
 | (2) |
 | (3) |
 | (4) |
 | (5) |
 | Figure 1. map of the study ares |
 | (5) |
2. Materials / Method
2.1. Location of Umudike
- Umudike is located in Ikwuano Local Government Area of Abia State, Southeastern Nigeria. It is within the deltaic marine sediments of Cretaceous to recent age, between latitude 5°28'N and 5°30'N and between longitude 7°31'E and 7°33'E. Fig.1(map).The piezometric cycle of this area shows a cycle of 2 phases which correspond to the rainy (wet) Season, when it enjoys a steady heavy rainfall period from the month of May to September, while the dry season last from October to April.Double ring infiltrometer of diameters (18/30cm) were used in accordance with[17],[18],[19] procedures. The inner ring was first driven into the ground by hammering on the driving plate. Then the outer ring was placed centrically around the inner ring and was also driven into the ground using the same procedure to about 5 – 10 depth. On the inner ring was placed the 30cm rule attached to the bridge. Water intake of the soil was read off with the help of the rule. A 2cm of sand layer was spread at the bottom of the rings to minimize soil surface disturbance when pouring water into the rings. The outer ring was first filled with water so that the soil profile around the inner ring would be wet. This is done in order to ensure that only vertical flow (1-dim) occur in the inner ring. Lateral flow from inner ring will falsely increase the infiltration rate of the soils. The reference level of the water poured into the rings were recorded at the start of the experiment as indicated by the measuring rule in the inner ring.
2.2. Measurement
- At the starting of the experiment, the local time was recorded. Soil infiltration starts once the soil water content is higher than the maximum water molecular holding capacity. Repeated readings were taken at 5, 10, 15 and 30 minutes intervals. In all the locations, each experiment lasted for 3 hours. Once the value of the infiltration rate became constant, the basic steady state infiltration rate (equilibrium) has been reached, the experiment was stopped. A ponding level of 5cm was maintained during the experiments. Two sets of data were taken, one in dry season and the other in rainy season.
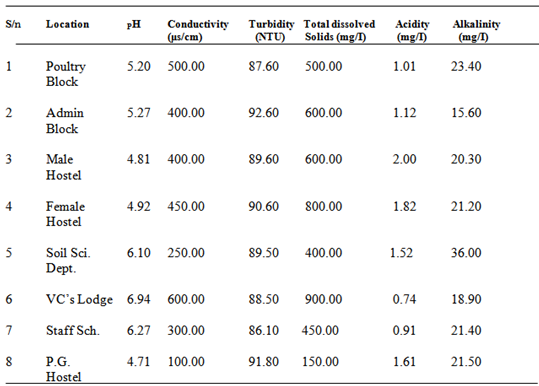
2.3. Quality of Water Used
- Water of same quality and temperature to that of the real system being measured was also used.[20] discovered that the quality of water, particularly its turbidity in terms of clay, colloids and salt content (residue fertilizer) from alkaline soils or sources, had diminishing influence on infiltration capacity of soils.
2.4. Laboratory Analysis
|
3. Results
|
|
3.1. Discussion
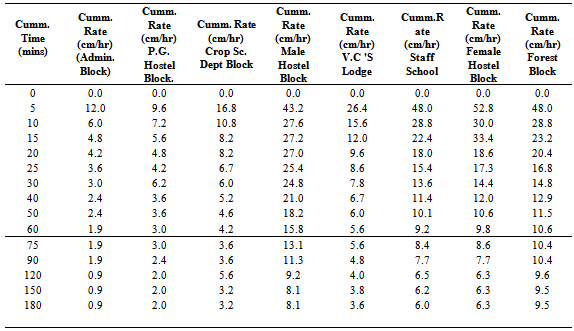
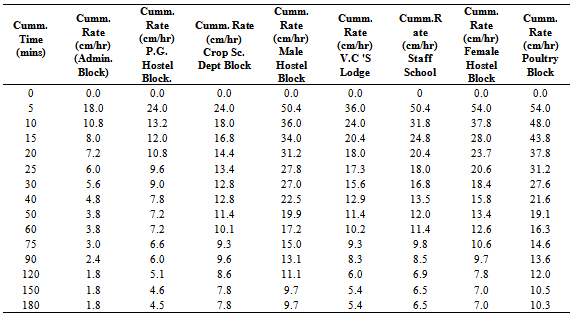
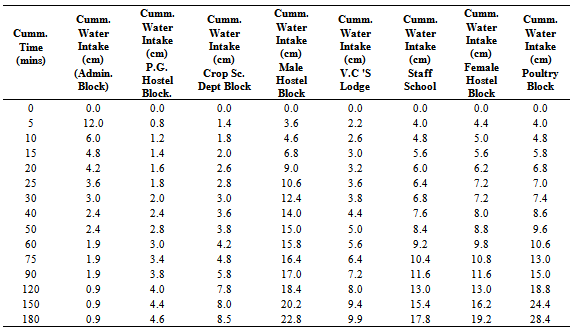
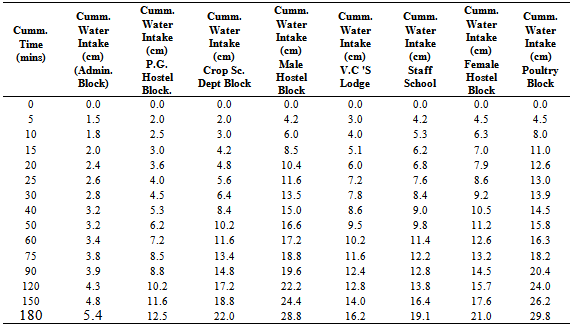
- Tables 2& 3 show the infiltration rate (IR) data obtained from the soils of different locations inside the premises of Michael Okpara University of Agriculture, Umudike while tables 4&5 show the water intake values for the two seasons. Fig 2a and 2b show the infiltration rate curves for the seasons while fig. 3a and 3b show the water intake curves. The infiltration rate data shown in tables 2&3 indicated that the Soil infiltration capacity is influenced by the matrix potential gradient at the soil surface in the two seasons. The high initial soil infiltration rate is related to the relatively high matrix potential gradient of the initial dry soil[21] and also decreases with the increase in wetted soil depth[22]. This is the trend of the result obtained from the study area. Infiltration rates were at their highest values at the beginning of the experiments, but decreased steadily at different rates. The steady state rates occurred between 150mins and 180mins. It was also observed that in dry season, when the soil was dry, the infiltration rates (IR) values were higher compared to that of the rainy season, when the initial moisture content were high. It therefore means that IR was influenced also by the initial moisture content of all the soils during the rainy season.
|
|
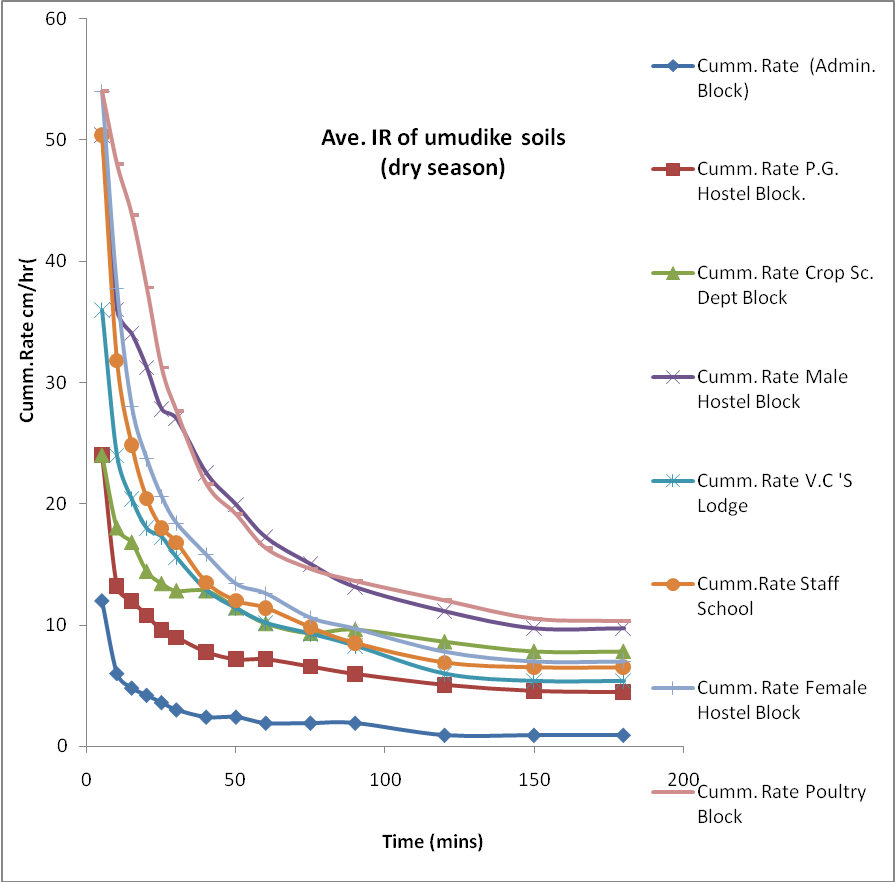 | Figure 2a. Infiltration Rate curves of Umudike Soils in dry season |
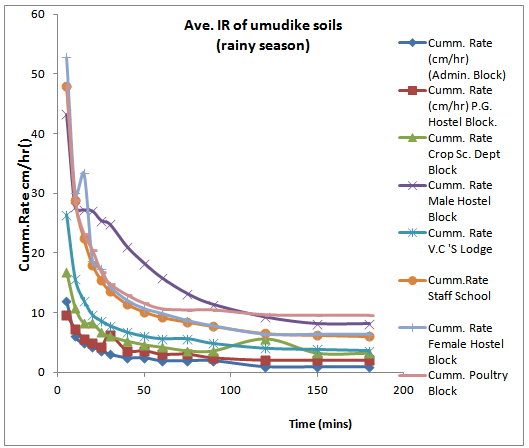 | Figure 2b. Infiltration Rate curves of Umudike soils in rainy season |
|
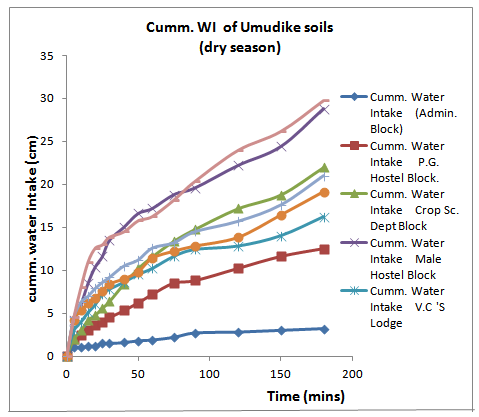 | Figure 3a. Cumm.water intake curves of Umudike soils in dry seasons |
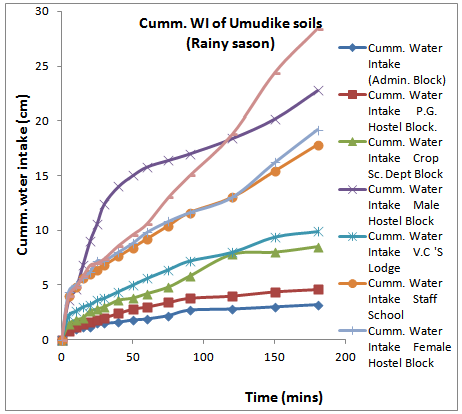 | Figure 3b. Cumm.water intake curves of Umudike soils in rainy season |
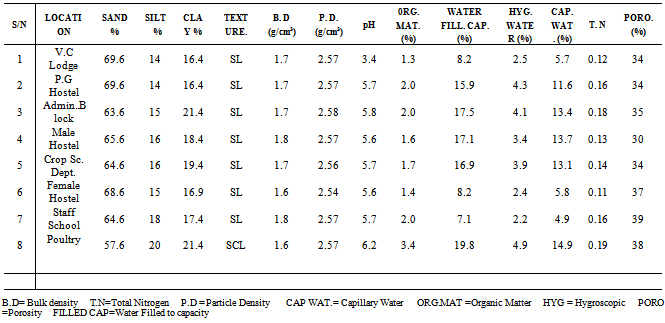
- Infiltration capacity (IC) obtained in the dry season ranged from 1.8cm/hr – 10.3cm/hr while the cumulative water intake ranged from 5.4cm – 29.8cm. During the rainy season, the IC values were lower, ranging from 0.9cm/hr – 9.5cm/hr. The lowest IC value was obtained from Admin Block, with an average of 1.35cm/hr and average cumulative water intake of 4.3cm after 3 hours. The relatively low value is attributed to high initial moisture content and the clay content.[23] reported that IR is controlled by the swelling and dispersion of clay particles that may cause the sealing of soil pores which in turn lowers the infiltration rates of soils.[24] Also reported that, the swelling plough pan coupled with high initial moisture content affects infiltration negatively.Table 6 shows the physical properties of soils. The soils of Umudike were found to belong to mainly sandy loam textural class except for Poultry Block. Sandy loam soils have high porosity that supports infiltration. Porosity varied from location to location, ranging from 34% - 46%. The mean percentage of sand for the whole locations, is 65.5%, silt has an average of 16% while that of clay is 18.5%. Bulk density ranged from 1.6g/cm3 to 1.8gkm3. While particle density is almost same for all locations, organic matter ranged from 1.3% – 3.4%. The water retention characteristics of the various soils determine the cumulative intake and decline in infiltration rate during experiments. Their values indicated good water storage capacity at the capillary zone. Capillary uptake and removal of water is influenced by soil storage capacity.[25] reported that the storage capacity of soil and the characteristics of the permeable medium influences the transmission of water through the soil profile to the aquifer zone. Their values also implied that plants and crops grown within this area have enough water to strive well. The pH was however, observed to be low, with a mean value of 5.4, indicating that the soil is acidic. This is in agreement with[25] The copious rainfall that Umudike enjoys during rainy season must have led to the increase in the displacement of dissociable hydrogen ion from rain water by the basic cations in the soil.[26] reported that increase in the displacement of dissociable hydrogen ion from rain water by basic cation is responsible for low pH. Secondly, the acidity is also attributed to the agricultural practices going on in this area. The people of this area are predominantly farmers. They support their crop yields by the use of fertilizers and herbicides. Generally, the results show high infiltration rates and high water intake values. Consequently, the Umudike soils show low potential for surface runoff. The results obtained conform with the results of[19],[21],[27].
4. Conclusions
- The infiltration capacities of soils of Michael Okpara University Of Agriculture Umudike, Nigeria were determined. Field experiments carried out showed that the dry season infiltration rates were higher than those of the rainy season. Highest infiltration rate was obtained from the soil of the Poultry Block with an average rate of 9.9 cm/hr while the lowest was at the Admin. Block with an average value of 1.35cm/hr. The water intake values ranged from 4.3cm at the Admin Block to 29.1cm at the poultry block. The measured infiltration rates of Umudike soils were generally high, ranging from average values of 1.35cm/hr to 10.1cm/hr. Umudike soils were found to belong to sandy loam textural class. This class promotes fast infiltration due to its coarse texture and large porous spaces. Other factors that influenced the infiltration rates were, initial soil moisture content, seasonal variations and clay content.