-
Paper Information
- Previous Paper
- Paper Submission
-
Journal Information
- About This Journal
- Editorial Board
- Current Issue
- Archive
- Author Guidelines
- Contact Us
Geosciences
p-ISSN: 2163-1697 e-ISSN: 2163-1719
2013; 3(2): 68-76
doi:10.5923/j.geo.20130302.05
A Simple Approach about the Characteristics of Available Surface Water in Bihar State of India
 Abstract
 Reference
 Full-Text PDF
 Full-text HTML
P. ParthSarthi, Ajeet Kr Singh
Centre for Environmental Sciences, School of Earth, Biological and Environmental Sciences, Central University of Bihar, Camp Office: BIT Campus, P.O-B.V. College, Patna 800014, Bihar, India
Correspondence to: P. ParthSarthi, Centre for Environmental Sciences, School of Earth, Biological and Environmental Sciences, Central University of Bihar, Camp Office: BIT Campus, P.O-B.V. College, Patna 800014, Bihar, India.
| Email: |  |
Copyright © 2012 Scientific & Academic Publishing. All Rights Reserved.
Water is an important natural resource and is vital for all life on the earth. The water balance over a place on earth provides information about the surface and ground water. The water balance consists of the components of hydrological cycle like precipitation, evaporation, evapotranspiration, soil moisture, soil storage and runoff, but the major input is precipitation and output is evapotranspiration and runoff. In the current study a preliminary investigation is conducted for available surface water over a flood and drought prone Bihar state of India. For the purpose, monthly precipitation and monthly temperature are obtained from the Climate Research Unit (CRU), University of East Anglia, U.K. These reanalysed data at surface resolution of 0.50 x 0.50 degree (50x50km2) is used for the period of 1901 to 2000 for each districts of agro climatic zones of Bihar state of India. For estimating available surface water, a simple water balance equation is used. The empirical relations are used to compute surface runoff and water losses. It is found that frequencies of water deficit years are more in agro-climatic zone-III in compare to the agro-climatic zone I and II. There is sharp increase in frequency of water deficit years during 1981-2000 in all three agro climatic zones of Bihar state of India.
Keywords: Available Surface Water, CRU Data, Empirical Relations, Agro-Climatic Zones of Bihar
Cite this paper: P. ParthSarthi, Ajeet Kr Singh, A Simple Approach about the Characteristics of Available Surface Water in Bihar State of India, Geosciences, Vol. 3 No. 2, 2013, pp. 68-76. doi: 10.5923/j.geo.20130302.05.
Article Outline
1. Introduction
- Water is an important natural resource for all life on the earth. The water on the earth is available as surface and ground water and the water balance gives an estimation of water in and out of a drainage basin or basin or area on the earth’s surface. The water balance is essential for knowing the status of water availability and is use in meaningful manner. The water balance is controlled by components of hydrological cycle like precipitation, evaporation, evapotranspiration, soil moisture, soil storage and runoff, but the major input is precipitation and output is evapotranspiration and runoff. In the absence of information of infiltration and moisture storage over an area, the water balance only gives information about available surface water. The available surface water plays an important role in agriculture and water resources over an area of consideration.The constructing water balance is necessary to understand the water regime of a specific area[23]. Study of water balance in specific regions has been well documented by earlier researchers. The water balance within a basin has been worked[9,13]. The water balance equation as evaporation=inflow or precipitation-outflow or total runoff-change in the reservoir has been introduced[8]. This method is suitable for large area and for longer time periods. The evapotranspiration is a significant component of the energy and water budgets in grassland and agricultural ecosystems[1]. The temporal variation of evapotranspiration for the Amazon Basin and for the state of California respectively for water balance has been studied[14]. The temporal variation of rainfall can play significant role in the cropping pattern and water resources over an area[21]. The corrected values of precipitation for basin level water balance calculations for the Yellow River Source region by using long-term (1959–2001) monthly and yearly data of precipitation, runoff, and ERA-40 water budget variables for defining a water balance regime have been examined[2]. It is found that basin precipitation, evapotranspiration and runoff are high in summer and low in winter. The water balance of India by using its components has been estimated by many researchers[7,12, 6,15]. The monthly runoff estimation proposed by researchers based on monthly rainfall and monthly average temperature[10, 17]. The empirical formulae have been suggested by researchers[4,10] and have been well documented for water balance study in various regions of India. The Chaturvedi formula has been widely used for preliminary estimations of groundwater recharge due to rainfall. This formula[1] is used for groundwater recharge in Indo-Gangatic plains of western U.P., Punjab, Haryana and Gujarat states. The water balance in Madhya Pradesh, India has been examined[22]. The pattern of basic water budget elements over Andhra Pradesh during summer monsoon season by using daily data from water balance model has been studied[20]. A detailed seasonal groundwater balance study in Upper Ganga Canal command area for the period 1972-73 to 1983-84 has been conducted to determine groundwater recharge from rainfall[11]. It is found that as the rainfall increases, the quantity of recharge also increases but the increase is not linearly proportional. The empirical relationship has been used for fitting the estimated values of rainfall recharge and the corresponding values of rainfall in the monsoon season through the non-linear regression technique. It is concluded that most of the river basins in India are water deficit even if low-demand scenario is considered by 2050s[6] and found that the groundwater is being over exploited. The situation may be much worse in view of the deteriorating ground- and surface water quality. The water balance may incorporate the relationship between natural recharge rates and anthropogenic demands[3]. It is found that countries such as India, Pakistan, Iran, Saudi Arabia, Morocco and eastern China have particularly high sensitivity indices because they suffer from strong water scarcity[5]. Bihar is drought and flood prone state of India, according to official website of Bihar government. In Bihar, there is serious lack of scientific literatures on long term changes of available surface water. In the current study, a simple approach is aimed for the study of available surface water. In this paper, introduction is kept in section1. The selected study area details are placed in section2. Section3 deals with data used and methodologies proposed. Results and discussion is discussed in section4. Lastly conclusions are placed in section5.
2. Study Area
- Bihar state is situated at the eastern part of the Indo Gangatic plain of India between latitude 24°-27° N and longitude 82°-88° E with a total geographical area of 94,163 sq. km. The state lies midway between the humid West Bengal, in the east and the sub humid Uttar Pradesh, in the west. It is bounded by Nepal in the north and by another state Jharkhand in the South. The plain of Bihar is divided into two unequal halves by the river Ganga which flows through almost in the middle from west to east. The Ganga is the main river which is joined by tributaries with their sources in the Himalaya. Some of the tributaries, north of the Ganga, are Saryu (Ghaghara), Gandak, BudhiGandak, Bagmati, Kamla-Balan and Mahananda. There are some other rivers that start from plateau, in south of the Ganga, area and meet in the Ganga or its associate rivers after flowing towards north. Some of them are Sone, Koyal, Punpun, Panchane and Karmnasha. The state has a tropical monsoon climate with three distinct seasons-winters, summer and rainy. The Indian Summer Monsoon Season (ISMS) normally starts in second/third week of June and lasts up to end of September and downpour good amount of rainfall throughout the state. The normal rainfall is 1205 mm with average number of rainy days is 52.5 in a year. Due to large fluctuation of Indian Summer Monsoon Rainfall (ISMR) in every year, the state have been experiencing flood and drought and affecting agriculture and water resources sectors. According to the official website of Agriculture department, Government of Bihar, the state is categorized into three agro climatic zones according to the distribution of rainfall, temperature, soil and crops. The details of three agro climatic zones are shown in the table 1. The spatial distribution of three agro climatic zones along with name of districts is shown in fig.1. The agro climatic zone III lies to the south of the Ganga River while agro climatic zone I and II lies north of the Ganga.
|

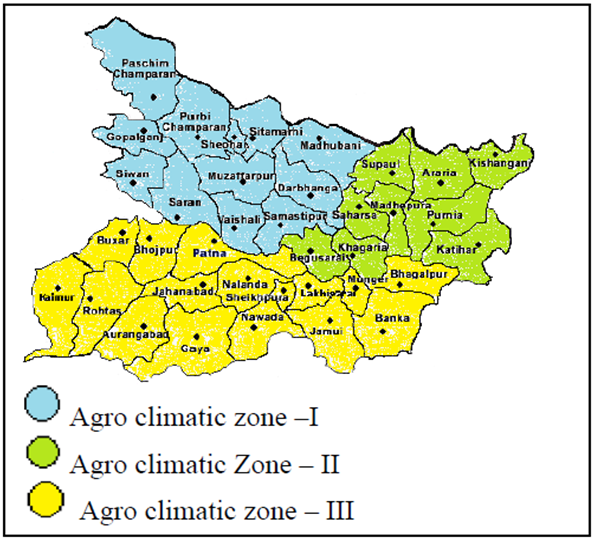 | Figure 1. Spatial distribution of agro climatic zones and their districts in Bihar state, India |
3. Data and Methodologies
3.1. Data
- The Climate Research Unit's (CRU, University of East Anglia) CRU TS 2.0 is a widely used long-term data set for climatic variables. This data product consists of climate variables gridded on 0.5°x0.5°degree (50x50 km2) and the product is based on surface meteorological observations[18,19]. The monthly precipitation, temperature, cloud cover, humidity is available from Climate Research Unit (CRU) TS2.1 dataset, Tyndall Centre for Climate Change Research, School of Environmental Sciences, University of East Anglia, Norwich, UK[16]. The dataset is most useful for regional applications such as water balance modelling, rainwater harvesting potential, a preliminary estimate of the water balance for smaller areas, when local data is unavailable, a comparison of rainfall and other weather parameters between different regions/basins. In the current study, precipitation and temperature data sets for the period of 1901-2000 is used for estimation of available surface water in each district of agro climatic zones of Bihar state of India.
3.2. Methodologies
- The simplest form of water budget, can be represented by the equation as follows, Total rainfall input = Surface runoff + Groundwater recharge + Water loss by Evapotranspiration. In absence of groundwater recharge, the above equation becomes as Precipitation-Surface Runoff-Water Loss by Evapotranspiration =0. In this paper, the above relation is used in estimating available surface water. The available data from other sources is generally of coarse resolution and may not be used for estimating surface runoff and water loss by evapotranspiration in each districts of Bihar therefore the high resolution CRU data is used for the current study and sufficient data points falls in each districts of Bihar.
3.2.1. Water loss Calculation by Khosla’s Method
- Assuming that mean temperature is a complete measure of all the factors that are responsible for the losses, Khosla proposed the following formula for water loss calculation. The loss in any month (Lm) is calculated from the relation Lm=5Tm (For Tm > 4.5℃) where Tm is the mean temperature in degree Celsius in each month and the annual water losses (Ly) is calculated as Ly=Lm for 12 months.
3.2.2. Runoff Calculation by Khosla’s Method
- The following empirical relation[10] for north India is used to calculate runoff R=P-(T/3.74), where R is the average runoff (in mm), P is average annual rainfall (in mm) and T is mean annual temperature (in degree Celsius) for entire district.
4. Results and Discussions
- The present study is aimed to estimate changes in surface water availability in different districts of Bihar during 20thcentury (1901-2000). Since water budget is highly influenced by seasonal and annual rainfall, therefore rainfall series is statistically analysed each district and it shows significant decreasing trend in recent decades. To know the statistical significance of decreasing trend of annual rainfall (1901-2000) in each districts of Bihar, P values are estimated by using ANOVA (Analysis of Variables or Analysis of Variance) with the help of SPSS (Statistical Package for the Social Sciences) software. It should be noted that if P value is <0.05, then significant decreasing trend is considered. It is found that P values is ranging from 0.001 to 0.02 for all districts, except Kishnaganj (P value is 0.09), among all three agro climatic zones. Therefore all districts have significant decreasing trend, except Kishanganj district. The unit of ISMR is taken as mm/100 on figs.2a-l, figs 3a-i, and figs. 4a-p, therefore it shows small variation in figs2a-l, 3a-I and 4a-p.Figs. 2a-l depicts decadal frequency of water deficit years and ISMR during 1901-2000 in districts of agro-climatic zones I. The decadal frequency shows very clear cyclic variation during 1921-30 to 1951-60 and again from 1951-60 to 1981-90 in many districts of zone I except in few other districts. A sharp increase in frequency of water deficit years is noticed from 1981-90 to 1990-2000 in each districts of this zone. The water deficit year variation follows almost similar trend of ISMR. Figs. 3a-i depicts decadal frequency of water deficit years and ISMR during 1901-2000 in districts of agro-climatic zones II. A significant increase in number of water deficit years is found during 1911-20 to 1931-40, 1951-60 to 1971-80 and 1981-90 to 1990-2000. The variation in water deficit years in districts of agro climatic zone II does follow corresponding variation in ISMR.Figs. 4a-p depicts decadal frequency of water deficit years and ISMR during 1901-2000 in districts of agro-climatic zones III. This zone is showing entirely different scenarios than that of zone I and II. The frequency of water deficit years is showing remarkable decreasing trend from 1901-10 to 1931-40 and significant increasing trend from 1941-50 to 1991-2000 in most of the districts in agro climatic zone III although variation is not very clear in few of the districts. It seems that changes in frequency of water deficit years are mainly due to the shortage of ISMR in the corresponding years. It is also found that in districts of the agro climatic zone III, towards south of the Ganga (yellow colour area in Fig.1), the frequency of water deficit years is more and trend is different in compare to districts of agro climatic zone I and II. Fig.5 represents the spatial distribution of total number of water deficit years during 1901-2000 in each districts of agro climatic zone I, II and III. It is found that districts of agro climatic zone III have large number of water deficit years followed by zone I and II. It may be due to relative deficiency of ISMR in agro climatic zone III. The above scientific analysis is validated by response of local community through conducting questionnaire in few of the districts of each zone. It is found that both studies is well supporting to each other. The response of local community in agro climatic zone III indicates that sever water scarcity has been persisted to irrigate their crops. Even during ISMS, there is no enough surface water to sow and irrigate their paddy crops. Local community informed that during lean period, there is no surface water in local reservoirs named aahar, chaurs, ponds. Deep wells and hand pumps are generally dried up. The people from zone I, II and III claim that erratic rainfall (on temporal and spatial scale) during ISMS is observed many times which may responsible for shortage of surface water. To cope with the water deficit conditions small farmers generally go for some other occupations whereas economically capable farmers generally choose to agriculture of those crops which requires less water for irrigation.
 | Figure 2. a-l Decadal frequency of water deficit years and ISMR (mm/100.0) during 1901-2000 in Agro-climatic zones I of districts (a) E.Champaran, (b) W.Champaran, (c) Dharbhanga, (d) Madhubani, (e) Sitamarhi, (f) Samastipur (g) Muzaffurpur, (h) Vaishali, (i) Sheohar, (j) Gopalganj, (k) Siwan and (l) Saran |
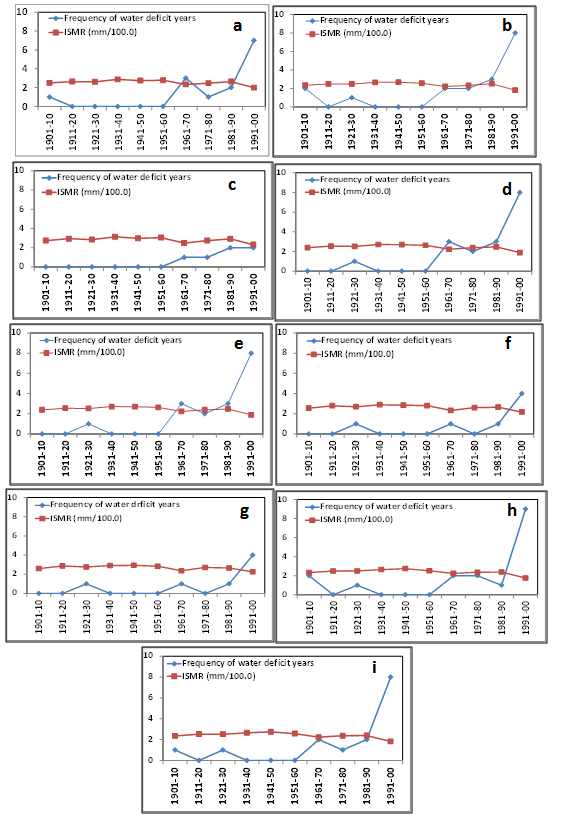 | Figure 3. a-i Decadal frequency of water deficit years and ISMR (mm/100.0) during 1901-2000 in Agro-climatic zones I of districts (a) Supaul,, (b)Saharsa, (c)Araria, (d)Madhepura, (e)Kisanganj, (f)Purnia, (g)Katihar, (h) Begusarai and (i) Khagaria |
 | Figure 4. a-p Decadal frequency of water deficit years and ISMR (mm/100.0) during 1901-2000 in Agro-climatic zones III of districts (a) Bhagalpur, (b) Munger, (c) Lakhisarai, (d) Banka, (e) Jamui, (f) Nalanda, (g)Sheikhpura, (h) Nawada, (i) Gaya, (j) Jehanabad, (k)Patna, (l) Buxar, (m) Bhojpur, (n) Aurangabad, (o) Rohtas and (p) Kaimur |
 | Figure 5. Total number of water deficit years in the districts of Bihar during 1901-2002 (Number in Red colored shows total number of water deficit years) |
5. Conclusions
- A simple water balance approach is used for estimation of available surface water in districts of agro climatic zones in Bihar state of India. In water balance equation, the high resolution rainfall and surface temperature data has been used for estimating surface runoff and water loss by using empirical relation. It is found that there is cyclic variation in frequency of water deficit years during 1921-30 to 1951-60 and 1951-60 to 1981-90 in the districts of agro climatic zone I and during 1911-20 to 1931-40, 1951-60 to 1971-80 in the districts of agro climatic zone II. During the period of 1901-2002, the districts of agro-climatic zone-III, south of the Ganga, shows significant increase in water deficit years from 1941-50 to 1991-2000. A sharp increase in frequency of water deficit years is noticed from 1981-90 to 1991-2000 in each district of agro-climatic zones of Bihar state of India. The total number of water deficit years during 1901-2000 is large in districts of agro climatic zone III followed by I and II. It may be due to relative deficiency of ISMR in agro climatic zone III.