Abiola O. , Ogunribido T. H. T. , Omoniyi B. A. , Ikuepamitan O.
Department of Geology, Adekunle Ajasin University, P. M. B. 001, Akungba Akoko, Ondo State, Nigeria
Correspondence to: Abiola O. , Department of Geology, Adekunle Ajasin University, P. M. B. 001, Akungba Akoko, Ondo State, Nigeria.
| Email: |  |
Copyright © 2012 Scientific & Academic Publishing. All Rights Reserved.
Abstract
The geoelectric assessment of the groundwater prospects in Supare Estate, Supare Akoko, Southwestern Nigeria, has been carried out in this study. The study area is underlain by Precambrian Basement Complex rocks of Southwestern Nigeria. These rocks are inherently characterized by low porosity and permeability. The interpretation of fourteen (14) vertical electrical sounding (VES) using the Schlumberger electrode array shows four geoelectric layers in the subsurface within the study area. These are the topsoil, weathered layer, partially weathered/ fractured basement and fresh basement. The overburden thickness varies from 2 to 18 m across the study area. This was used to prepare the groundwater potential map which assisted in the zoning of the area into low, medium and high groundwater potential zones. About 85% of the study area falls within the low/medium rated groundwater potential zone while the remaining 15% constituted the high groundwater potential zone. Hence, the groundwater potential rating of the area is considered generally low.
Keywords:
Geoelectric, Vertical Electrical Sounding, Overburden, Groundwater Potential
Cite this paper: Abiola O. , Ogunribido T. H. T. , Omoniyi B. A. , Ikuepamitan O. , Geoelectric Assessment of Groundwater Prospects in Supare Estate, Supare Akoko, Southwestern, Nigeria, Geosciences, Vol. 3 No. 1, 2013, pp. 23-33. doi: 10.5923/j.geo.20130301.03.
1. Introduction
The population of Akungba Akoko has increased rapidly, as a result of the location of Adekunle Ajasin University in the town in the last one decade. Therefore, the adjourning towns like Supare Akoko has also witnessed the influx of people (staff and students) from Akungba Akoko and this has led to increased demand for potable water.Safe water is a basic necessity of life and when it is not available and/or contaminated, it could have serious public health implications, ranging from diseases to outbreak of epidemics. In the past, rain water, streams, and lakes were the major sources of water to humans. However, they are unsuitable sources of drinkable water due to pollution and contamination as result of human activities[1].The aforesaid, among others, have necessitated the need for groundwater exploration in Supare Estate, Supare Akoko. Available reports have shown that there is an abandoned borehole in the study area. The reasons for this may include: selection of wrong point, poor data quality/incomplete information from the subsurface, lack of technical ‘know- how’ and poor development of drilled holes among others, which are rampant in Basement Complex terrain.The study area, Supare Estate, Supare Akoko, Southwestern Nigeria, falls between latitude 7o 26’50’’ N and 7o 27’50’’N and longitude 6o 40’76’’E and 6o 41’76’’E (Figures 1 and 2).The study area is underlain by Precambrian Basement Complex rocks. These rocks are inherently characterized by low porosity and permeability. The highest groundwater yield in basement terrains is found in areas where thick overburden overlies fractured zones; these zones are often characterized by relatively low resistivity values [2]. The most probable use of the electrical resistivity survey is in hydrogeological investigation in relation to aquifer delineation, lithologic boundaries and geological structures to provide information about the subsurface [3]. However, groundwater occurs either in the weathered mantle or in the joints and fractured system in the un-weathered rocks [4]; [5]; [6].
2. Materials and Method of Study
The geophysical prospecting method adopted for this study is the Electrical resistivity method and Vertical Electrical Sounding (VES) techniques. The ABEM SAS-1000 Terrameter was used along with four metal electrodes, hammer for driving the electrodes in the ground, and four reels of connecting cables (two black coloured for current and two red coloured cables for potential electrodes), measuring tape, cutlass for cutting traverses, and clips. Global Positioning System (GPS) was used to ascertain the coordinate of the VES points. Calibrated rope and data sheet were used for recording the field data during geophysical data acquisition. The resistivity meter contains both the transmitter unit, through which current enters the ground and the receiver unit, through which the resultant potential difference is recorded.The Schlumberger array was adopted for the study and the electrode spread of AB/2 was varied from 1 to a maximum of 65m. The expected depth of investigation was (D) = 0.125 L, where L = AB/2, and AB is the current electrode separation. Sounding data were presented as sounding curves, obtained by plotting apparent resistivity against AB/2 or half the spread length on a bi-log paper.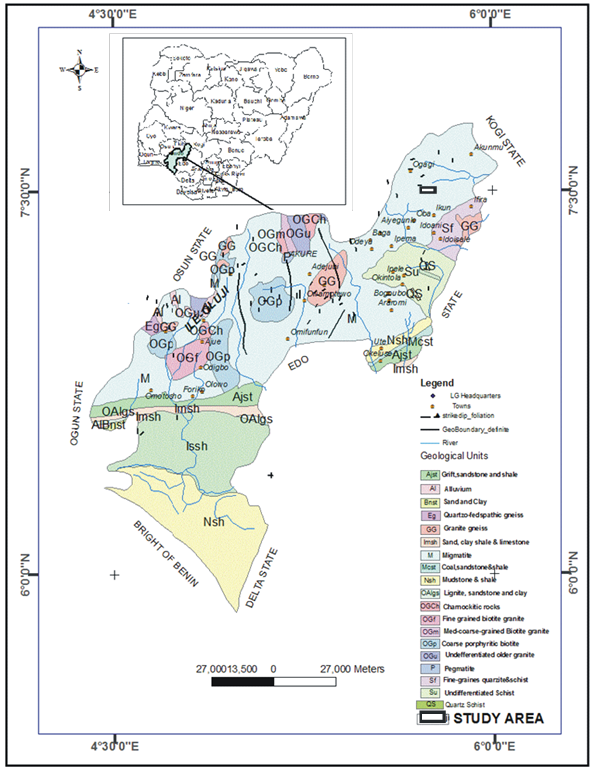 | Figure 1. Geological map of Ondo State showing Study Area (Modified after GSN) |
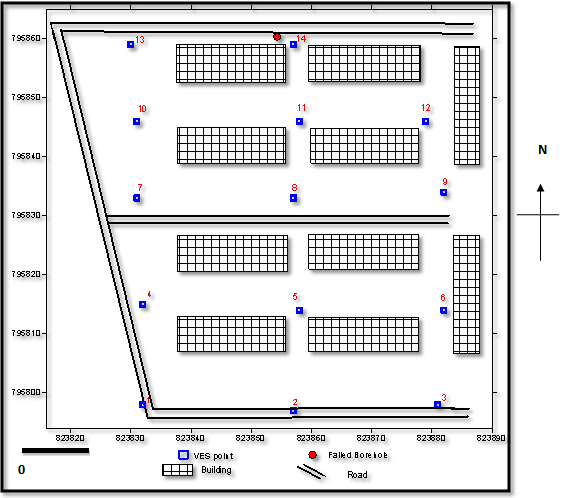 | Figure 2. Base map of the Study Area showing the distribution of VES stations |
Ground resistance (R) measurements were recorded with the ABEM SAS-1000 Terrameter. The electrical resistances obtained were multiplied by the corresponding geometric factor (k) for each electrode separation to obtain the apparent resistivity (ρ = kR) in ohm-meter. The models obtained from the calculations above were used for computer iteration to obtain the true resistivity and thickness of the layers. Computer-generated curves were compared with corresponding field curves by using a computer program “Resist” version 1.0. The software was further used for both computer iteration and modelling.Areas where the overburden thickness was greater than 25 m and are of low clay content (resistivity above 100 Ω-m) were considered zones of high groundwater potential while those within 10 and 25 m are zones of medium groundwater potential and less than 10 m are of low groundwater potential [7] and [8].
3. Presentation of Results
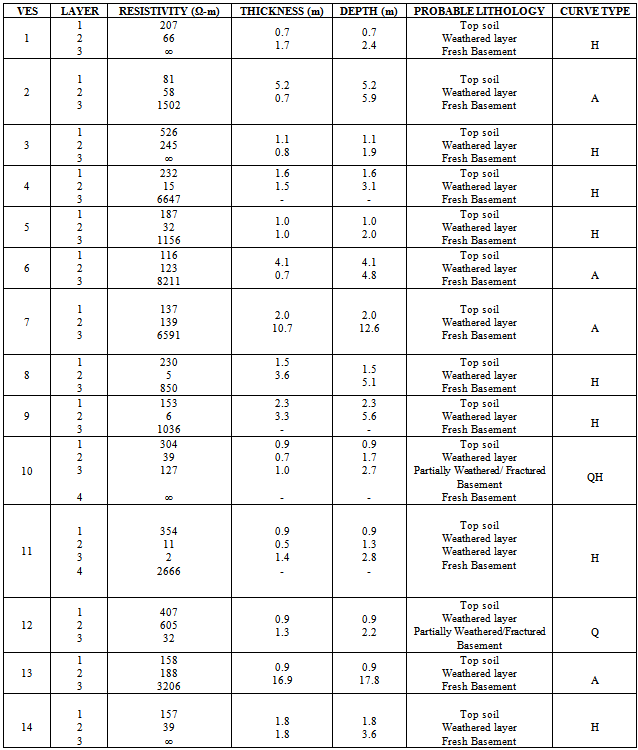
Fourteen (14) Schlumberger depth sounding points (Figure 2) were covered within the study area. The data acquired were presented as frequency distribution chart, sounding curves, geoelectric sections and maps. Table 1 shows the summary of the VES results in terms of the geoelectric properties of the study area. These parameters were used to prepare geoelectric sections and subsurface maps such as isoresistivity, isopach and groundwater potential maps.
3.1. Vertical Electrical Sounding (VES) Curves
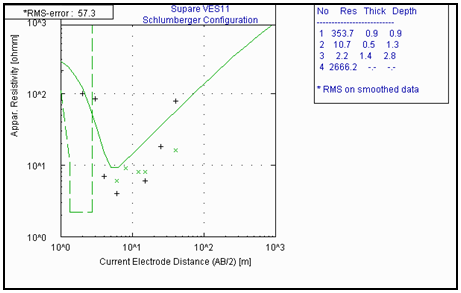
It was observed that the H-type curve is the most dominant (Figure 3), accounting for 50%, often associated with groundwater possibilities while type A, accounting for 29% of the curve type, which may typify a rapid resistivity progression, indicative of shallow, resistive bedrock. K-curve only account for 7% and QH-curve account for 14%. Approximately 86% of the soundings are 3-layered that is A, K and H-types (Figure 4a) while 14% also are 4-layered, that is, QH –type curve (Figure 4b).Table 1. Summary of Interpreted Results of the Study Area
 |
| |
|
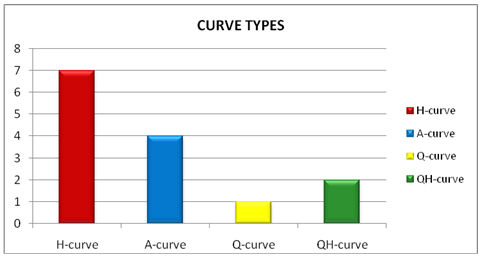 | Figure 3. Frequency distribution chart of observed curve types in the Study Area |
 | Figure 4a. Typical H curve type |
 | Figure 4b. Typical QH curve type |
3.2. Geoelectric Sections
The VES interpretation results were used to prepare 2-D geoelectric sections displayed in Figures 5a and 5b. The sections give an insight into the structural disposition of subsurface rock units. The geoelectric sections delineated a maximum of four geoelectric subsurface layers comprising the top soil, weathered layer, fractured basement and fresh bedrock.From the frequency distribution table, it is noted that in 50% of the sounding points, the bedrock model resistivity is less than about 5000ohm-m. In such instances, investigation has shown that the bedrock is incompetent and mostly fractured [9].
3.2.1. Topsoil
The topsoil constitutes the first layer with resistivity values ranging from 81 to 526ohm-m, indicating that the topsoil is mainly clayey sand to sandy clay, with thickness range of 0.7 to 4.1m.
3.2.2. Weathered Layer
The weathered layer is the second layer with resistivity values ranging from 5 to 605 ohm-m, indicating that the material composition is largely clayey to sandy clay and thickness of 0.7 to 16.9 m. The highest thickness is around VES 7. In respect of the hydrogeology, the second layer has groundwater significance, where it is thick enough and the amount of water saturating it is high.
3.2.3. Partially Weathered/Fractured Basement
The partially weathered/fractured basement was delineated beneath VES 10 and 12. The layer constitutes the main aquifer unit in the study area. The resistivity values fall between 32 and 127 ohm-m and it is 2.7 m thick at VES 10. It occurs as the last observable layer in VES 12.
3.2.4. Fresh Basement
The fresh basement is the last layer with the resistivity values ranging from 850 ohm-m to infinity At most of the VES stations; it is infinitely resistive because of its crystalline nature.
3.3. Subsurface Maps
3.3.1. Isopach and Isoresistivity Maps of the Topsoil
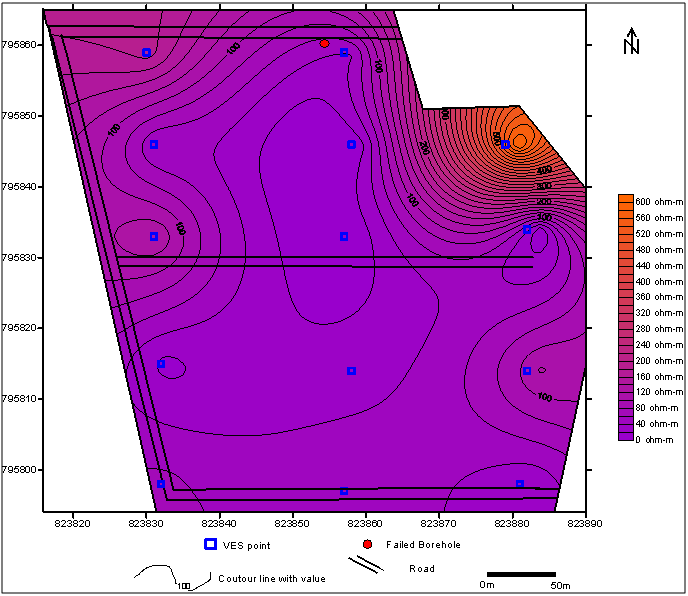
Figure 6a is the isopach map which shows the thickness distribution of the topsoil in the study area. It could be observed that the thickness is greater than 4 m at the southern and the south-eastern parts and less at other parts of the area. The isoresistivity map of the topsoil (Figure 6b) shows the resistivity values ranging from 116 to 600 ohm-m. The map reveals the heterogeneity in the composition of the topsoil, whose composition varies from sandy clay to laterite. The north-eastern and eastern parts of the study area has resistivity values greater than 400 ohm-m, diagnostic to be highly sandy while the remaining parts have resistivity values less than 400 ohm-m, diagnostic of sandy clay. | Figure 5. Geoelectric Sections along W-E and S-N directions |
3.3.2. Isopach and Isoresistivity Maps of the Weathered Layer
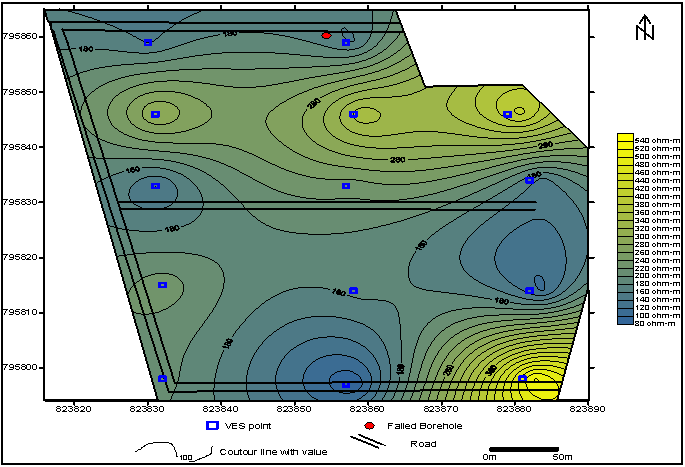
Figure 7a is the isoresistivity map of the weathered layer, considered to be the main aquifer unit in the area. The resistivity value of the layer lies between 5 and 605 ohm-m, while the most frequently occurring resistivity values are between 5 and 66 ohm-m, typical of clay which may be constantly saturated but poorly permeable to the interstitial formation water for abstraction. Highest resistivity is observed in the north-eastern part of the study area.Figure 7b shows the isopach map of the weathered layer. It depicts the variations in the thickness of the layer in the study area. It varies from 0.5 to 16.9 m, thickest at the western and north-western parts. The south-eastern part of the map shows the lowest thickness in the area.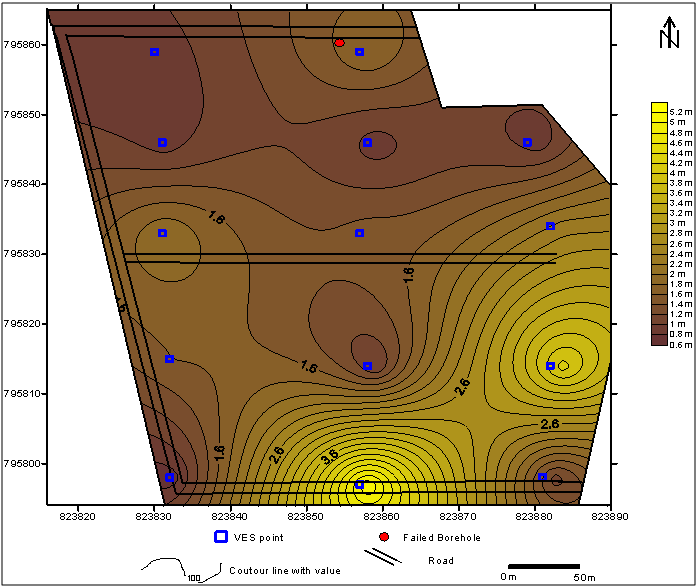 | Figure 6a. Isopach Map of Topsoil |
 | Figure 6b. Isoresistivity Map of the Topsoil |
 | Figure 7a. Isoresistivity Map of the Weathered Layer |
 | Figure 7b. Isopach Map of the Weathered Layer |
 | Figure 8. Isopach Map of the Overburden |
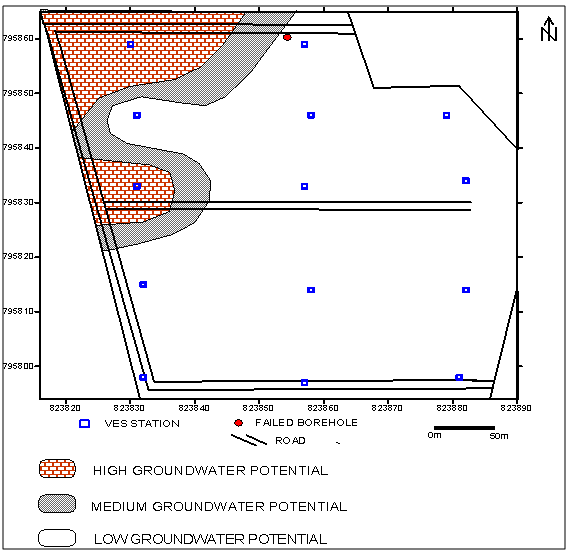 | Figure 9. Groundwater Potential Map of the Study Area |
3.3.3. Isopach Map of the Overburden
The overburden is assumed to include all materials above the presumably fresh basement. Figure 8 shows the isopach map of overburden in the study area with thickness ranging from 2 to 18m. At the north-western flank, the overburden is thick, ranging from 10 to 18m. Towards the western flank of the study area, the overburden is fairly thick with a range of 6 to 12m. Generally, areas with thick overburden usually coincide with basement depressions and with low percentage of clay in which intergranular flow is dominant. Such areas are known to have high groundwater potential particularly, in basement complex terrain [10].
3.4. Groundwater Potential Evaluation
Figure 9 is the groundwater potential map of the study area. The above observed thickness and nature of the weathered layer are important parameters in the groundwater potential evaluation of a basement complex terrain[11];[12]. The horizon is also regarded as a significant water-bearing layer[13];[12] especially if significantly thick and the resistivity parameters suggest saturated conditions.The groundwater prospects of the study area are zoned into high, medium and low potentials. In this study, zones where thickness of the aquifer is greater than 10 m and of low clay content (average resistivity values between 150 and 300 ohm-m) are considered zones of high groundwater potentials. The north-western part of the study area falls within the high potential zones (Figure 9). The zones with average resistivity values lie between 80 – 120 ohm-m and are less than 10 m thick. These are classified as medium groundwater potential zones. The south-western, eastern and the central portions of the study area fall within the low groundwater potential rating where the thickness of overburden is below 10 m and with average resistivity value less than 80 ohm-m. These portions constitute a sizeable segment of the study area.From the isoresistivity maps of the topsoil and weathered layer, Figures 6 (b) and 7 (a) respectively, it was observed that the clay content of the overburden is high, which informed the low groundwater potential rating of the study area owing to low permeability usually associated with clay. It was observed that about 85% of the area falls within the low/medium groundwater potential rating while only about 15% constitutes the high potential rating. This suggests a generally low groundwater prospect of the study area.
4. Conclusions
In this study, the groundwater prospects of the rock units of Supare Estate, Supare Akoko, Southwestern Nigeria was undertaken using 14 Schlumberger Vertical Electrical Soundings (VES). The curve type varied from simple three-layer A, K and H-types to the complex QH curve. The computer iterated sounding interpretation revealed four subsurface sequence composing topsoil with limited hydrologic significance, weathered layer, partially weathered/fractured basement and the fresh basement. The weathered layer constituted the sole aquifer unit in the area; the yield being dependent on degree of the clay content. The higher the clay content, the lower the groundwater yield. The characteristic geoelectrical parameters of the delineated aquifer at each sounding station were used to produce the groundwater potential map of the area.About 85% of the study area falls within the low/medium rated groundwater potential zone while the remaining 15% constituted the high groundwater potential zone. Hence, the groundwater potential rating of the area is considered generally low. The results of this study have provided reliable information for an elaborate groundwater abstraction and also identify the cause of the borehole failure in the area, which was due to high content of clay in the aquiferous layer and the thin thickness of the layer. Future groundwater development in the study area should, therefore, be concentrated within the high/medium groundwater potential zones.
References
| [1] | Olorunfemi, M.O., Ojo, J. S., and Akintunde, O.M. (1999). Hydro-geophysical Evaluation of the Groundwater Potentials of the Akure Metropolis, South-Western Nigeria, Journal of Mining and Geology Vol. 35(2), 207-228. |
| [2] | Olorunfemi, M. O. and Fasuyi, S. A. (1993). Aquifer Types and the Geoelectric/hydrogeologic Characteristics of Part of the Central Basement Terrain of Nigerian (Niger State)’, J. African Earth Science 3(3), 309–317. |
| [3] | Bose K.N., Chatterjee D., Sen A.K. (1973). Electrical Resistivity Surveys for Groundwater in the Aurangabad Sub-division, Gaya District, Bihar, Indian pp. 171-181. |
| [4] | Olorunfemi M.O., Olorunniwo M.A. (1985). Parameters and Aquifer Characteristics of some parts of SW. Nigeria Geologic Applica E. Hydrogeological, XX Part 1, pp. 99-109. |
| [5] | Ako, B. D. and Olorunfemi, M. O. (1989). Geoelectric Survey for Groundwater in the newer Basalts of Vom, Plateau State’, Nigeria J. Mining Geol. 25, 142, 247–250. |
| [6] | Olayinka A.I., Olorunfemi M.O. (1992). Determination of Geoelectrical Characteristic in Okene Area and implication for boreholes setting. J. Min. Geol., 28: 403 - 412. |
| [7] | Oladapo, M.I, Akintorinwa, O.J., (2007). Hydrogeophysical Study of Ogbese Southwestern, Nigeria. Global J. Pure and Applied Sci. 13(1): 55-61. |
| [8] | Abiola O., Enikanselu P.A., and Oladapo M.I. (2009). Groundwater Potential and Aquifer Protective Capacity of Overburden Units in Ado-Ekiti, Southwestern Nigeria. International Journal of Physical Sciences Vol. 4 (3), pp. 120-132. |
| [9] | Hazell, J.R.T., Cratchley, C.R. and Jones, C.R.C., (1992). The Hydrogeology of Crystalline Aquifers in Northern Nigeria and Geophysical Techniques used in their exploration. In: Wright, E. P. and Burgess, W.G. (Eds). The hydrogeology of crystalline basement aquifer in Africa Geological Society Special Publication, No. 66, pp. 155-182 |
| [10] | Okhue, E.T. and Olorunfemi, M.O., (1991). Electrical Resistivity Investigation of a Typical Basement Complex Area- the Obafemi Awolowo University Campus case study. J. Min. Geol. 27(2).66-70. |
| [11] | Clerk L. (1985). Groundwater Abstraction from Basement Complex Areas of Africa. J. Eng. Geol., London 18: 25-34. |
| [12] | Bala A.E., Ike E.C. (2001). The Aquifer of the Crystalline Basement Rocks In Gusau Area, Northwestern Nigeria. J. Min. Geol. 37(2): 177-184. |
| [13] | Shemang E.N. (1993). Groundwater Potentials of Kubami River Basin, Zaria, Nigeria from D. C. Resistivity Study Water Resources, 1(2): 36-41 |
 Abstract
 Reference
 Full-Text PDF
 Full-text HTML