Khawar Ashfaq Ahmed1, Ha Quang Man2, Yasir Zeb3
1Quaid-i-Azam University, Islamabad, Pakistan
2AGH University of Science and Technology, 30 Mickiewicza Av.30-059, Krakow, Poland
3Dewan Petroleum (Pvt.) Ltd. Islamabad, Pakistan
Correspondence to: Khawar Ashfaq Ahmed, Quaid-i-Azam University, Islamabad, Pakistan.
| Email: |  |
Copyright © 2012 Scientific & Academic Publishing. All Rights Reserved.
Abstract
Purpose of the study is the geoscientific work in the Soan Block using seismic and well log data. The seismic lines cover the Bhangali oil field and Pindori oil field. Both oil fields are productive and Pindori oil field has many wells running for the oil extraction. Six seismic lines are used for the seismic interpretation. There are two major rocks important for the exploration and production which are Eocene rocks known to be Chorgali Formation and Sakesar Formation. Thrust tectonics made this area important for the hydrocarbon exploration. The two important structural traps here are the back thrust on which there are many Pindori wells and the other is fore thrust on which Bhangali wells are present. Also on this fore thrust, there are some other oil and gas fields which have productive wells, so these two thrust faults are of importance. The fore thrust is correlated with the seismological data which proved its oblique slip nature. Due to thrusting and oblique slip, there is huge fracturing which made the Eocene good reservoir. Three wells are used for the well log interpretation. The logs are used for the conformation of the seismic interpretation and then for the calculation of facies of the reservoir rock. Later the facies are confirmed from the well reports. The calculated facies are used for the 3D facies modeling which shows the actual sub surface 3D view of the reservoir rock.
Keywords:
Seismic, Tectonic Plates, Potwar Plateau , Sediment, Carbonate rock, Potwar, Faults
Cite this paper: Khawar Ashfaq Ahmed, Ha Quang Man, Yasir Zeb, Seismic Facies Modelling of Potwar Basin Using Seismic and Well Log Data, Geosciences, Vol. 2 No. 6, 2012, pp. 192-211. doi: 10.5923/j.geo.20120206.07.
1. Introduction
The Pindori Oilfield is located in the southeast of Potwar basin, about 67 km southwest of Rawalpindi in the Punjab Province. Pindori structure is 18 km west of Bhangali field and about 16 km northwest of Turkwal field. These three villages are Bains, Bahiya and Pindori. That’s why the field is called as Pindori Oil Field.[4]
1.1. Location of Study Area
The location of the Pindori oil field is from longitude 72.3º to 73.2ºE and latitude 33.0º to 33.3ºN. The oil field area is as shown in the following map. This oil field is present very near to the Rawalpindi/Islamabad twin cities. The field is present to the south east of the cities. This area is highly important in every respect (i.e. geological, geophysical and seismological point of view). The area is present in high compressional regime and there is huge fracturing due to this reason. This area has the trapping structure with the good reservoir rock which is very much productive. Tectonically the area is highly in compressional regime with the thrust faulting. Also there is to some extent strike slip component in this surrounding area. Due to compression, fractured zones are present which may be the good reservoir for the hydrocarbons. Also this area is seismologically important due to the faults in the surrounding area. This area is seismologically active area and some major faults are also present nearby.[4]The location of the study area also have some of the streams and nullas that are passing through. Out of these the Soan River is the important one which falls in the Indus River. Whereas most of the streams are rainy and they flow in the rainy season. Map of research area is as shown in Figure 1.
1.2. Data
The present study dealt with the integrated geophysical work of Potwar area. For this purpose, both seismic and seismological data has been collected from various sources described below
2. Objectives of Study
Some major points of the study of this area are marking of the desired zone of interest, mapping and modeling of the reservoir rock, correlation of the different wells of oil field, cross plot of the facies of the reservoir rock, facies calculation of different wells and making a facie model.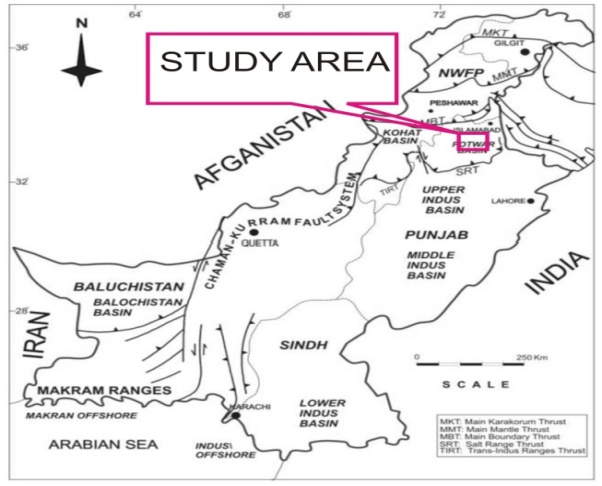 | Figure 1. Pakistan Map High lightening Research Area |
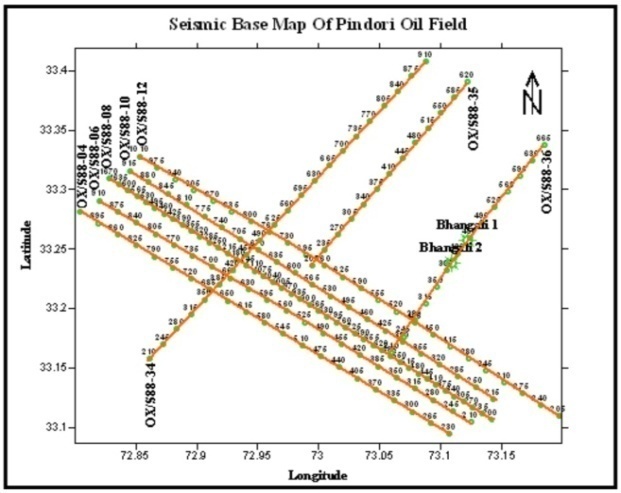 | Figure 2. Basemap of the study area showing the location of seismic lines and wells |
3. Structure Geology and Tectonics
Pakistan has been divided into different tectonic zones and basins out of which broad are as under:
3.1. Indus Basin
The Indus Basin belongs to the class of basins. It is the largest sedimentary basin of Pakistan. The basin is oriented in NE-SW direction. Basement is exposed as outcrop at two places, one in NE as Sargodha High and second in SE as Nagger Parker High. It comprises of normal to moderate and some steeply dipping structures. The compressional regime of the tectonic plates resulted the basin into Upper, Middle and Lower Indus basin.
3.2. Potwar Plateau
In Potwar basin, the Upper Indus basin is one of the oldest oil producing basin in this region. Here, mostly the productive reservoirs are Eocene and Paleocene carbonates although more recent exploration are some deeper targets zones of Permian formations.[13] The Potwar is surrounded by Kalachitta ranges and Margala Hills , the Indus River and Kohat Plateau to the west, and the Jhelum River and the Hazara-Kashmir syntaxes to the east. It is covered by the Siwalik sequence in large scale, although at some places upper Eocene shales and limestone's locally in folded outliers. The Soan syncline divides the Potwar Basin into two major zones as Northern Potwar Deformed Zone (NPDZ) and Southern Potwar Platform Zone.[13]
3.3. Structure and Tectonics of the Potwar Plateau
The induction of salt is more intense in the western Potwar Plateau. Apart from the Potwar Plateau, in this region salt is only present in Kohat basin at much higher level i.e. Eocene. It forms as an allocthon within the sedimentary basin gliding far in southward direction and has suffered relatively less northward movement. It is heterogeneous in style of tectonic intensity, direction and extension. There is interplay of basement and cover tectonics in which, generally the cover reaction is in the form of folding and faulting. The deformation and uplift of the Potwar Plateau is still going on. An evidence of this ongoing deformation and uplifting is shown by the meandering coarse of the Soan River, which straightens near the younger structures of Khaur and Dhulian.[6]Data based on the balanced cross section across the Potwar Plateau suggest that the Potwar Plateau on average has suffered about 20 % crustal shortening along its breadth. However the available data indicate about 30 % more shortening in the western part of Potwar Plateau that is almost double the rate of shortening to the eastern Potwar Plateau.[5]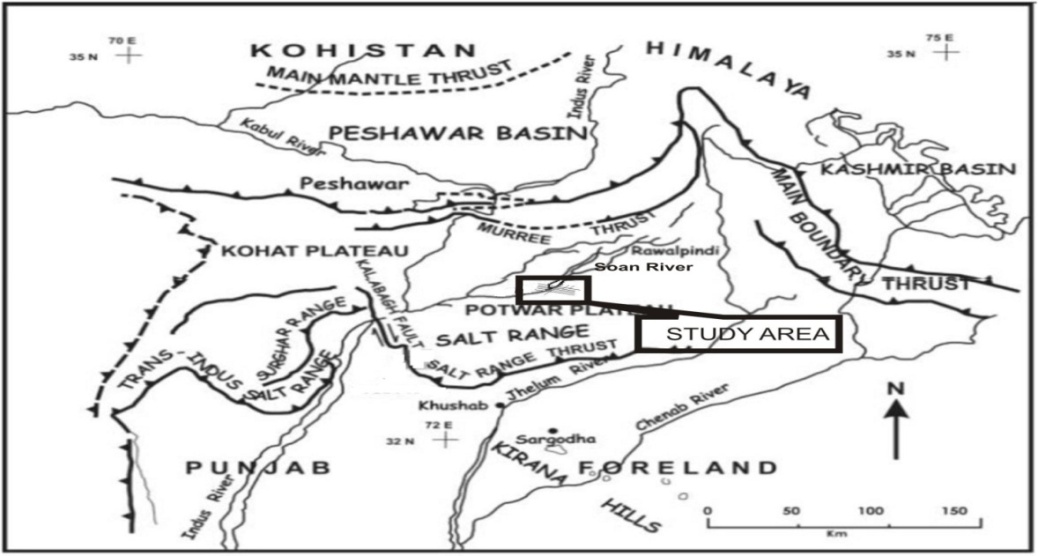 | Figure 3. Tectonic map of Northern Pakistan |
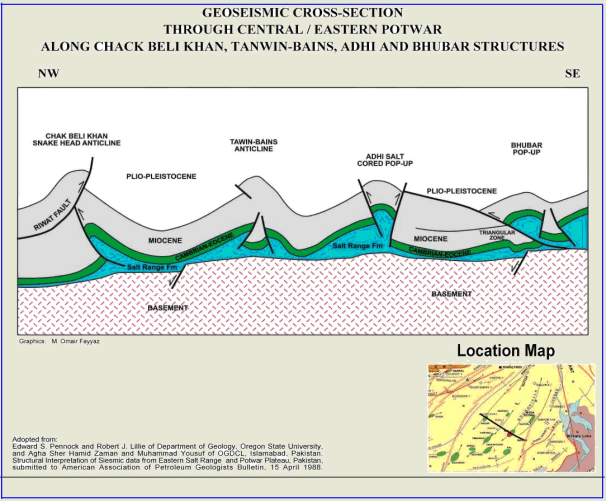 | Figure 4. GeoSeismic cross-section through central/eastern Potwar |
The tectonics framework of the Potwar Plateau have resulted from the northward underlying thrusting by the Indian plate under its sedimentary cover. Active foreland thrust migrating southward has caused the incorporation of the Potwar Plateau within the acrogenic belt.[6] Different styles of deformation in Potwar Plateau are due to variation in stresses (directional dependent and intensity with varying time) and varying behavior of different lithology. In northern Potwar Plateau, stress is more active than the south. As the Potwar Plateau moves nearer the collision zone some tight fold nappes zones develop which have been thrusted over the NPDZ. According to Moghal et. al, based on the seismic interpretation, the structures in the Potwar area may be divided into following;1. Triangle zone[3].2. Salt cored anticlines.3. Snake head anticlines4. Pop-up anticlines.Structural cross section is as shown in Figure 4.
3.4. Major Structures in Potwar
Southern margin of Himalayan collisional zone along with the fold and thrust belt was represented by the Potwar zone. While observing particular zone, faults of different variety were observed.
3.5. Faults in Potwar Basin
Some of the tectonic features of the Potwar Basin as.
3.6. Khair-I-Murat Fault (KMF)
Khair-i-Murat Fault (KMF) is a north-dipping main emergent thrust in the Potwar. Eocene Carbonates of high velocity are thrusted southward over the Molasses of low velocity.[4]. Jadoon et. al explained that, it soles out in the basal decollement at a depth of about 9 km[12].citation here and ref down. Jaswel et al observed that, faults that have steep dips at the surface containing high faulted beds of Murree Formation to its north was due to back rotation, where alluvium covered most of the area.[4]
3.7. Dhurnal Back Thrust (DBT)
Recent research has proved that DBT (Dhurnal Back Fault) as a different fault. The reason is for with different movement. In previous research, DBT had been considered as the eastward extension of the Kanet Fault (KF). It joins the KF west of Dhurnal and diverts towards the southwest, gradually dying out at the surface. Jadoon, et. al explained that, steep DBT becomes shallower to the south which dies out at a depth of 2 to 4 km. It merges with a north-dipping blind thrust that propagates up as a ramp from a layer of Eocambrian evaporites at a depth of about 8 km and flat along a pelitic horizon in Miocene Molasses strata.[12]
3.8. Kanet Fault (KF)
The emerging thrust in the western part of the Potwar is a north-dipping KF. KF bound the Kanet syncline from the north[4]
3.9. Mianwali Fault (MF)
Intrafomrational thrust at the surface is MF. MF can be traced only in streams. On the basis of faulted Brecca and Shear zones, Outcrop is present only in steams. Steep dips are exposed in the area between MF and KMF representing the northern Siwalik in the rocks having rocks.[4]
3.10. Riwat Fault (RF)
In the eastern Potwar Plateau, Hinterland-dipping fault with passive roof trust is RF in south of Soan syncline. Along the southern flank of the Chak Beli Khan anticline, RF dies out. In Northeast RF dies out near the Soan syncline axis.[8]
4. Folds of Potwar Basin
Beside major faults, some other structures are also present in the area as follows:
4.1. Soan Syncline
Potwar Plateau divided into northern and southern Potwar deformed zone by the Soan Syncline. Soan Syncline is broad, wide and asymmetrical syncline. Its axis is marked by the Soan River. Dhok Pathan Formation overlying the Nagri Formation crops out south of Dhurnal area on the northern limb of Scan syncline. Here crustal shortening is due to the collisional tectonics.[4]
4.2. Chak Naurang Anticline
Chak Naurang has two dipping limbs. These limbs are namely, southern limb which is dipping steeply while northern limb dipping moderately. Anticline is an example a fault-propagated fold. A strong northward-dipping basement reflector which is overlain by a thick evaporite srata shown in the Reflection data.[8]
4.3. Structure of the Oil Field
Pindori structure is exposed at the surface as an faulted anticline. Formerly this structure was known as Chakbeli Khan anticline and it is located in the east of Potwar Basin. The structure strikes northeast to southwest direction. Surface structure represents set of faults, which are parallel to the strike of structure. Sub surface structure represents a complex interaction of strike slip and reverse movement to oblique convergence of Salt Range Formation. Pindori structure represents tightly folded asymmetric anticline, which is having Bhangali Oilfield in the Northeast and Dhurnal Oilfield in the Southwest. However, a strong folding trend is present on surface, which can be marked as Danda syncline in the Southeast direction and Turkwal anticline in the East. Steep dips indicating tight folding on the western side. The structure is well defined on surface as well as on sub surface seismic data. The area of the structure was mapped as 4631 acres on seismic map. Mechanical failure of one of Pindori well indicating deep rooted faults, which are probably dendritic in nature. Water flows on surface indicating well developed communication in the fracture system within structure in Miocene. Structurization in Potwar is mainly due to the decollement at a Salt Range Formation level. This field is very near to the southern edge of Salt range and has been affected by the northward movement. Rotational movement can be noted at Salt Range formation thrust fault. The eastern flank of the surface anticline represents more steep dip as compare to the western flank indicating direction of stress from the east which can be well understood by the basement exposure on the surface in the east (Kirana Hills). Surface anticline is 23 km long and 5 km wide mainly Chinji/Nagri Formations are exposed in its core.Seismic data indicates northward counter thrusts are dominant against southern thrusting. Pindori pop-up is related to the salt decollement with dip closure to the North, South, East and is closed by reverse fault in the west. Fracture system is not rhythmic in the field, which is heterogeneous and has not developed equally in the field. The profile view of the Potwar area with different structures and wells positions is as shown in Figure 5.
5. Geological Setting
The Pindori field is situated in the Potwar Plateau in which Eo-Cambrian to recent sediments are deposited. The oldest proven sedimentary rock in the area is the Eo-Cambrian Salt Range Formation, which consist of a sequence of evaporitic layers intercalated with marl deposited in an interior sag basin. Resting on the Salt Range is the package consisting of predominantly clastics (with minor carbonates) and contains within the shallow marine facies Khewra sandstone that is the main producer in few oil fields of the eastern Potwar Plateau. The major unconformity separates the succeeding Permian clastics sequence from the underlying Cambrian. At the base of the Permian Tobra Formation lies which is a tillite formed as a results of the widespread glaciations affecting Gondwanaland and at this time the formation marked erosional unconformity within the Pindori area where the entire upper Permian – Cretaceous section has been removed.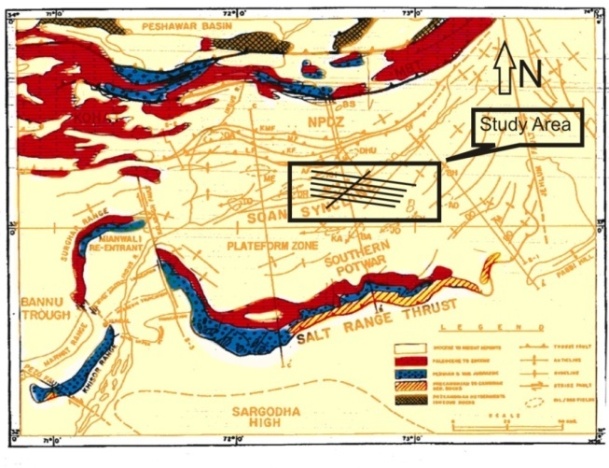 | Figure 5. Tectonic map of Potwar |
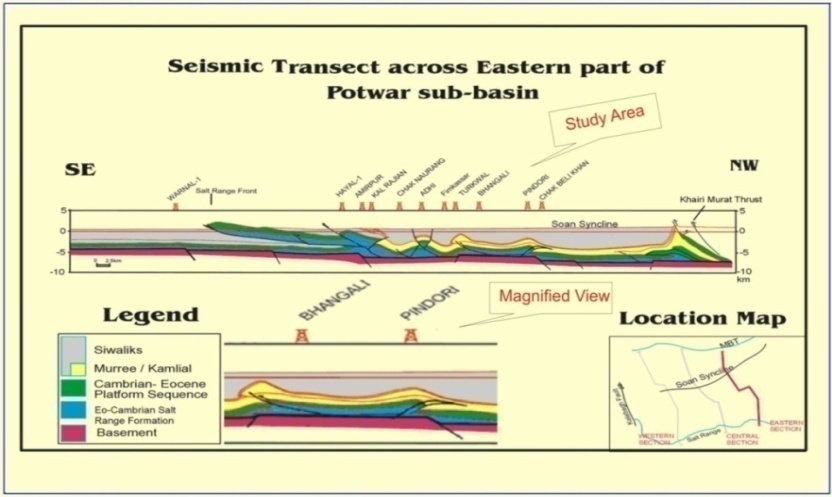 | Figure 6. Seismic transect across eastern part of Potwar sub-basin |
The overlying Paleocene sequence consists of a mixture of shallow marine limestone and fossil ferrous shale. The Patala shale is a prime candidate for the source rock in this area. Conformable with the Paleocene the Lower Eocene is predominantly limestone with minor shales and contain the Sakesar Formation which is the main producer in The Pindori field. Above the Eocene the rocks of Miocene, Pliocene are deposited in the Pindori area. The sedimentation in this area during the Paleozoic and Mesozoic was partly controlled by basement movement in the south. This movement resulted in depositional breaks and erosion, which has formed the erosion wedge of the pre-Paleocene sequence, that are seen across the basin. Early to Middle Cambrian rocks were deposited in littoral to shallow marine environments. Khewrite of igneous origin with oil shale was deposited before these and can be seen in Khewra Gorge. The basin was lifted during Silurian to Carboniferous time therefore no sediments were deposited in the Potwar Basin during this time. Cambrian sediments were subjected to erosion from east to west, forming Cambrian erosional unconformity. The basin then went through another depositional phase from Permian through Cretaceous. Towards the end of the Cretaceous a significant uplift occurred, eroding Cretaceous through Permian rocks from west to east across the basin forming an erosional break. An early Paleocene marine transgression resulting in thick deposits of Paleocene and Eocene, shallow marine carbonates in the basin. This wide spread carbonate rocks from the principal reservoir for the oil accumulation in the area. During the Himalayan acrogenic movement, commencing Late Eocene uplift and deformation of these pre-existing rocks started. Thick molasses sediments were rapidly deposited in the Himalayan fore deeps covering the Potwar basin.[13]
6. Stratigraphy of the Area
6.1. Lithological Description of the Section Drilled
The structural and stratigraphic study includes the out crop the formations at different places and the oil and water wells drilled in the area's the Salt Range-Potwar Foreland Basin. The oldest Formation of the cover sequence known to lie at the top of basement is the Eocambrian Salt Range Formation which is available as outcrop and at many places it is also in the subsurface which is confirmed from the well log data.Area lies in the southeast Potwar sub-basin where the orientation is northeast-southwest. The rocks of Miocene-Pliocene age which are known as Nagri Formation and Chinji Formations are exposed in the core of the structure. Here thrust tectonics plays important role.[6]The lithological formations are lying uncomfortably over Paleozoic formation, and the whole Mesozoic section is absent in and around the area which is the sign of unconformity. The Sakesar limestone and Chorgali Formations of Eocene age are the primary reservoir of this while Permian and Cambrian sandstones are secondary targets. The Eocene, Paleocene and Permian shales are supposed to be the potential source of oil and gas and cap rocks in Pindori region. The generalized stratigraphic column of the central Potwar is as shown Figure 7
6.2. Seismic Interpretation
The geophysical method most used for determining the structures of the subsurface is the seismic method. The most widespread implementation is Multifold Common Midpoint coverage by seismic reflection. This technique provides an echogram of the subsurface in two or three dimensional (2D or 3D).
7. Seismic Methods
The image obtained after processing is the seismic section. The horizontal axis of the section represents the geographical abscissa of the subsurface points along the acquisition profile and the vertical axes represents the record time. The seismic events that appear on the section correspond to the arrival of waves reflected at normal incidence on the seismic horizons. The seismic horizons corresponds to discontinuities of acoustic impedance, their picks provide a structural image of the subsurface. Analysis of attributes and the character of seismic events open the way to the stratigraphic and lithologic interpretation of the seismic reflection. Well seismic—the most common implementation is the vertical seismic profile, with or without offsetting the source—has a vertical resolution from meters to tens of meters with a lateral investigation extent of few tens to several hundred meters. It provides seismic time image comparable to a trace or a section from surface reflection seismic and allows a detailed calibration of the surface seismic in depth. Constrained by log data (sonic and density), it furnishes an acoustic impedance log at the well and below the bottom of well.[7]
7.1. Seismic Reflection Method
Seismic method is most commonly used geophysical techniques for investigating the subsurface. It has advantage over other methods due to greater penetration, higher resolution and accuracy. It is somewhat similar to earthquake seismology but different energy source. In earthquake seismology source of energy is natural but in exploration seismic source is artificial. Usually dynamite (or vibroseis) is used and the waves generated are recorded by detectors laid along the ground with different desired geometry. Variations in reflection times from place to place on the surface usually indicate the presence of subsurface features. Depth of reflecting interfaces can be determined from the seismic waves velocity and the corresponding velocity with different processing techniques.[11]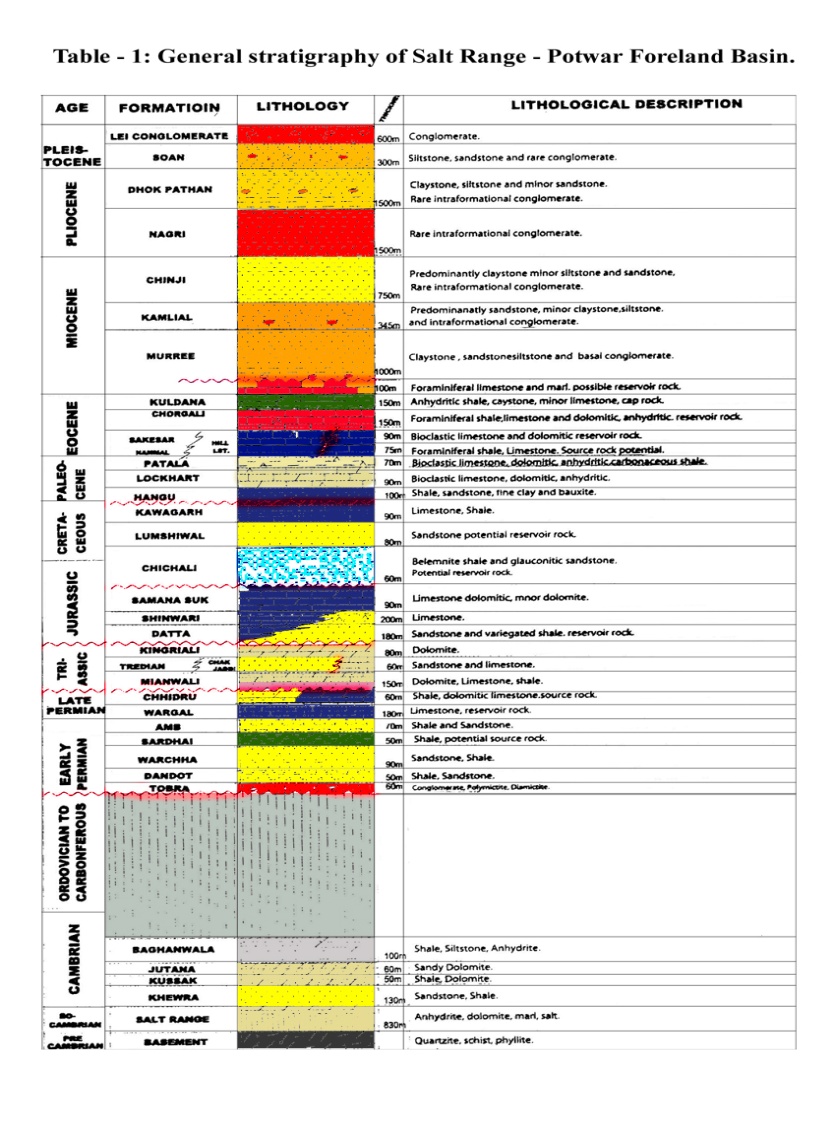 | Figure 7. General Stratigraphy of Salt Range – Potwar Foreland Basin |
Seismic reflection involves measuring the travel time of the reflected seismic energy, which travels down to the top of reflector (or other distinct acoustic impedance contrast), is reflected from the top of reflectors, and returns to the surface as a head wave along a wave front. The waves which return from the top of interface are reflected waves, and are recorded on geophones at a distance from the shot points, always represent the first arrival of seismic energy.[11]
8. Manual Interpretation
For interpretation, the seismic sections are used in the printed form. With the seismic section, the well formation tops are required for the marking of reflectors. After the marking of the reflectors, their travel time is noted which is then used for the depth calculation. In marking of reflectors, first the main reflectors are seen which then matched with the formation tops. Then the reflector is marked. After that the discontinuities and pinching out of the reflectors is observed. Those discontinuities are considered to be ruptures and faults which are marked also. Then after marking of the reflectors, the travel time is noted. After the marking of the reflectors, the different sections which have to be marked are tied. The ties are for the similar crossing point of a reflector. The ties of the reflectors are necessary for the mapping of the data, i.e. time/velocity/depth etc. The main point here is that the time picked form the seismic section is two way travel time (TWT). Then velocity windows are solved from which the average velocity is calculated. That average velocity is then marked with the time for the true depth of that reflector. Then the depth section is formed of the seismic sections.The seismic sections of the Soan Block(Pindori Oil Field) are long. Only two main reflectors are marked. One is Chorgali Formation and the other is Basement. The reason for marking of these two is that the Chorgali formation is the main formation which is the productive zone in this area. And also with Chorgali Formation there is Sakesar Formation in this field. But the Chorgali formation and the Sakesar formation comes in the same wiggle so we have marked one. Rest of the formations are not of our interest so they are not marked. The marked seismic sections are as following in which both the time and depth section is given in Figure 8 to 13.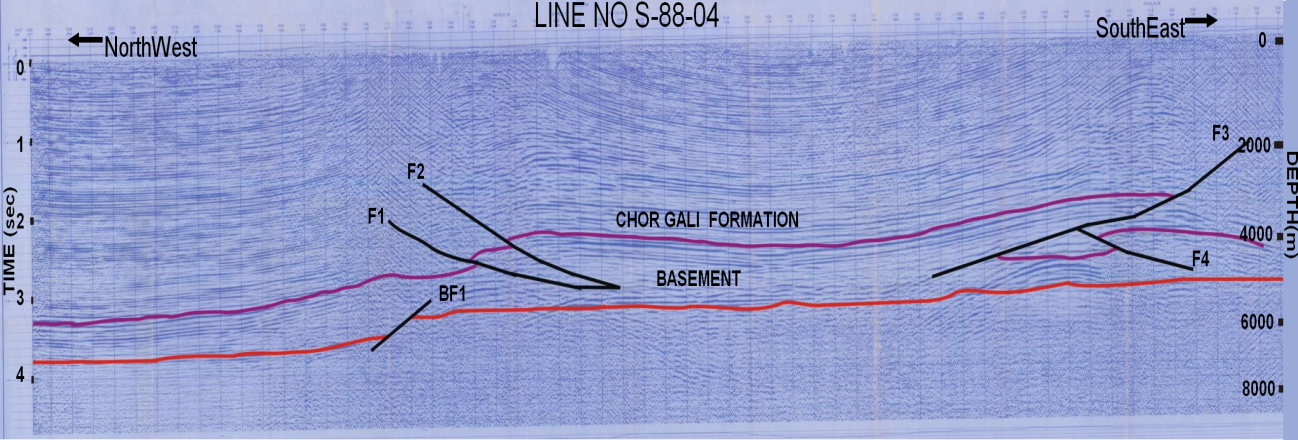 | Figure 8. Graph of Section of line number S-88-04 Time VS Depth |
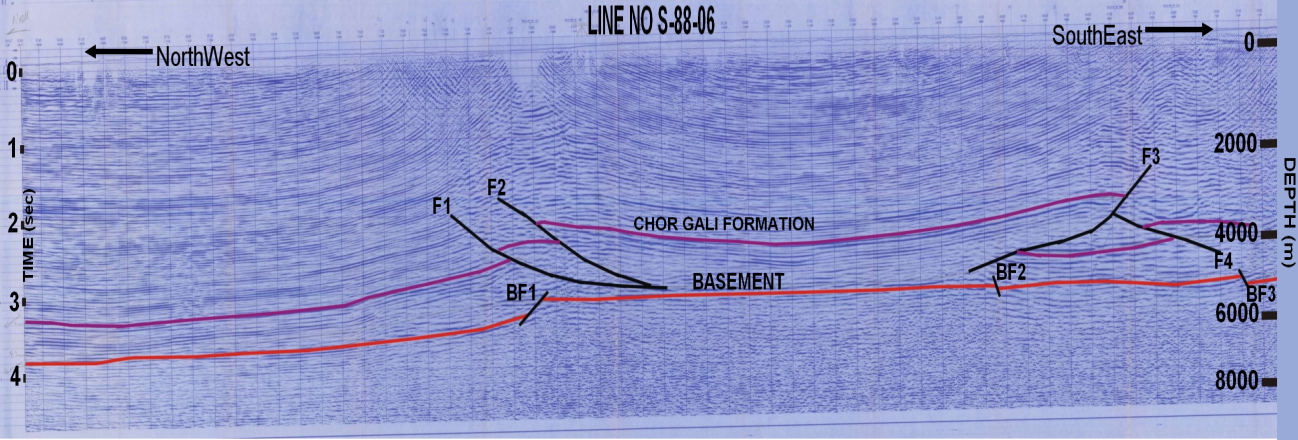 | Figure 9. Graph of Section of line number S-88-06 Time VS Depth |
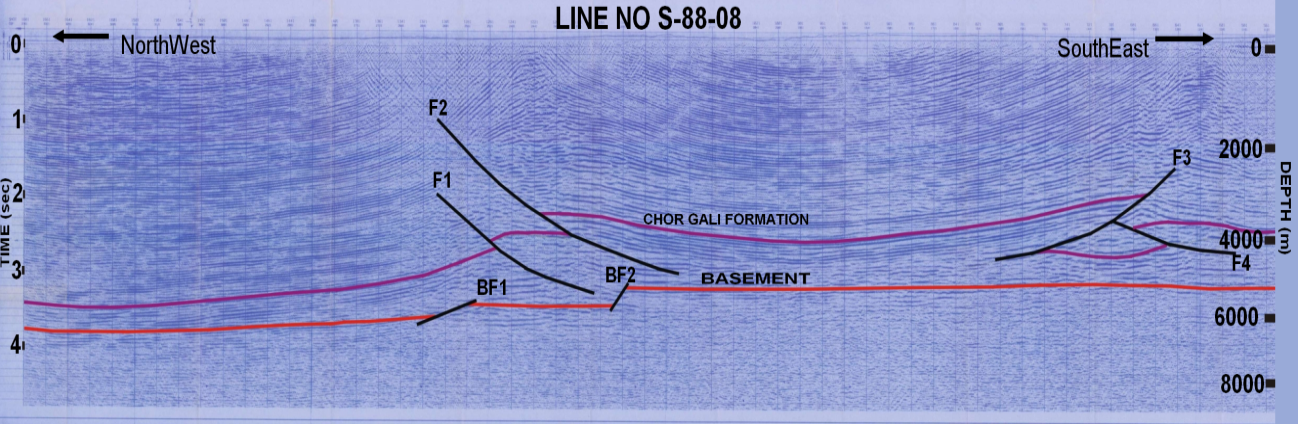 | Figure 10. Graph of Section of line number S-88-08 Time VS Depth |
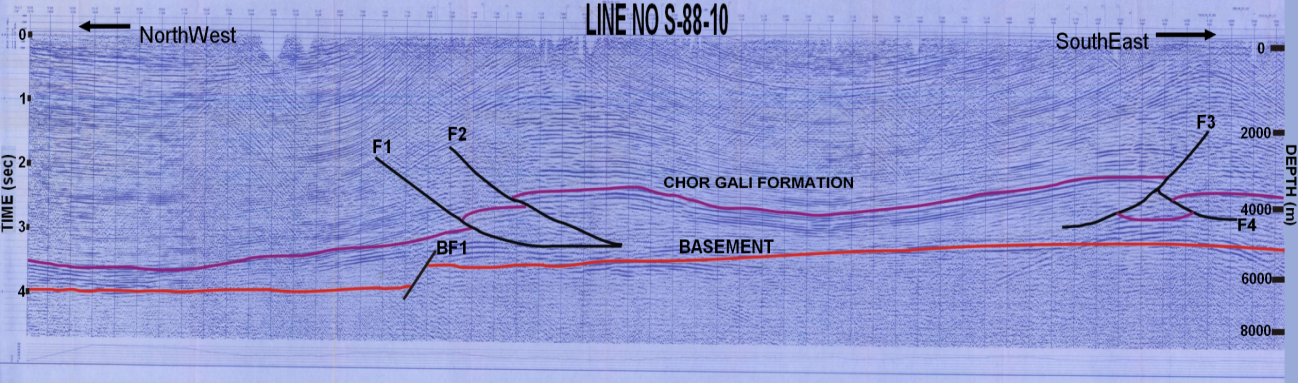 | Figure 11. Time and Depth section of line number S-88-10 |
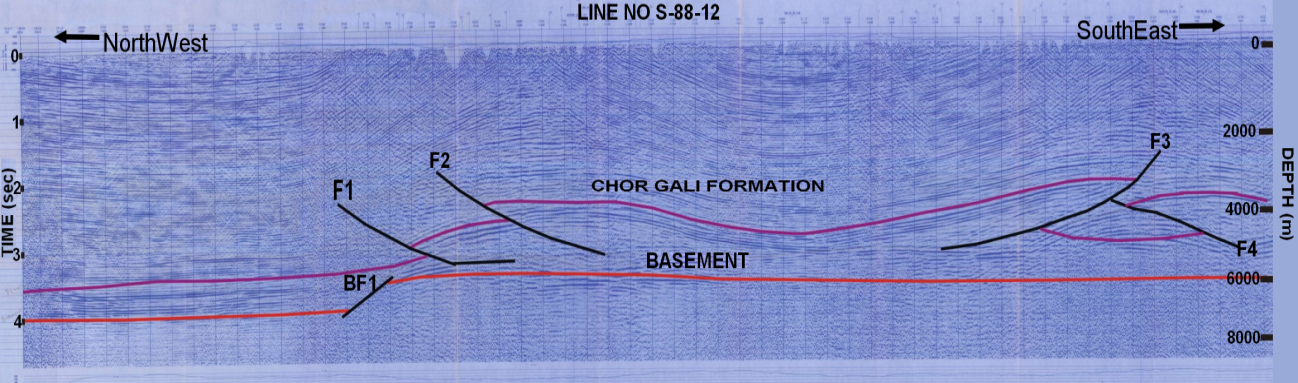 | Figure 12. Graph of Section of line number S-88-12 Time VS Depth |
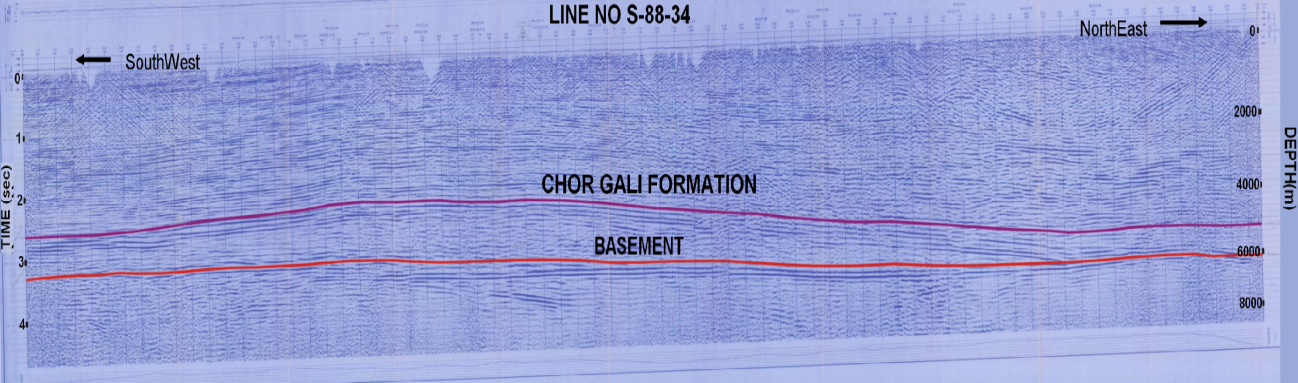 | Figure 13. Graph of Section of line number S-88-34 Time VS Depth |
 | Figure 14. 3D Grid with The Well Formation Tops |
In these seismic sections, two main reflectors are marked. One is the reservoir rock which is Chorgali Formation. The other is basement. Here are two major formations which are the zone of interest i.e. Chargali Formation and Sakesar Formation. Both are the good reservoir rocks. Chorgali and Sakesar come in the same seismic wiggle. So we can mark as single because the thickness of Chorgali is small as compared to the wavelength of the seismic waves. In Chargali formation. There are three major faults. Both sides of the formation has the compressional regime. Due to the reason there are two thrust faults. One is the back thrust which is in northwest direction. Other is fore thrust which is in the southeast direction. Both thrust faults are as good structural traps for the hydrocarbons. In the mod of the seismic section, there is synclinal structure. This is due to the compressional forces. In the basement, there is normal faulting seen. This normal faulting is formed during continental drift.[8]
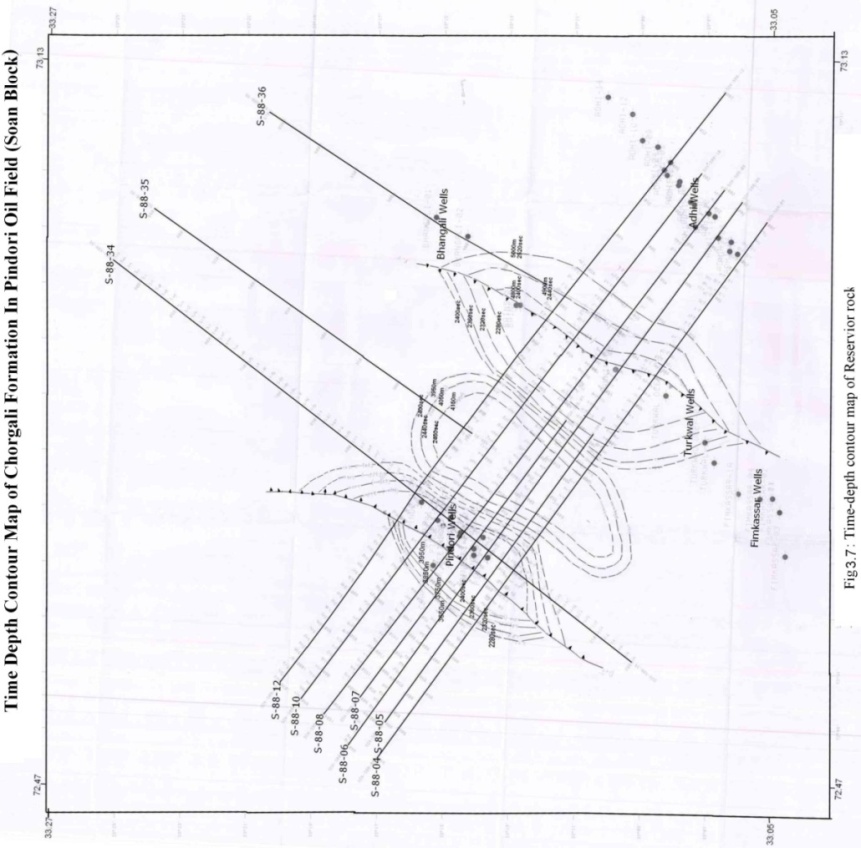
9. Contouring on Basemap
Manually the travel time and velocity is noted on the Basemap for the contouring. Velocity, time and depth contour is made for the Chorgali Formation. The contour shows the faulting some compression. The contouring is below in Figure 14.The time depth contour map shows the depth and time of the faults and formation. This shows that there is good structural style, which is making a trap good and can be good reservoir for the hydrocarbons. The closed spaced contour in the back thrust shows the steeply dipping faults. Back thrust is more steeply dipping then fore thrust.
10. Experimental Results Using Interpretation
10.1. Making a Grid
In the software like Petrel, first step is to make a grid. Grid is in three dimensions X, Y, Z. The z axis should be in the same units as that of the digital well tops. If they are in feet then this should also be in feet. If well data is in meters then the z should be in meters. The conventional way of the coordinates of the grid is in UTM. The X and Y are usually in the northing and easting.
10.2. Two-Way Travel Time (TWT)
The two-way travel time which is marked is now mapped with the software. The mapped form of the two-way travel time is in figure 15-17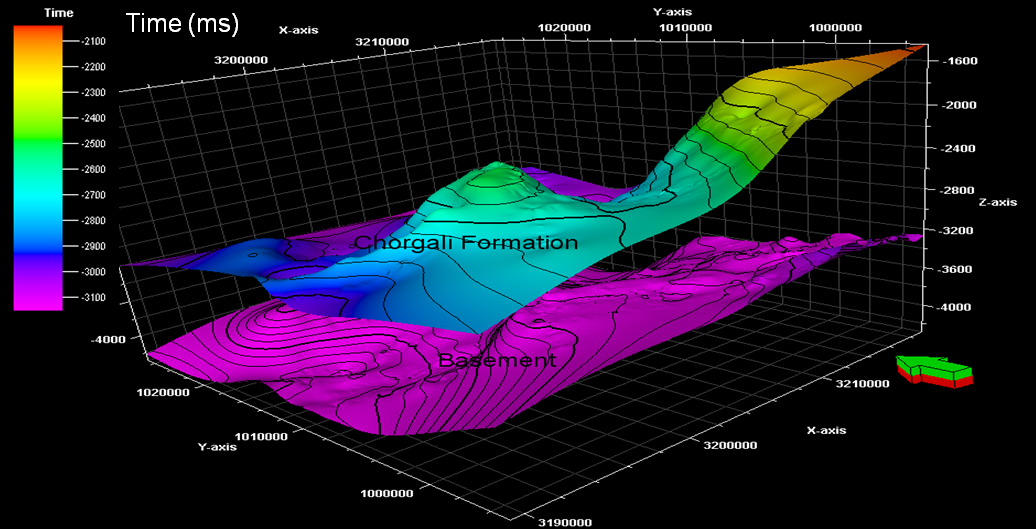 | Figure 15. Time contour map of the both reflectors in 3D view |
In the TWT map, there is small time value where the thrusting is. And in Chorgali Formation, there is more disturbance. 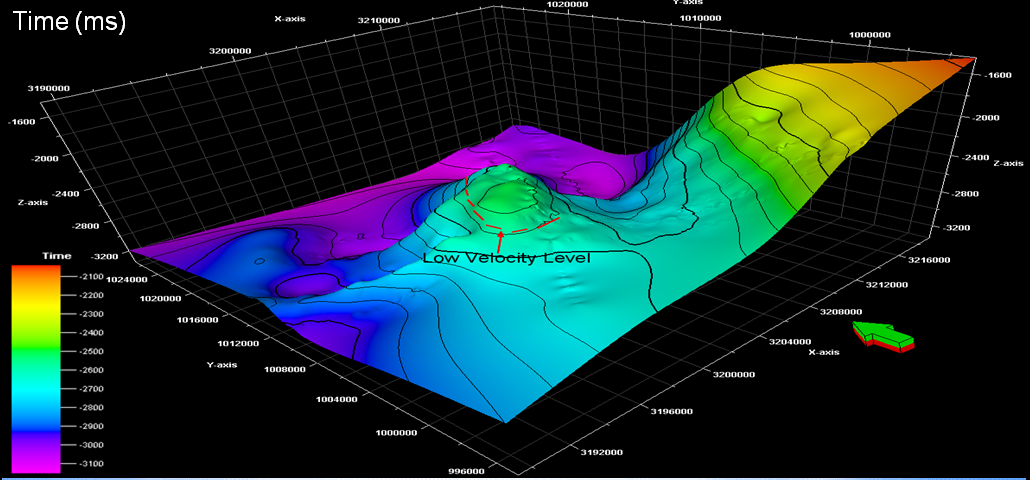 | Figure 16. TWT of Chorgali Formation from one direction |
This is the individual time map of the Chorgali Formation. There are two places where is low value of time. This is due to the thrust structure, uplifting of the formation. Here is also the low velocity. We can see the structural trap yellowish colored. This is formed due to the thrusting in the area.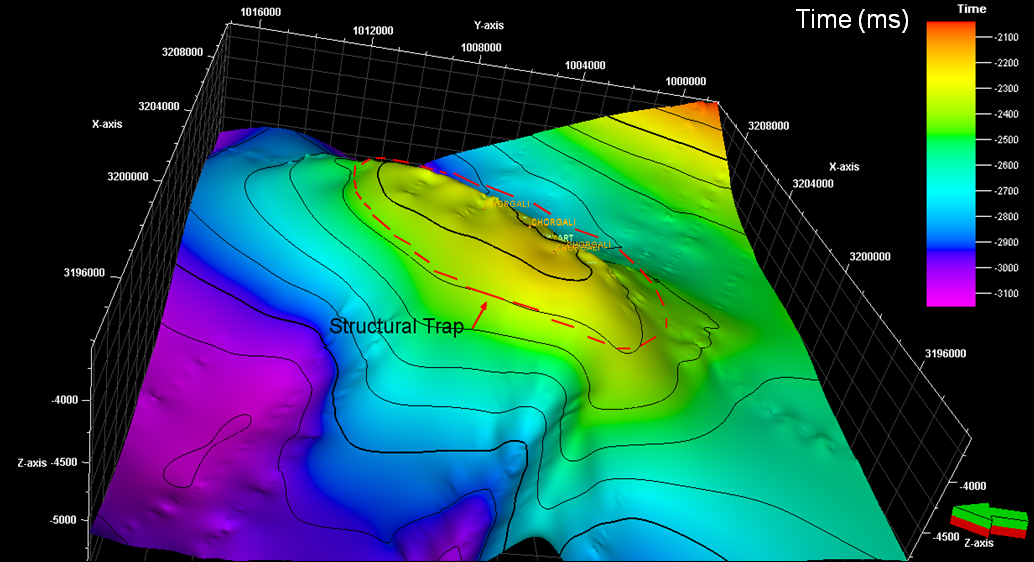 | Figure 17. TWT of the Chorgali Formation |
10.3. True Vertical Depth (TVD)
Then with the help of time and the velocity of the reflector, the depth map is formed in 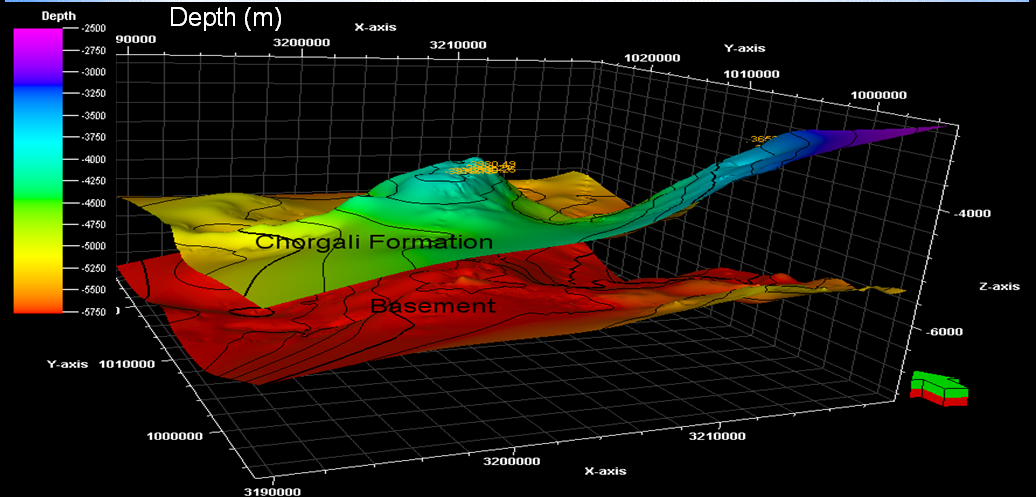 | Figure 18. Depth map for the both reflectors in 3D view |
This is the depth section of both reflectors in the 3D window. The depth section shows that both the thrust faults makes the good structural trap.The depth map of Chorgali Formation shows that there is some light blue colour . That is back thrust and its other side is fore thrust. This depth has the low velocity and this is good trapping structure. There is pulling seemed in the center of this map. This might be due to tectonic forces. This caused the fracturing in the formation which made the formation porous and excellent reservoir for hydrocarbons. There is slight disturbance in the basement due to normal faulting.
10.4. Well Log Interpretation
The continuous reading of a geophysical parameter along a borehole produces a geophysical well log. Many different modern geophysical well logs exist. These may be the measurements of the spontaneous phenomenon (Rider, 2002). The well logs which exists are temperature, caliper, resistivity and conductivity, self potential, gamma ray (GR), sonic or acoustic (DT), density, neutron, dip meter, core and image logs. The image logs are also known to be the Full Bore Micro Image Logs (FMI).
10.5. Correlation of Well Logs
In the present study the present oil field has different wells in which different logs are run. Out of those wells, the two are correlated which are known to be Bhangali-01 and Bhangali-02 as given. In the stratigraphic column, it is seemed that the formations of Bhangali-02 are lifted as compared to the Bhangali-01. This is because of the thrust tectonics and compressional regime. Also the thickness of Lockhart Formation is lesser in Bhangali-02. this is due to the reason the erosion and the fracturing and slumping in the wells. Also the thickness of Patala Formation in Bhangali-02 is greater than in well 01.
10.6. Porosity and Hydrocarbon Content
In the Pindori wells the porosity and the permeability is observed from well to well. It has been observed that the porosity in the Chorgali Formation and Sakesar Formation is greater. This varies from 5% to 35% in the well. The porosity varies from the depth to depth and from well to well. It has also been observed that the porosity is replaced by the volume of shale and the hydrocarbons. The volume of shale here is from 0% to 30% approximately. Hydrocarbon content here is high due to the fracturing. This hydrocarbon content is observed from the resistivity logs. In the well log interpretation of Pindori 04 well, there is high porosity due to high fracturing. The volume of shale observed from the gamma ray log is also high. The hydrocarbon content is from 5% to 35% in the porosity depending upon the porosity of the formation. The porosity of well is indicated by blue color, clay volume is with the green symbol and the hydrocarbon content is from red color.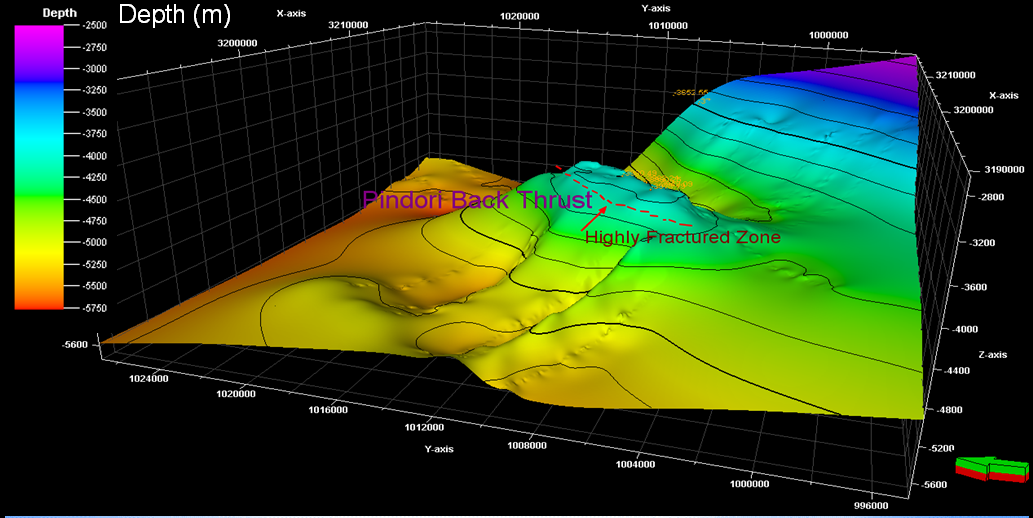 | Figure 19. TVD of the Chorgali Formation mapped in 3D view |
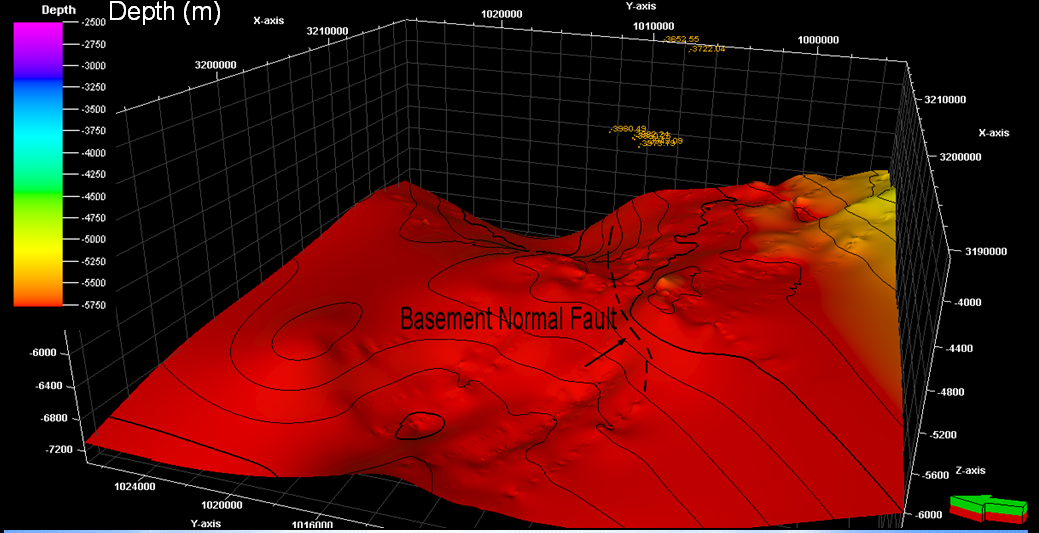 | Figure 20. TVD of the basement mapped in 3D view |
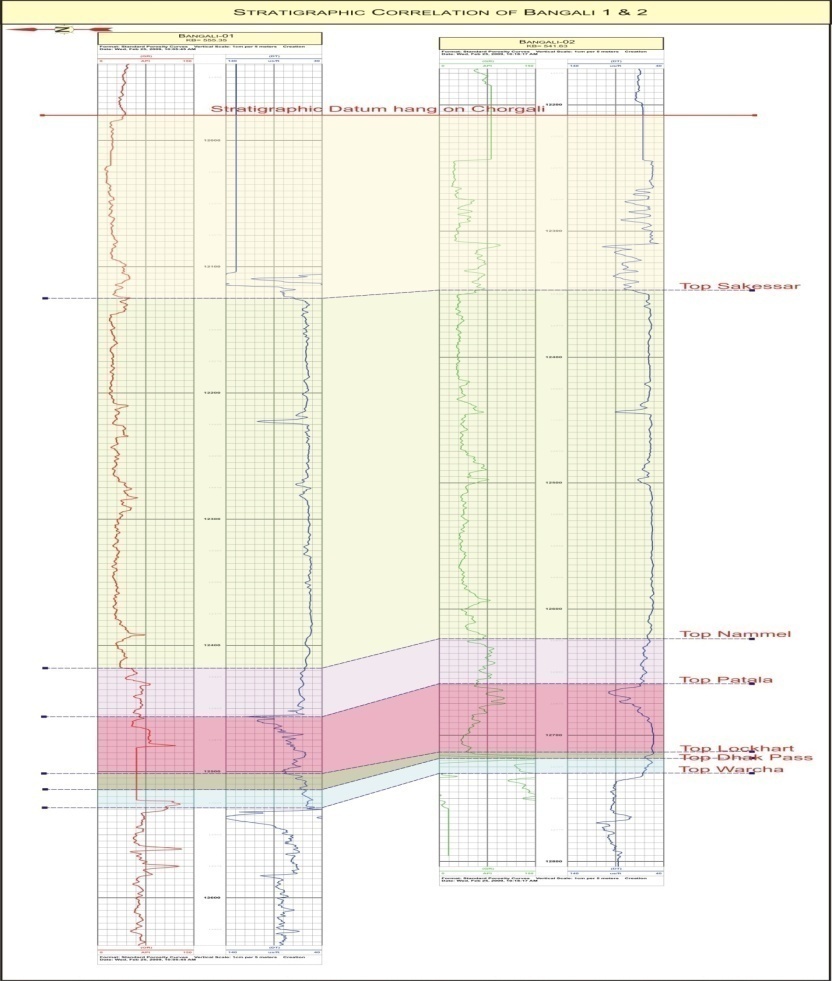 | Figure 21. Correlation of Bhangali-01 and Bhangali-02 wells |
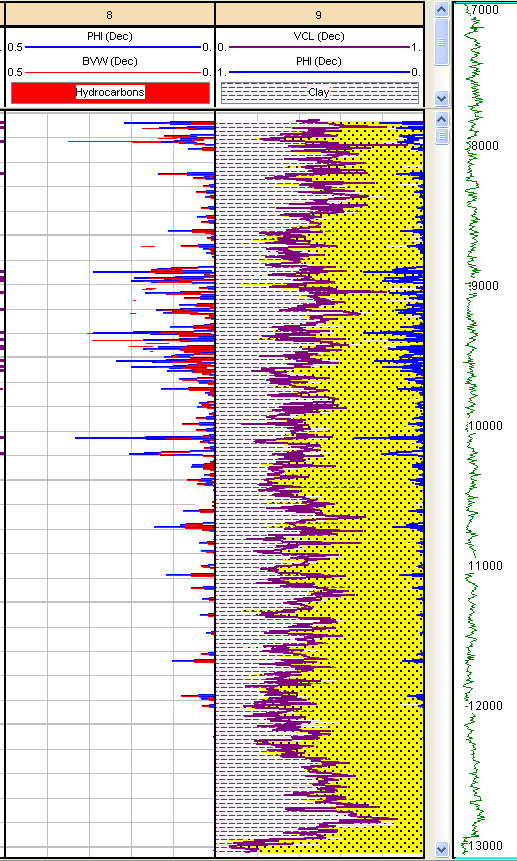 | Figure 22. Interpreted well log indicating the porosity and hydrocarbons in well |
10.7. Cluster Analysis of Logs
Cluster analysis of the logs is the method in which different types of the rocks are indicated and then interpreted. Different types of logs can be used for the cluster analysis. The theory of this cluster analysis is that K-mean facies, then the different logs are used for the cluster formations. The clusters are calculated. At least two logs are required of the same formation and same depth is requirement for this. In the clusters calculation, each colour of cluster shows the individual rock. Here the clusters of Pindori 1 wells are calculated. These are the clusters of the reservoir formation. This shows four different types of rocks. From the calculation of clusters values, it has been observed that the facies 1 is shale, facies 2 is clay/mud stone, facies 3 is limestone and facies 4 is sand stone. This is confirmed from the well reports that these four types of rocks are present in the reservoir rock in this oil field at the same depth.
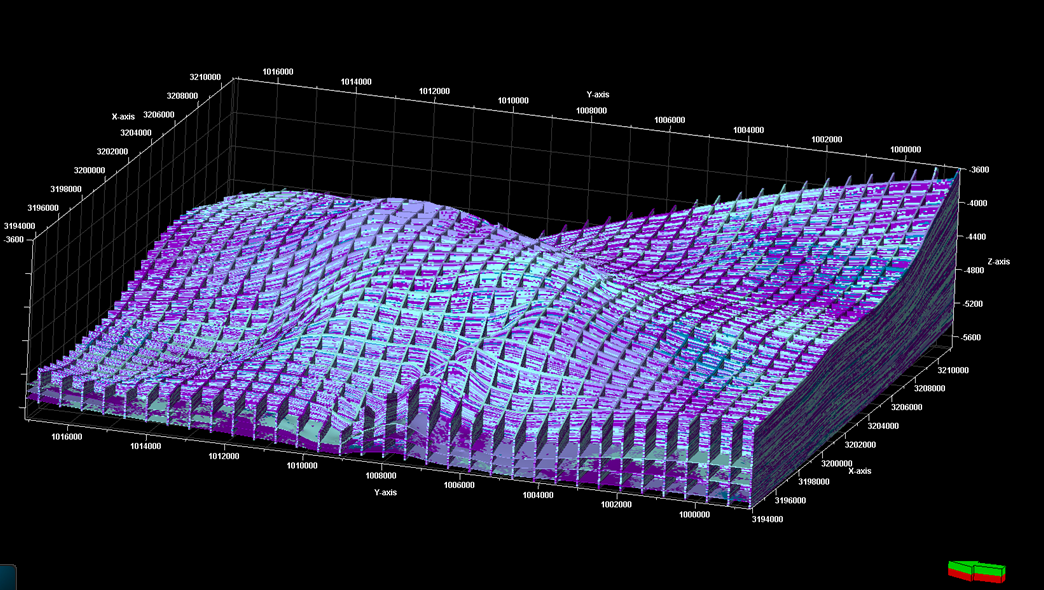
10.8. Facies Model
The calculated facies are then used for the modeling. The modeling is the 3D view of the surface/subsurface structure. In the facies modeling, the calculated facies are used for the 3D view, to see the trend of the area. Following are the facies modeling of the reservoir rock. This model shows the 3D view of the reservoir rock showing different colors. These four colors give the observation and calculation of four different types of rocks stated above. The slice model for this area is as given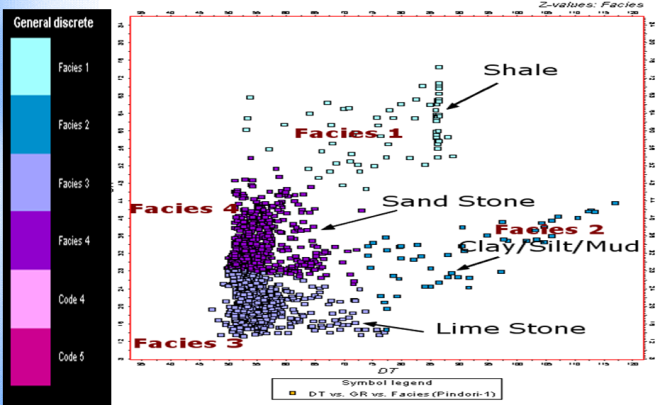 | Figure 23. Clusters of the reservoir rock in study area |
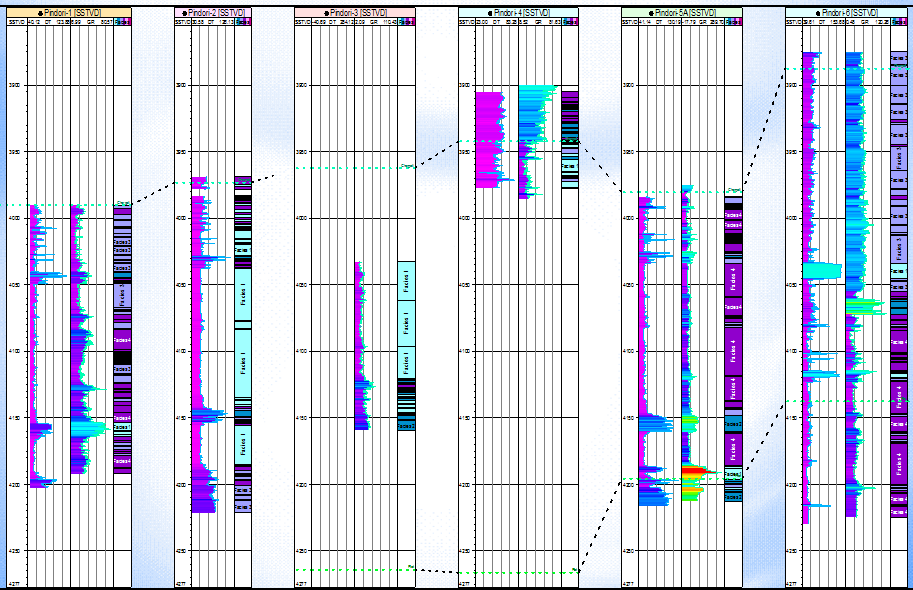 | Figure 24. Facies of reservoir rock of different wells with respect to depth |
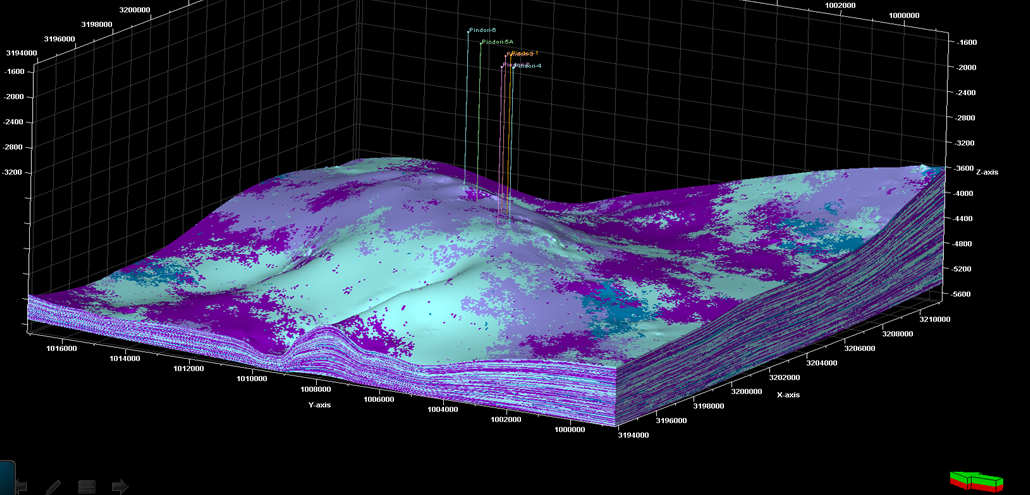
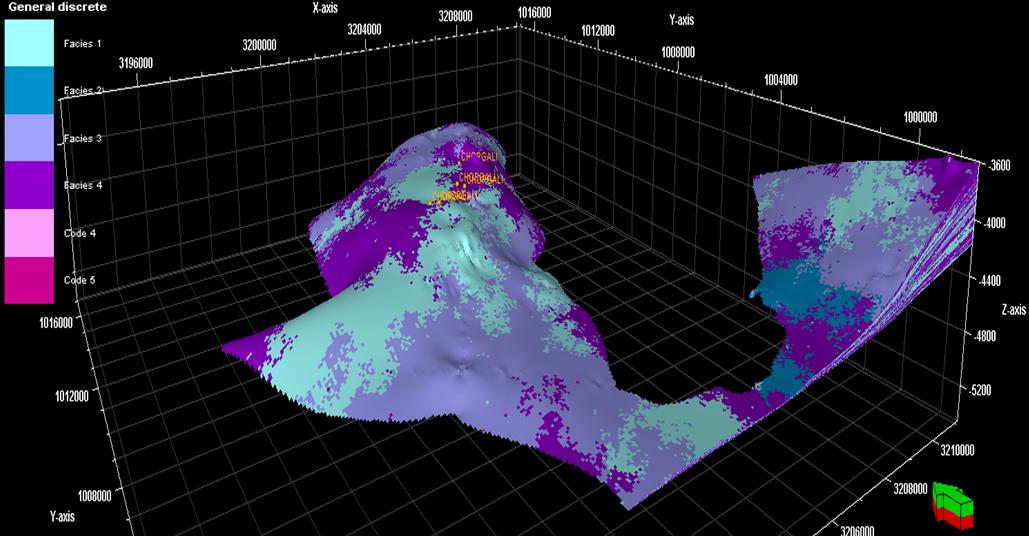 | Figure 25. The facies model of the reservoir rock in the study area |
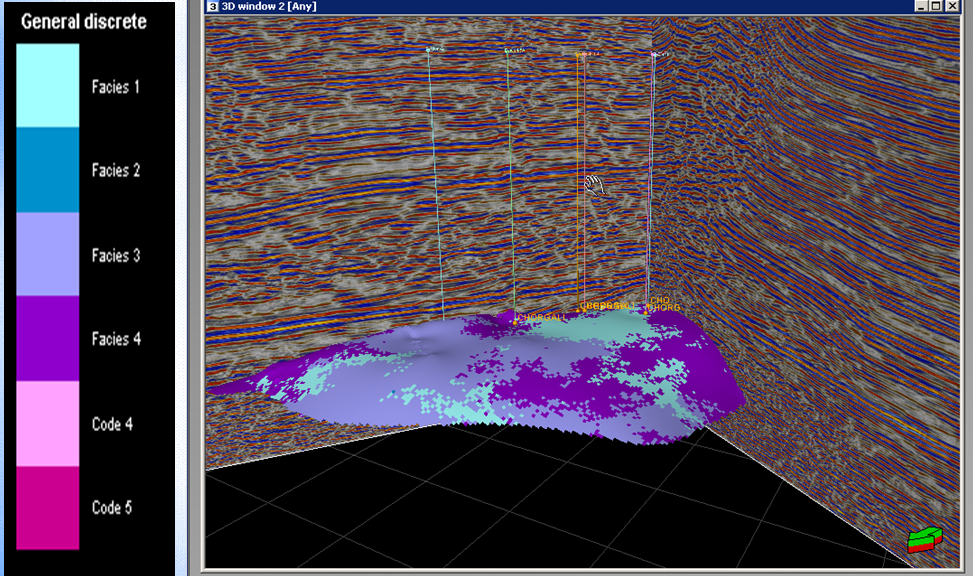 | Figure 26. seismic sections in 3D with the facies model |
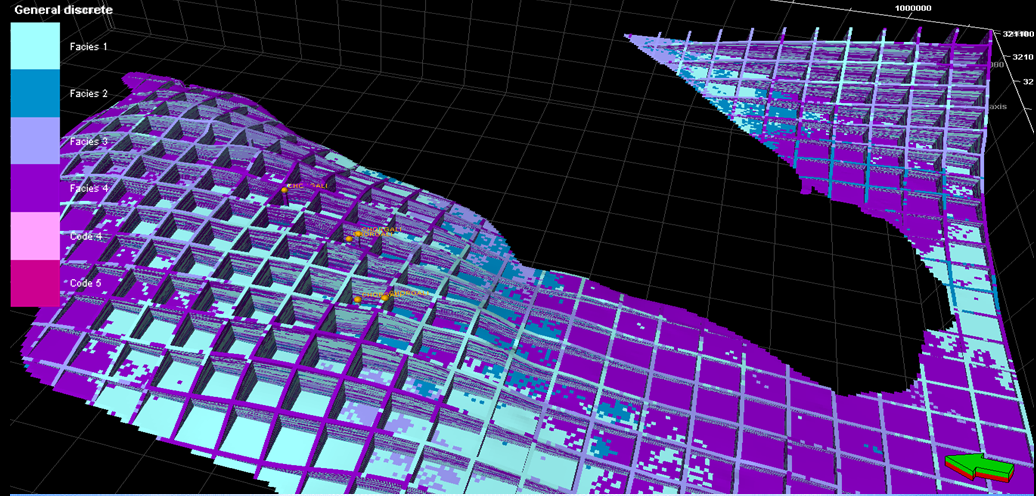 | Figure 27. Block diagram of inner side of facies model of reservoir rock |
 | Figure 28. Fluvial pattern of Chorgali Formation at the time of deposition |
 | Figure 29. Block diagram of fluvial pattern |
11. Conclusions
A 3D facies model of thick stratigraphic succession was built using well log data using the cluster analysis of the well logs from one of the composite sequences. The modeling followed a hierarchical approach. A deterministic method was used to reconstruct the facies bounding fundamental lithology and their constituent systems tracts. Data input was the seismic sections, marked reflectors, velocity model, well logs and the cluster analysis. The modeling trend and interfingering of adjacent facies belts within each systems tract was added by means of a geostatistical algorithm and was conditioned to measured stratigraphic logs and the marked reflectors in the seismic section[1].In the seismic sections, there are faults seen in the reservoir rock (Chorgali formation) Figure 9 to 14 Faults are present in seismic sections, one is fore-thrust and other is back-thrust. Both are the result of compressional regime in this area and this caused the huge structural trap in northwest as well as southeast. In basement some normal faulting is observed. In Figure , it is seemed that there is also normal faulting on the other side of seismic section. The depth of the Chorgali formation in area of pindori wells is almost 3800m. The depth of the basement is from 5000 to 6000m. In the fore-thrust and back-thrust, the structural trap caused huge fracturing. This fracturing increased the porosity and permeability of the reservoir rock and formed the productive formation. The time depth contour map shows that there can be many potential targets for drilling. Time depth manual contour map also shows that the dip of both faults is towards each other. In the seismic section, the highly fractured reservoir formation is interpreted. There is high variation in the velocity of reservoir rock in area of the structural trap, the decrease in velocity is due to the fracturing, porosity and the possible hydrocarbons. The velocity decreases high extent, this is due to high fracturing and porosity and hydrocarbon or water saturation. TWT map shows high variation of time along fault, for reflectors in up thrown area. TVD map shows the uplifting of the both sides of Chorgali Formation. In northwest side there is fore-thrust and in southeast side there is due to fore-thrust. In drilling and well logging, some sort of problem may be observed like slumping and well collapsing.There is thrusting and uplifting in Pindori wells. Thrusting towards Bhangali 01 well is more than 02 well. Porosity of the reservoir rock is from 5 to 35%. There is accumulation of hydrocarbon in this reservoir rock as indicated. There is much fracturing in the formation, high gamma ray value shows the higher fracturing of rock. Cluster analysis gives the four types of facies present in the reservoir rock; from the values of clusters those rocks are lime stone, shale, sand stone and mud stone. The facies of different wells gives the irregular pattern of the facies. This is due to huge fracturing and slumping in the rocks. From values of facies model, the calculations are facies 1 = shale is 27.5%, facies 2 = mud stone is 4.5%, facies 3 = lime stone is 29% and facies 4 = sand stone is 39%. This shows that the rock is good as a reservoir because of the sand and fractured lime stone and shale. The slice model of the facies gives the irregular pattern of the deposition of rocks, this is due to the compressional regime, thrusting, faulting and fracturing. That is why it is difficult to interpret the depositional history of the complex area based on the limited data set.
12. Recommendations and Future Work
3D seismic data is required for the more precise data interpretation. Local seismological data is required for the best results because international data has some error due to the reason the recording instruments are far away from the area. Core logs are required for property modeling as well as more accurate facies modeling. Image logs are required for the fracture modeling. With the help of 3D seismic and core logs, one can do better interpretation, modeling and better petro physical work. With the help of 2D seismic, modeling can be refined by the seismic attributes analysis. For this better software's are required. In the present study integrated geophysical work is carried out with the help of seismic, seismology and well log data. In the seismic interpretation, the reflectors of Chorgali Formation and basement are marked. Faults are observed in the marked reflectors. In the Chorgali Formation, there is thrusting which is seen in the seismic section. Two main thrust faults are marked in the seismic sections one is the fore thrust and other is back thrust. The back thrust is in the northwest side and fore thrust is in the southeast side. There is normal faulting observed in the basement.The thrust faulting is due to the compressional regime. The dip of the thrust fault is from 40° to 45° approximately. This varies from place to place. The thrusting and uplifting is more towards Pindori as compared to the Bhangali side. This is because of the reason that there is also some strike slip component in this area i.e. the fault is oblique slip. In the seismic section, the place of the thrust faults shows fractured and disturbed formations. This is due to the thrust tectonics of this area. Between fore thrust and back thrust, there is synclinal structure. The observations of the seismic data are also confirmed by well log data.The well logs used are gamma ray, sonic and resistivity. The well correlation shows that there is more uplifting towards the Bhangali 02 as compared to the Bhangali 01. This is known to be the shallowing up. This is because of thrust tectonics. The gamma ray logs value shows that there is high fracturing in the reservoir where shale and lime stone is present. The values show high level of porosity. The resistivity log interpretation gives us the result of accumulation of hydrocarbons. The cluster analysis of the reservoir rock (Chorgali and Sakesar Formation) shows that there is more sand stone here in this formation as compared to the lime stone. Facies of the reservoir shows that there are four types of rocks (lime stone. Sand stone, shale and mud stone/silt). The facies model shows the irregular pattern of the reservoir. It shows that there is slumping in the rocks. This is due to the thrusting. The facies model also shows the depositional layers which show the compressional regime. These results are confirmed from the well reports and the results are confirmed. The results of the present work are very close to the actual results obtained by the owner of the oil field.
References
| [1] | P. Cabelloa, O. Falivenea, M. López-Blancoa, J. Howellb, P. Arbuésa, E. Ramosa "Modelling facies belt distribution in fan deltas coupling sequence stratigraphy and geostatistics" The Eocene Sant Llorenç del Munt example (Ebro foreland basin, NE Spain), Marine and Petroleum Geology, Volume 27, Issue 1, January 2010, Pages 254–272. |
| [2] | Jadoon, I.A.K. and Frisch, W., 1997. Hinterland-Vergent tectonic wedge below the Riwat Thrust, Himalayan Foreland, Pakistan; Implications for Hydrocarbon Exploration; AAPG Bulletin, v. 81, no. 3, p. 438-448. |
| [3] | Jadoon, I.A.K., Frisch, W., Jaswal, T.M. and Kemal, A., 1999. Triangle zone in the Himalayan Foreland, north Pakistan; In: A. Macfarelane, |
| [4] | Jaswal, T.M., Lillie, R.J. and Lawrence, R.D., 1997. Structure and evolution of the Northern Potwar deformed zone, Pakistan; AAPG Bulletin, v. 81, no. 2, p. 308-328. |
| [5] | Kazmi, A.H. and Jan, M.Q., 1997. Geology and Tectonics of Pakistan; Graphic Publishers, Karachi, Pakistan, p. 1-545. |
| [6] | Kazmi, A.H. and Rana, R.A., 1982. Tectonic map of Pakistan, bf. Ed., Geol. Sum. Pakistan, Scale 1:2, 000,000, Quetta. |
| [7] | Moghal, M.A., Hameed, A., Saqi, M.I. and Bugti, M.N., 2003. Subsurface geometry of Potwar sub-basin in relation to structuration and entrapment; PAPG Bulletin, p. 85-98. |
| [8] | Mari, Jean-Luc, "Signal Processing (For Geologist & Geophysicist)" , p 1-2, 1999 |
| [9] | Pennock, E.S., Lillie, R.J., Zaman, A.S.H. and Yousaf, M., 1989. Structural interpretation of seismic reflection data from eastern Salt Range and Potwar Plateau, Pakistan. American Association of Petroleum Geologists Bulletin, v. 73, p. 841–857. |
| [10] | Rider, Malcom "The Geological Interpretation of Well Logs, p. v-vii Schlumberger - Log Interpretation Principles and Applications", p. 3-7 and 5-1 (Shami, 1994) |
| [11] | Telford, W.M., Geldart, I.P., Sheriff, R.E. and Keys, D.A., 1976. "Applied Geophysics, Ed. 2nd" , Cambridge University Press, London, p. 123-127. |
| [12] | Jadoon, I.A.K., Khwaja, A.A. and Jamshed, S.Q., 1995. Thrust geometries and evolution of the eastern north Potwar deformed zone, Pakistan, Geol. Bull. Univ. Peshawar, v. 28, p. 79-96. |
| [13] | Kadri, I.B., 1995. Petroleum Geology of Pakistan. PPL, Karachi, Pakistan. p. 27-123. |
| [14] | R.B. Sorkhabi and J. Quade, (eds); Himalayas and Tibet: Mountain Roots to Mountain Traps: Boulder, Colorado, Geological Society of America, p. 328. |
 Abstract
 Reference
 Full-Text PDF
 Full-text HTML