-
Paper Information
- Previous Paper
- Paper Submission
-
Journal Information
- About This Journal
- Editorial Board
- Current Issue
- Archive
- Author Guidelines
- Contact Us
Geosciences
p-ISSN: 2163-1697 e-ISSN: 2163-1719
2012; 2(5): 140-150
doi: 10.5923/j.geo.20120205.06
Source Parameters Estimations of February 23rd and 24th, 2009 Nias Earthquakes Using Local Seismogram Analysis
 Abstract
 Reference
 Full-Text PDF
 Full-Text HTML
Bagus Jaya Santosa
Physics Department, Faculty of Mathematics and Science, ITS, Jl. Arif Rahman Hakim 1, Surabaya 60111, Indonesia
Correspondence to: Bagus Jaya Santosa , Physics Department, Faculty of Mathematics and Science, ITS, Jl. Arif Rahman Hakim 1, Surabaya 60111, Indonesia.
| Email: |  |
Copyright © 2012 Scientific & Academic Publishing. All Rights Reserved.
Two earthquakes in Nias, North Sumatra have been investigated, which occurred on 23rd and 24th February 2009 at 05:56:34.3 and 12:13:15.8 UTC, respectively. This investigation was conducted to estimate the earthquake source parameter. Seismogram data that are used is a record of four surrounding stations, with epicentral distance below 10°. The analysed data are three components waveform. The method used to analyse the earthquake source parameter is a combination between waveform deconvolution iteration method and wave number discretization method for the local data. The resulted depth, seismic moment, slip, dip and rake and also moment tensor of earthquake sources using correlation between the measured seismogram and its synthetic which have a correlation and reduction variance in the values of 77.5% and 60.0%; and also 80.02% and 64.25%. This result showed that the earthquake source parameter estimation is suitable to describe earthquake source characteristic. The faulting pattern of the two events was a double couple inverse faulting.
Keywords: Local Data, Waveform, Moment Tensor, Fault Plane Identification
Article Outline
1. Introduction
- Geographically, Indonesian archipelago lies between 6° N and 11° S and also between 95° and 141° E which located between three earth crust plates which are Eurasian, Pacific and Indian Australian plates. Geologically, Indonesian archipelago existed on the intersection of two main earthquake plates, thus Indonesia has a quite great earthquake activity. In the last decade, earthquake occurs more frequently in Indonesia. There are active faults around Sumatra which frequently causes earthquakes with a very high magnitude. Based on earthquake map 1 (fig. 1), it is known that the history of 1797 earthquake has 8.2 magnitude of Richter Scale, and always followed by another one with smaller magnitude, also for the, 1861, 1935, 2000, 2001 and 2004 earthquakes. The last one was happen to be the earthquake with the greatest magnitude in history (9 RS) which also caused tsunami. After that, the intensity of Sumatra earthquake is still very high, even though the magnitude does not reach the one that happened in 2004. Therefore, a thorough study is needed to understand the characteristic of earthquakes at Sumatra. There are two potential earthquake zones in Sumatra, which are: (1) slab subduction zone located in the West Ocean of Sumatra has a potency of causing earthquake which have a relatively high magnitude with a great chance of tsunami, (2) Sumatra fault zone which is known as Semangko fault. Semangko fault is an active land fault that split Sumatra into two parts, spreading out along Bukit Barisan mountain range, from Semangko bay in Sunda strait until Aceh in north. Semangko fault is the most active fault in the world. The earthquakes that occur in Java and Sumatra are a geodynamic implication of an active deformation around Sunda (Java) trench[1].West Sumatra is the boundary of ocean slab which consist of two faulting systems, which are strike-slip faulting system that rotate clockwise (dextral) and interface dip-slip subduction which has bigger influence[2]. Slope convergence that point toward north direction from Indian and Australian slabs is moving toward South East Asia with the velocity of 60 mm/yr[3,4]. Slab convergence is divided into a slip parallel to the trench which is accommodated by Sumatra fault and perpendicular slip which is accommodated by subduction zone interface[2]. Sumatra fault has caused tens of earthquakes with a magnitude 7 ≤ M ≤8.7, also several minor events, in the last century.Two earthquake events occurred in Nias on 23rd and 24th February 2009, have been recorded by PSI and MY seismological network stations in Malaysia. To obtain the earthquake parameters (time of occurrence, hypocenter location, magnitude, fault plane solution, seismic and moment tensor), usually conducted by analysing the seismogram record early seconds after the P wave arrival time at the station (travel time inversion), but this research analyse three components (X, Y and Z) instead in longer range of time (waveform inversion) using local data. The physical properties acquired, shows an earthquake source characteristic (seismic) and its faulting pattern.Parameter estimation results of an event from several seismological agencies usually have a significant difference, which is caused by different methods used to invert the waveform. Central BMKG on Jakarta used waveform inversion method of only one Z component of the surface wave, Harvard University and USGS used P and S wave for teleseismic data[5]. But most of the methods have a distinct similarity, that it will obtain a high validity if the correlation and reduction variance between measured seismogram and synthetic seismogram has an appropriate value[6].The purpose of this research is to estimate the central moment tensor of earthquake source which occur in Nias, North Sumatra on 23rd and 24th February 2009 at 05:56:34.3 UTC (Universal Time Coordinate) and 12:13:15.8 UTC, respectively. The analysis result is then compared with catalogues of earthquake source parameter from other agencies that conduct the same process, but use different data variant and method.Until now, BMKG has processed earthquake source seismogram data only for travel time and waveform inversion data at Z component, and then announce the hypocenter and earthquake magnitude result (Richter scale) to the society, while seismic wave propagate through 3-dimensional medium. Therefore, the contribution of this research is a parameter characteristic of earthquake source through a seismogram process in three components X, Y and Z using local data, which is similar with Harvard Global CMT and NEIC-USGS (United State Geological Survey) analysis. This result can be used as an input to central BMKG, Jakarta of how to analyse earthquake seismogram to understand the future earthquake process.
2. Data Analysis
- The waveforms analysed in this article were taken from regional broadband stations; which are four stations of the IRIS-DMC network. The first-motion polarities were read from all broadband records, which give close attention to the consistency of the three components in order to avoid erroneous orientation of the sensor, or problematic azimuths[7]. The waveforms were processed using Seismic Analysis Code (SAC) software[8], in which the instrument correction was initially applied on the selected seismograms. The moment tensor inversions were conducted in displacement, meaning that the velocity recordings were integrated once, and acceleration recordings twice, with all recordings filtered using a band pass of 0.015 - 0.09 Hz. Complete three-component waveforms were employed without separating specific wave groups; these waveforms were resampled at all stations into 9567 points, with a time step of 0.04 sec. Waveforms were not shifted to artificially match the first arrival time, because a simple shift of the whole waveform is not the appropriate correction if the misfit comes from an inaccurate location or the local velocity structure at the station. The only case where such a shift might be acceptable is when the station timing is grossly wrong, say, by a few seconds. Such a situation can be detected by checking the location P residuals for all stations used in the moment tensor calculations. No such failure was detected during the course of this research.
3. Methodology
- Band-pass filter is imposed to the recorded velocity seismogram and the least square inversion is to compute the moment tensor of the earthquakes, which is then implemented in a computational program. Seismogram related with basic focal mechanism which have Eigen vector strike, dip and rake components[9].There are steps used to analyse this moment tensor, the first one is to determine which earthquake will be analysed, then selecting the stations around the earthquake source, and picking the crustal model for the region between the earthquake source and the stations, preparing the seismogram data in ASCII format, defining the initial earthquake source trial, calculating the Green function, inverting source parameter using waveform analysis, then plotting the result.The Crustal model that is used, is a combination between Santosa[10] and Haslinger et al.[11] crustal models, where the P wave velocity use Haslinger et al.[11] model and S wave velocity use Santosa[8] research. The parameter of S wave velocity has greater influence than the P wave velocity. This can be seen when small changes were imposed on S wave, the correlation between observed and synthetic seismogram change drastically, while on P wave velocity this does not occur. This crustal model have the most positive influence to the observed and synthetic seismogram fitting which can be seen on fig. 2. Crustal model parameter is needed to calculate the Green function. The inversion result is very sensitive toward crustal model parameter changes[12—14]. So, when the crustal parameter model altered with crustal model that have different characteristic, the fitting result is very poor[15].Based on IRIS (Incorporated Research Institutions for Seismology) initial data (USGS), the Nias earthquakes on 23 and 24 February 2009 respectively at 05:56:34.3 UTC and 18:46:32 UTC show that the earthquakes hypocenter have 0.53° N latitude and 98.57° E longitude with 59.1 km depth and 5.6 magnitude and 1.45° N latitude and 97.21° E longitude with 35 km depth and 5.5 SR magnitude, respectively.Local seismogram data used on this research were downloaded from IRIS webpage. There are four nearest stations from the event used to record 3 components seismic data (EW, NS and Z), which are PSI observation station in Parapat, Sumatra, and also IPM, KUM and KOM all of them located in Malaysia. Position of all four station and earthquake epicentre is shown on fig. 3.Waveform data, event information and epicentre was taken from IRIS webpage event information and the epicentre is needed as an initial value on Green equation calculation[16,17] to predict true earthquake source[18,19]. This research used 10 trial sources, where the one that have greatest correlation is assumed as the predicted earthquake source[20].
4. Result and Discussion
4.1. Result
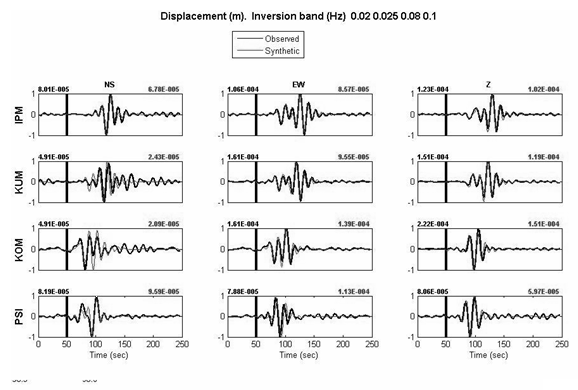
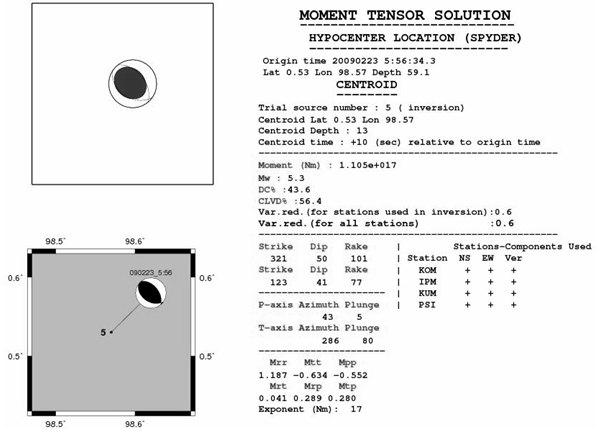
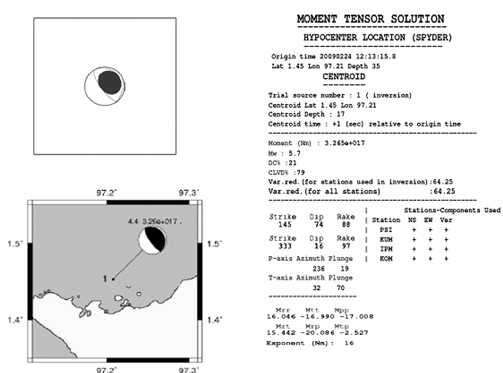
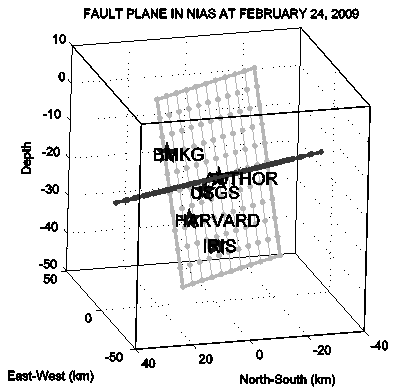
- Observed and synthetic seismogram ComparisonCorrelation between 3 components seismogram waveforms at four observational stations and synthetic seismogram is presented by fig. 4 and fig. 5, where the time series is taper-filtered between 0.02 to 0.06 Hz and 0.02 to 0.1 Hz and have correlation and variance reduction 77.5% and 60.0%, 80.02% and 64.25% respectively for 23 and 24 February events. Those values indicate the resulted fitting in this research is appropriate to all four receiver station. Therefore, the result of this research is appropriate to estimate earthquake source parameter (seismic moment, hypocenter, magnitude, moment tensor, strike, dip, rake and polarity).Comparison and fitting between observed and synthetic seismogram is shown by fig. 4 and 5, where epicentral distances are less than 10° (local/regional). It is clear that excellent fitting of surface wave can be reach. Because of small epicentral distance, the S and P wave is sunk under the surface wave amplitude.Based on fig. 6 and fig. 7, the seismic moment result of Nias earthquake on February 23 and 24, 2009 are 1.105 x 10+17 Nm and 3.265 x 10+17 Nm, respectively. Seismic moment can be used to estimate rupture length of the earthquake. The greater the seismic moment, the greater the fault-plane happen. Figures 8 and 9 show three dimensional illustration of moment tensor/fault plane position and direction of the auxiliary plane, and the position of all four hypocenters; authors, IRIS, Harvard, USGS and BMKG.The moment is represented by Eigen vector; slip, dip and rake which describe the faulting pattern mechanism, such as slip direction and faulting plane of the earthquake source. Analysis result of moment tensor on this research shows that the focal mechanism of these earthquakes is Reverse Faulting. The observed ground movement polarity is used to determine the characteristic of earthquake source point. The moment tensor type of the earthquake source point is a double couple with a compression force pushing toward each other and tension couple force T is pulling away from each other. Moment tensor plane is a plane where the couple of forces that work on the earthquake source. Figures 8 and 9 show three dimensional illustration of moment tensor/fault plane position and direction of the auxiliary plane, and the position of all four hypocenters; authors, IRIS, Harvard, USGS and BMKG.
4.2. Discussion
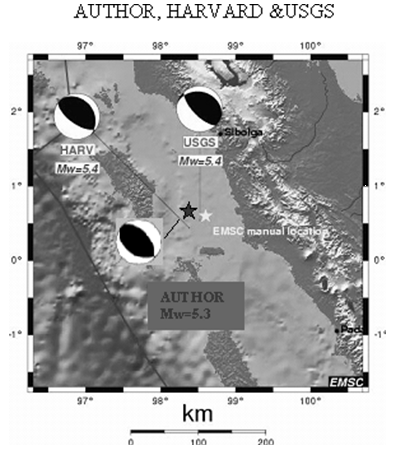
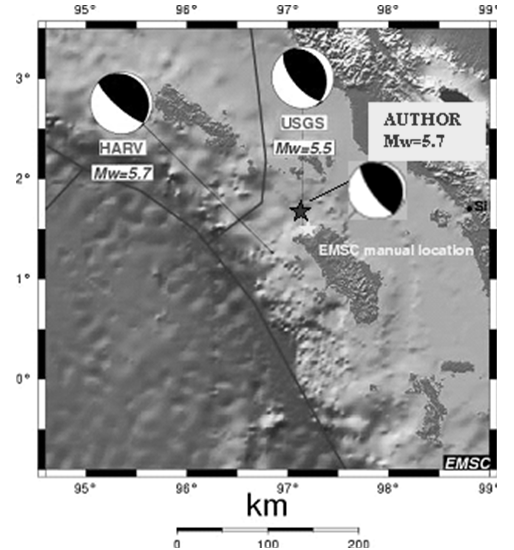
- Upon choosing stations used to record seismic data, few things has been considered, which are (1) stations was chosen based on the distance to earthquake source. (2) Four stations chosen are located around the earthquake source. PSI and IPM stations nearly have the same azimuth with the earthquake source, but these two stations are still inside the 10° range, because it is difficult to get good fitting result if the station distance is over 10°. (3) The stations that are chosen must have seismic wave with good quality. Those conditions must be fulfilled before conducting inversion with four minimum stations. In this research, minimum amount of stations requirement is fulfilled because after being analysed, these four stations fulfilled three requirements above.Crustal model parameter is very sensitive to seismogram output. Therefore, the chosen crustal model must resemble earth mantle at Nias, Sumatra to calculate the Green function. Authors have tracked some researches, but did not find many crustal models. Authors only found the one from Santosa[10] research using corrected PREM earth model. Author has also experimented using several crustal models[11,12,14], but can only found lower correlations and reduction variants. However, the combination between Santosa and Haslinger research gives the best correlation between observed and synthetic seismogram, which is listed in table 1 and 2. These are the comparison for correlation and reduction variant among five crustal models.Basic parameters of Nias earthquake has been recorded and reported by several agencies, like BMKG, USGS, Harvard and Global CMT. The analysis result from the agencies is used on this research as a comparison.The epicentre differences of five methods above (table 3 and 4) are relatively small however the depth difference with IRIS is very high, which are illustrated in fig. 10 and fig. 11. While the depth difference between this studies with the other three agencies is not very significant. The differences above are caused by different inversion method and correlation level and fitting reduction variant. For magnitude (table 5 and 6), there are almost none significant differences between five methods. Authors could not compare correlation level and reduction variant data because the authors have not received the data from the agencies.
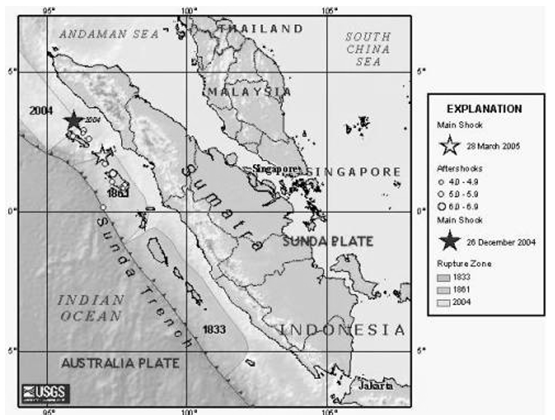 | Figure 1. History and Magnitude of Sumatra earthquakes |
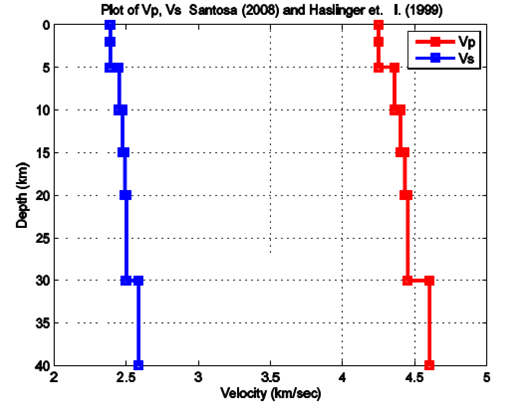 | Figure 2. Crustal model |
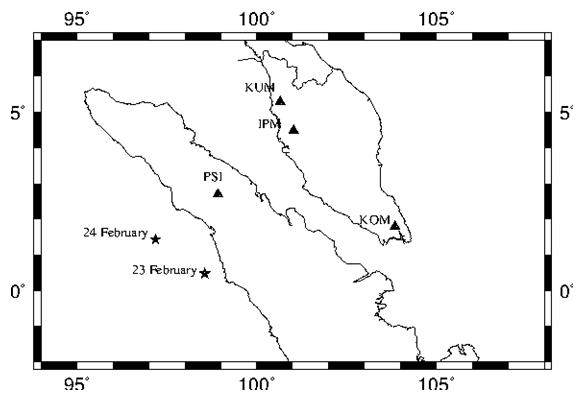 | Figure 3. Stations and earthquakes position |
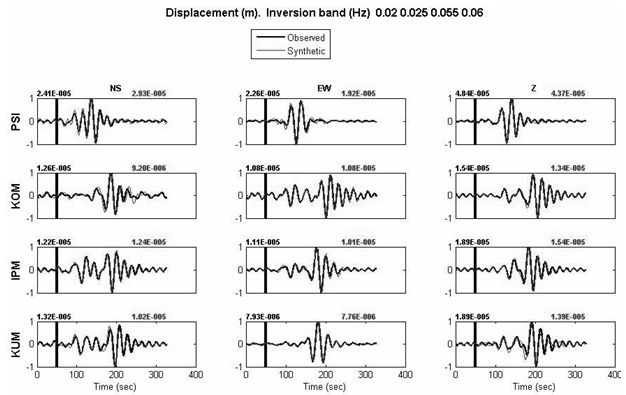 | Figure 4. Observed and synthetic seismogram data 3 components to all four stations for 23 February event |
 | Figure 5. Observed and synthetic seismogram data 3 components to all four stations for 24 February event |
 | Figure 6. Plot Solution of Moment Tensor for 23 February event |
 | Figure 7. Plot Solution of Moment Tensor for 24 February event |
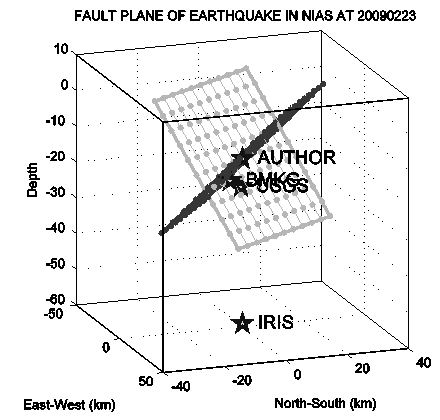 | Figure 8. Fault plane solution for 23 February event |
 | Figure 9. Fault plane solution for 24 February event |
 | Figure 10. Moment tensor comparison between the authors, Harvard, EMSC and USGS, for 23 February event |
 | Figure 11. Moment tensor comparison between the authors, Harvard, EMSC and USGS, for 24 February event |
|
|
|
| ||||||||||||||||||||||||||||||||||||||
| |||||||||||||||||||||||||||||||||||||||||||||
5. Conclusions
- Correlation and reduction variant between observed and synthetic seismogram data for February 23 and 24 February 2009 are 77.5% and 60.0%; and also 80.02% and 64.25%, respectively. These results show that the method used in this research is appropriate to describe earthquake source parameter. The research results information of the earthquake source parameters. Validity of method used in this research has been maintained by waveform comparison with estimation result of earthquake source parameters from Harvard Global CMT, NEIC-USGS, IRIS and BMKG agencies. It is known that the earthquake magnitude of this research does not have significant differences with Harvard Global CMT, NEIC-USGS, IRIS, and BMKG result. Seismic moment, tensor moment, strike, dip and rake estimation of this research does not have significant differences with Harvard Global CMT and NEIC-USGS result. Authors could not access seismic moment, tensor moment, strike, dip and rake data from BMKG and IRIS.
ACKNOWLEDGEMENTS
- Authors thanks to ITS Geophysical Laboratory that has been facilitating this research, and also to Dr. Sokos, E. and Dr. Zahradnìk, J. who guide the authors on using the ISOLA software, so the program can be used to calculate 3 components Green function which is based on waveform and the inversion that suitable for this research. Also thank you to IRIS USGS for providing seismic data which is needed by the authors for this research
References
| [1] | Lasitha, S., Radhakrishna, M., ande Sanu, T.D. (2006). Seismically Active deformation in the Sumatra-Java Trench-arc region: Geodynamic Implications, Current Science, 90, pp. --- |
| [2] | Natawidjaya, D.H. (2002). Neotectonics of the Sumatra Fault and Paleo-geodesy of the Sumatra Subduction Zone, California Institute of Technology Pasadena, California (Thesis). |
| [3] | Newcomb, K.R., and McCann, W.R. (1999). Seismic history and seismotectonics of the Sunda Arc, Journal of Geophysical Research, 92, 421-439. |
| [4] | Prawirodirdjo, L., Y. Bock, R. McCaffrey, Genrich, J., Calais, E., Stevens, C., Puntodewo, S.S.O., Subarya, C., Rais, J., Zwick, Fauzi, P. (1997). Geodetic observations of interseismic strain segmentation at the Sumatra subduction zone, Geophysical Research Letters, 24, 2601-2604. |
| [5] | Kikuchi, M. and Kanamori, H. (1991). Inversion of complex body waves -- III, Bulletin of Seismological Society of America, 81, 2335-2350. |
| [6] | Lee, W. H. K. and Valdés, C.M., (1989). Hypo71PC. Toolbox for seismic data acquisition, processing, and analysis. IASPEI & SSA. |
| [7] | Zahradnìk J., Jansky J., and Plicka V. (2008). Detailed Waveform Inversion for Moment Tensors of M_4 Events: Examples from the Corinth Gulf, Greece, Bull. Seism. Soc. Am., 98, 2756 – 2771 |
| [8] | Goldstein P., Snoke A. (2005). SAC Availability for the IRIS Community, IRIS Consortium, DMS Electronic Newsletter, 7, www.iris.edu/news/newsletter/vol7no1/page1.htm |
| [9] | Benetatos, Ch., Kiratzi, A., Roumelioti, Z., Stavrakakis, G., Drakatos, G. and Latoussakis, I. (2005). The 14 August 2003 Lefkada Island (Greece) earthquake: focal mechanisms of the mainshock and of the aftershock sequence, Journal of Seismology 9, 171 – 190. |
| [10] | Santosa, B.J. (2008). Analyzing the seismogram of earthquakes on Sumatra-Java Subduction plane at CHTO observation station, Jurnal MIPA Unlam, 13, 13 – 21. |
| [11] | Haslinger, F., Kissling, E., Ansorge, J., Hatzfeld, D. , Papadimitriou, E. , Karakostas, V., Makropoulos, K., Kahle, H.G. and Peter, Y. (1999). 3D crustal structure from local earthquake tomography around the Gulf of Arta (Ionian region, NW Greece), Tectonophysics, 304, 201—218. |
| [12] | Novotný, O., Zahradnìk, J. and Tselentis, G.A. (2001). North-western Turkey earthquakes and the crustal structure inferred from surface waves observed in the Corinth Gulf, Greece, Bulletin of Seismological Society of America, 91, 875—879. |
| [13] | Kagawa, Smith, N., and Kowada, A. (1999). Characterizing crustal earthquake slip models for the prediction of strong ground motion, Seismological Research Letters, 70, 59—80. |
| [14] | Tselentis, G.A., Melis, N.S., Sokos, E., and Papatsimpa, K. (1996). The Egion June 15, 1995 (6.2 ML) earthquake, Western Greece, Pure Applied Geophysics, 147, 83—98. |
| [15] | Frankel, A. (2003). Source process of the M7.9 Denali Fault, Alaska, Earthquake: Sub- events, directivity, and scaling of high-frequency ground motion, EOS Transactional AGU, 84. |
| [16] | Bouchon, M. (1989). A simple method to calculate Green's functions for elastic layered media, Bulletin of Seismological Society of. America,71, 959—971. |
| [17] | Coutant, O. (1989). Program of Numerical Simulation AXITRA, Research report, LGIT, Grenoble. |
| [18] | Das, S. and Kostrov, B.V. (1990). Inversion for seismic slip rate history and distribution with stabilizing constraints: application o the 1986 Andreanof Islands earthquake, Journal of Geophyical Research, 95, 6899—6913 |
| [19] | Sokos, E. and Zahradnìk, J. (2005). A Matlab GUI for Use with ISOLA Fortran Code, University of Patras, Seismological Laboratory and Charles University in Prague, Faculty of Mathematics and Physics. |
| [20] | Kuge, K. (2003). Source modeling using strong-motion waveforms: Toward automated determination of earthquake fault planes and moment release, Bulletin of Seismological Society of America, 93, 639—654. |