-
Paper Information
- Next Paper
- Previous Paper
- Paper Submission
-
Journal Information
- About This Journal
- Editorial Board
- Current Issue
- Archive
- Author Guidelines
- Contact Us
Geosciences
p-ISSN: 2163-1697 e-ISSN: 2163-1719
2012; 2(5): 133-139
doi: 10.5923/j.geo.20120205.05
Hydrogeophysical Investigation of Groundwater in Cuddalore Coastal Area, Tamilnadu, India
 Abstract
 Reference
 Full-Text PDF
 Full-Text HTML
Senthilkumar G 1, Ramanathan AL 2, Nainwal HC 1, Chidambarm S 3
1Departmnet of Geology, H.N.B Garhwal University, Srinagar, India
2School of Environmental Sciences, Jawaharlal Nehru University, New Delhi, India
3Dept. of earth sciences, Annamalai University, Chidambarm, India
Correspondence to: Senthilkumar G , Departmnet of Geology, H.N.B Garhwal University, Srinagar, India.
| Email: |  |
Copyright © 2012 Scientific & Academic Publishing. All Rights Reserved.
An electrical resistivity survey was carried out in the premises of Cuddalore coastal area to understand groundwater conditions, such as depth, thickness and location of the aquifer and the type of water. Vertical electrical soundings by Schlumberger array were conducted out at 17 locations up to a depth of 100 m and secondary Self Potential (SP) and resistivity logging data collected from the private agency. The combination of the Vertical Electrical Soundings (VES) data and borehole data provided useful information on subsurface hydrogeological conditions of the area. The resistivity data confirm that the aquifer consists of an alluvial aquifer. These data were used to determine the lithology and the groundwater quality of the aquifer. Interpretation of the VES tests indicates the presence of an alluvial aquifer that mainly consists of sand and clay. The resistivity of the aquifer between 30 to 70 m showed the increasing value, which indicated the existence of fresh groundwater and low resistivity value showed in near coastal area.
Keywords: Resistivity, Groundwater, Aquifer, Electrical Sounding
Article Outline
1. Introduction
- The monitoring of the groundwater level exhibits a decreasing trend of water level. The main reason for this decline in the groundwater table is that wells pumping from groundwater resource have exceeded natural recharge in the recent years. It is important to get an overview of the ground conditions in early stages of planning and design of water related projects. Often the investigations are carried out using conventional geotechnical methods only, which is costly and only provide information in discrete points. The electrical Resistivity technique is one of the geophysical methods that enable the determination of subsurface Resistivity distribution by sending an electrical current into the ground and measuring the potential difference generated by the current flow. Electrical Resistivity methods have been widely used to study groundwater contamination. The decrease in Resistivity caused by salinization of groundwater helps to identify the contaminant zones. The use of resistivity meter makes the groundwater exploration survey to estimate quantity and quality of groundwater. The available groundwater resources can be estimated after preparing lithological logs and utilized usefully to supplement the canal water supplies for municipal and agricultural productions in order to remove the shortage of water. Resistivity profiling delineates the lateral changes in resistivity that can be correlated with steeply dipping interfaces between two geological formations in the subsurface. Resistivity sounding determines the thickness and resistivity of different horizontal or low dipping subsurface layers, including the aquifer zone[8]. However there are some serious limitations in such investigations as they fail to distinguish between formations of similar resistivities such as saline clay and saline sand, which causes low resistivity due to water quality. Geoelectrical Resistivity methods are also used to reveals the subsurface structures and delineate the contaminated zones of groundwater[2, 6 & 10]. Resistivity methods can be used for groundwater investigations where good electrical Resistivity contrast exists between the water-bearing formations and the underlying rocks[15 & 14] showed that formations containing poor quality water were characterized by low resistivity compared with formations containing fresh water. The purpose of this paper is to use the resistivity data and interpreting geoelectrical soundings to study the aquifer conditions, such as depth and nature of the alluvium, boundaries and location of the aquifer and groundwater quality. This study can be used to protect groundwater supplies as a unique source of water for this area.
2. Study Area
- The study area is Cuddalore coastal region, which is located in southern part of Cuddalore District in the east coast of India. It lies in between 79o 29”E to 79o 54”E longitude and 11o 20”N to 11o 45”N latitudes (figure 1). The study is concentrated in the adjoining coastal villages of Parangipettai, Samiyarpettai, Ayyampettai, Rediyarpettai and Chittrapettai of Cuddalore district to a coastal stretch of about 20km. The area occurs within the Survey of India toposheets of 58M/10, 11, 14 and 15. The important large scale extraction sites in this region are Neyveli open cast mine and the boreholes of New Veeranam Scheme (NVS). The mining of Lignite requires heavy pumping at the rate of 9,000 – 10,000m3hr-1 as water table condition has to be brought down below the level of mining[1]. Water from the Veeranam Lake is supplied through transmission line to Chennai city. To augment the supply during summer season, 48 deep bore wells were drilled and operations are done alternatively to pump the groundwater from deep aquifer and the pumped water is connected to the NVS pipelines. An industrial estate SIPCOT (Small Industries Promotion Corporation of Tamilnadu) with groups of industries near the coast, which generate multi facet chemicals and raw materials are distributed along the coastal area.
3. Methodology
- The geo-electrical methods is to pass current into the ground by means of two electrodes and to measure the potential difference between a second pair placed in line between them from the value of the potential difference, the current applied and also the electrode separation. A quantity termed the apparent resistivity (ρa) is obtained. The variation of the apparent resistivity with change in electrode spacing and position gives information about the variation in subsurface layering.[9] a pioneer in hard rock geology in India estimated the groundwater resources of Deccan trap using electrical Resistivity methods. The Electrical resistivity method is mainly using in two 1. Schlumberger Array 2. Wenner array The commonly Schlumberger array used for electrical resistivity survey in field.
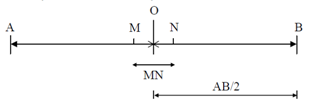
3.1. Schlumberger Array
- This array is most widely used in electrical prospecting four electrodes (A, M, N, and B) are placed along a straight line symmetrically over centre point ‘O’. Current is sent through the outer electrodes AB and potential across MN (the inner electrodes) is measured similar to Wenner array. In Schlumberger configuration, the separation between potential electrodes (MN) is kept small when compared to the current electrode separation AB. The IGIS instrument called SSR MP AT user for electrical sounding in field and IPI2WIN software used for interpretation of geophysical data. Subsurface Self potential and resistivity logging data collected from Rigs India Pvt. Ltd. in Cuddalore. The location map of resistivity sounding and Subsurface SP and resistivity logging is given in the (Fig 2) and their names of the locations are listed in Table 1 and subsurface SP and resistivity log data interpretation is carried out in Rockworks14 for making profile and lithological strata.
4. Results and Interpretations
- Sounding curves were interpreted qualitatively and quantitatively. The qualitative interpretation involved in evaluation of curves for estimation of volume of sand deposit in the studied area. The geophysical survey was conducted and the curves were manually plotted and then checked with IPI2Win software and the RMS error was less than +5%. Most of the values of manual matched curves and that of IPI2Win v.2.0 software[5] were same. Thickness of weathered zone estimation and depth of bedrock studies were carried out by using inverse slope and curve matching techniques in comparison to lithology data and the curve matching was found to give fruitful results[12] Curve matching is adopted here with the objectives to delineate the thickness of the aquifer zones. The data analyzed by curve matching techniques and IPI2Win for 17 locations have been compared. The layer parameters like apparent resistivity (ρa) and thickness (h) of different layers were arrived. Minor deviations due to subsurface discrepancies and the error in the field data is corrected by smoothening the field curve to have easy interpretation. More importance was given for thickness and resistivities of various layers in hydrogeochemical studies. The values obtained by the manual curve matching were used for further studies since, the deviation was lesser. A maximum of 5 layers was identified in few regions, but major part of the study area is dominated mainly by 4 layers (Table 1).
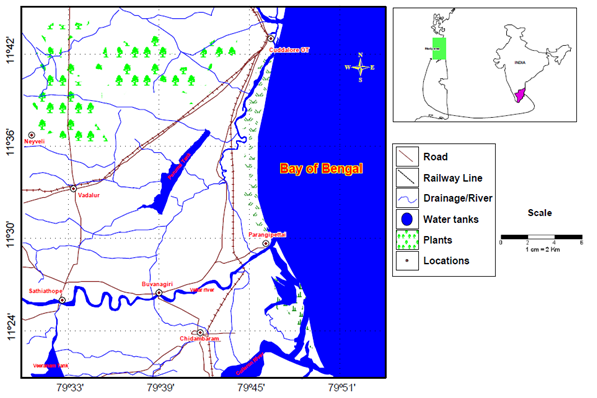 | Figure 1. Location map of the study area |
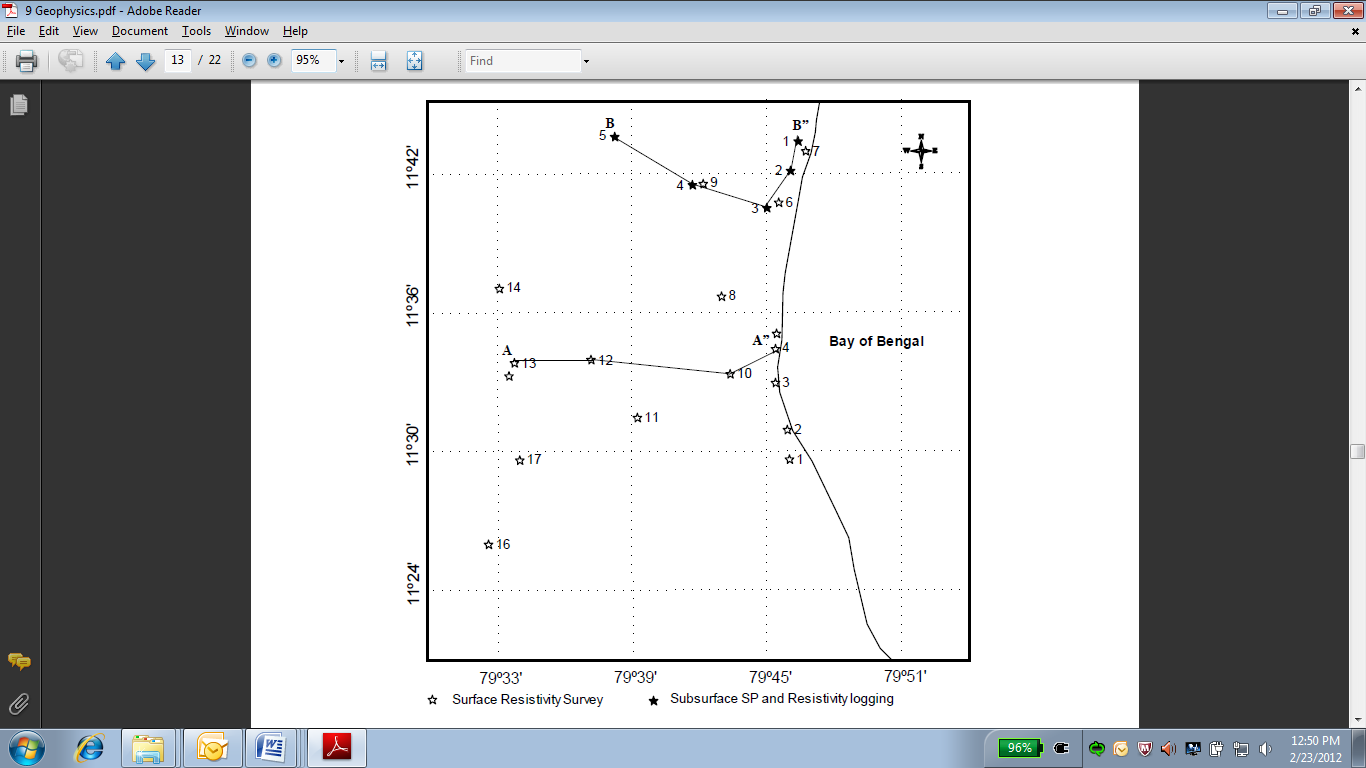 | Figure 2. The location map of resistivity sounding and Subsurface SP and resistivity logging |
4.1. Geoelectric Section
- Interpretation of resistivity sounding data is implicitly a mathematical exercise of approximating the subsurface by a series of horizontal layers, and identifies the parameters (thickness and true resistivity’s) such that the theoretical apparent resistivity’s mimic the observed ones. Interpretation of resistivity data is generally carried out as a two pronged strategy; one is qualitative and the other quantitative. In qualitative interpretation, the nature and characteristics such as gradient, sharpness and width of each sounding curve are studied. Preparation of pseudo resistivity cross-sections can further help in deciphering the resistivity distribution of the subsurface. These pseudo sections are prepared by making contours of the observed apparent resistivity’s by plotting them at each current electrode separation (AB/2) on the y-axis with the corresponding sounding station on the x-axis of a graph paper. In quantitative interpretation, the subsurface is approximated to a series of layers and the true parameters (resistivity and thickness) are estimated by adopting various forms of optimization techniques. The number of layers to be incorporated in modeling and inversion can be identified from the characteristics of the respective sounding curves. The effect of lateral in homogeneities is removed in each sounding curve[3] so as to attribute the observed signal entirely to vertical distribution of resistivity. Although, data interpretation by curve-matching[7 & 4] is in unclear, computer algorithms based on optimization techniques, which has become much popular owing to their efficiency and speed in computation. For qualitative interpretation, pseudo-apparent resistivity cross-sections along A – A” (figure 2) for VES locations of S13, S12, S10 and S3 were prepared by using IPI2win v.2.0 software. The survey was conducted along the coast for delineating the regions contaminated by saline water as well as to demarcate areas affected by anthropogenic activities. The distance between the coast and the sounding locations S13 (Kurinjipadi)), S12 (Pudupettai), S10 (Periyappattu), S3 (Samiyarpettai), were 32,18, 3 and 0.5km respectively (Figure 1). The maximum depth of investigation was up to 70 to 80 m BGL. It can be seen from the cross section (Figure 3), S3 and S10 has one zone with low resistivity values at 10m and 20m depths. A thick low resistivity zone of 2.15 to 5.99 Ω m at a depth of 6m to 18 m, below the fine grained sand layer was noted, which consists of a mixture of clay with fine sand (figure. 3). This low resistive upper zone may be due to the coastal aquifer there is a possibility of salt water intrusion in this aquifer or there is a possibility of combination of these both effects. It is inferred that the sea water has intruded to a considerable area adjoining the coast due to over exploitation of groundwater at deeper aquifers[13] There is a thin layer of clay separating these layers of low resistivity. In S12 a thick high resistivity zone was observed, with a resistivity value of 59.9 Ωm , starting from 30 m to a depth of about 48 m, its indicate that fresh aquifer zone in this location it may recharge form the perumal tank. In S13 a thick low resistivity zone was observed, with a resistivity value of 4.64 Ωm or less, starting from 7m to a depth of about 70 m, which indicates infiltration of the industrial effluents let out from the industrial estate (SIPCOT) located near by the VES location[11].
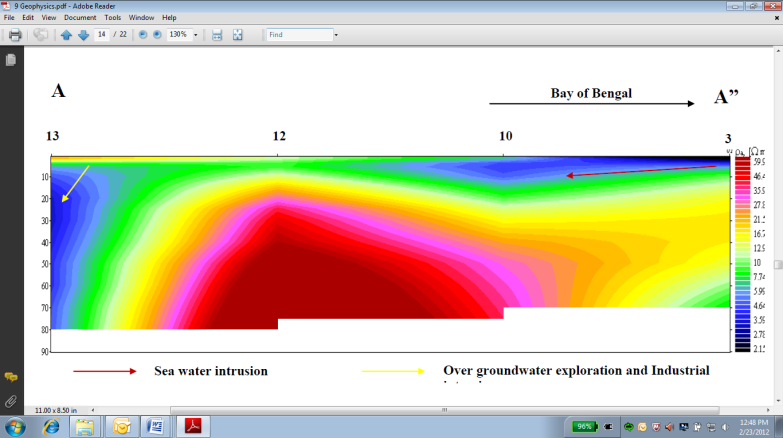 | Figure 3. Pseudo apparent resistivity cross-section along A-A’ |
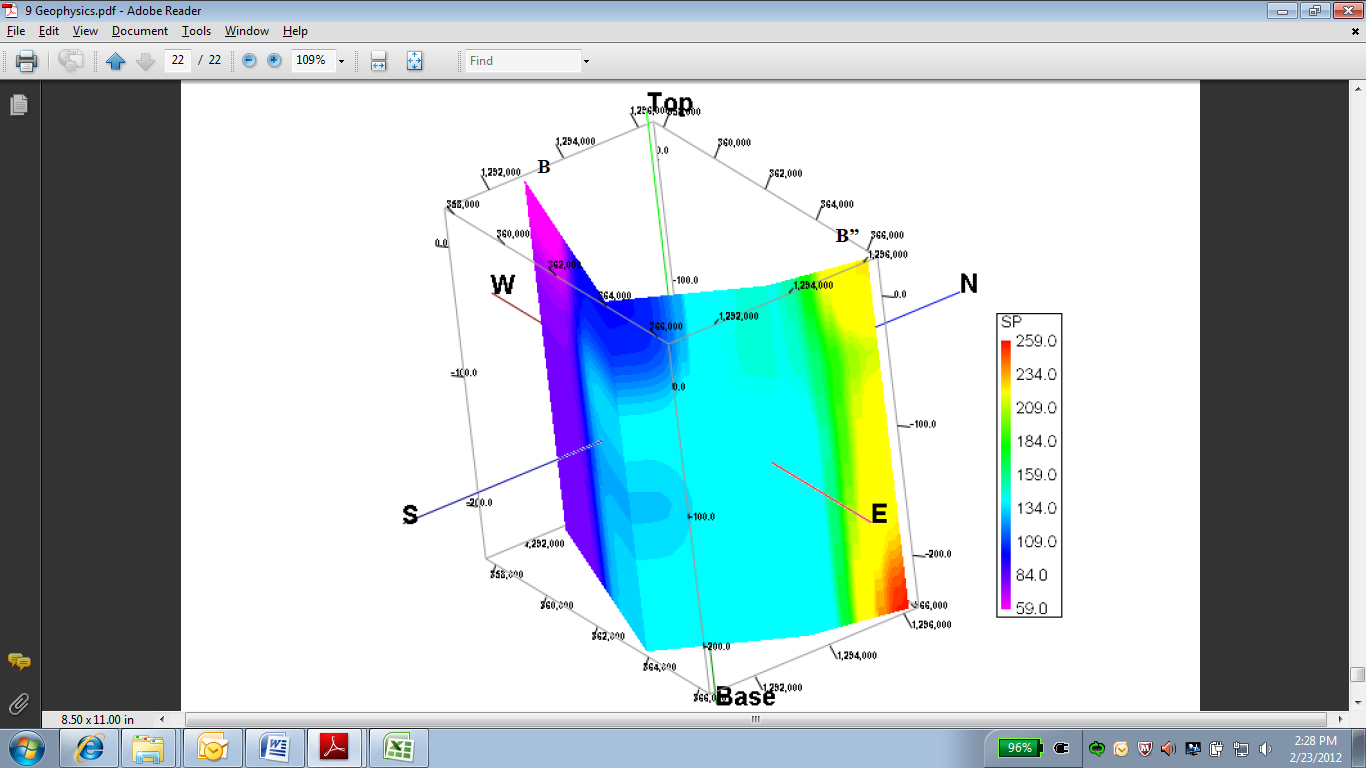 | Figure 4. 3D representation of spontaneous potential log of four locations in the study area |
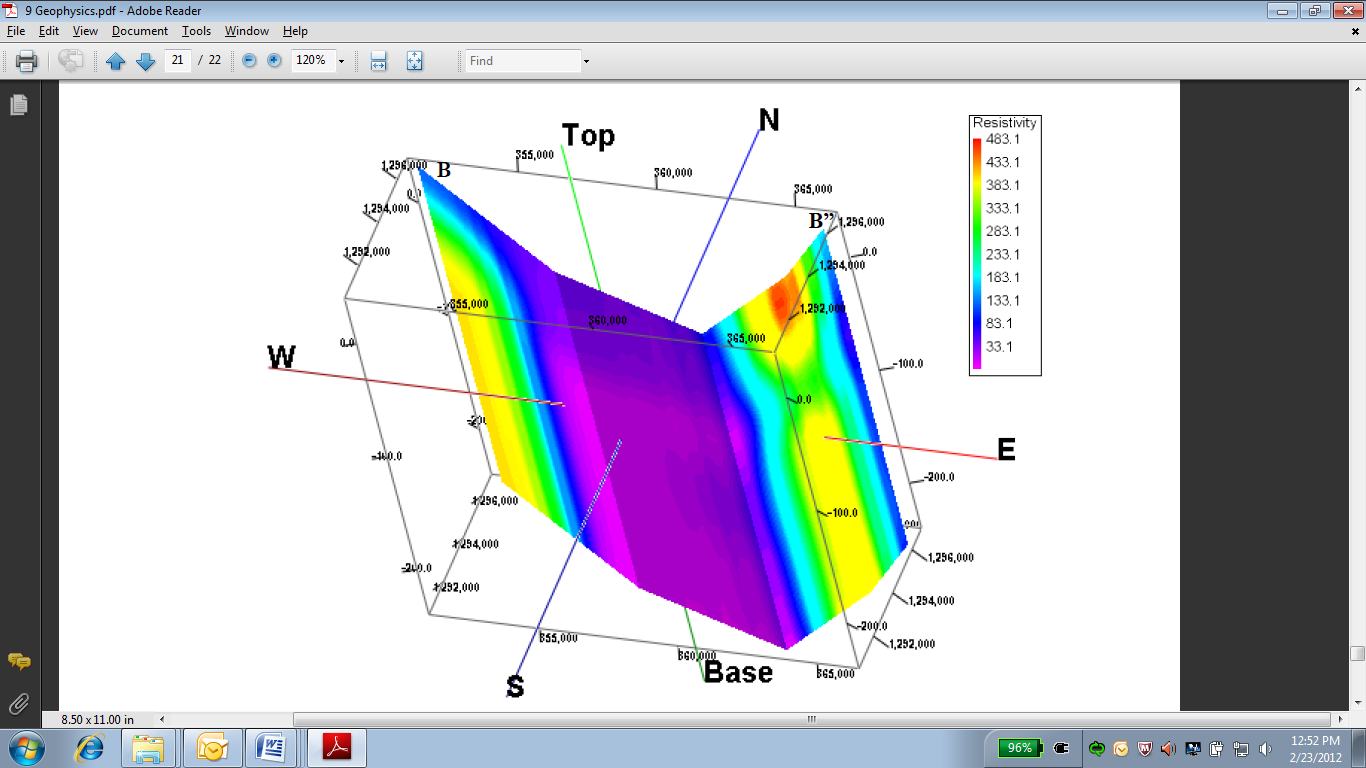 | Figure 5. 3D representation of resistivity log of four locations in the study area |
5. Conclusions
- The resistivity studies indicate that three major zones were delineated as weathered, fractured, top soil, sandy layer and clayey layer in coastal sediment region and interpreted master curves are mostly belong to three- layered curves, namely K type followed by H, A and Q type. The survey delineated the regions contaminated by saline water as well as areas affected by anthropogenic activities. The geophysical cross section reveals that the contaminated water, leached/infiltrate into the aquifer. It’s also evident that at Karaikadu, it is mainly due to infiltrating of effluent water from the nearby industry and mixing of salt water and effluent water intrusion at Cuddalore. It is also inferred that the contaminated water found at the shallow level is not able to percolate below due to the presence of intervening clay formation. The resistivity and SP log indicate shallow aquifers in all four locations, and all are tapped earlier and made to use for agriculture and domestic purposes. The cross section of the SP and the resistivity log values at Ramapuram indicate the fresh water discharge (SGD) into the open sea in the POM (post monsoon season) seasons and the flow direction is mainly from NW to NE (to coast), thus indicating the probability of SGD existence in the coastal regions near Cuddalore. In southern part near Neyveli of the study area having low resistivity value and bitter in taste, it’s mainly due to fertilizers used in agricultural land and over exploration of groundwater from Neyveli Lignite mines
References
| [1] | Anandhan, P. Hydrogeochemical studies in and around Neyveli mining region, Tamilnadu, India. Ph.D Thesis, Department of Earth Sciences, Annamalai University, 189p. 2005. |
| [2] | Arora, C.L. Geoelectrical study of some Indian geothermal areas. Geothermics, v.15(5/6), pp.677-688,1986. |
| [3] | Bhattacharya, P.K. and Patra, H.P. Direct current geoelectric sounding: Principles and interpretation. Elsevier, UK, pp.99-101. 1968. |
| [4] | Compagnie Generale De Geophysique. Master curves foe electrical sounding. European Association for exploration in Geophysics, The Hague, 2nd edn, 49p. 1963. |
| [5] | Geoscan-M Ltd, IPI2Win (v.2.0) User’s manual. Moscow State University, Geological faculty, Department of Geophysics, 15p. 2002. |
| [6] | Ilkisik, O.M., Gurer, A., Tokgoz, T. and Kaya, C. Geoelectromagnetic and geothermic investigations in the Ihlara valley geothermal field. Jour. Volcanol. Geotherm. Res, v.78, pp.297-308,1997 |
| [7] | Kalenov, E.N., Interpretatsia Krivikh Verticalnogo Electrichekogo Zondirovanya, Gostoptekhizdat, Moskva, 470p. 1957. |
| [8] | Kalpan Choudhury and Shah, D.K. Integrated Geophysical and chemical study of saline water intrusion. Ground water, v.42 (5), pp.671-677, 2004. |
| [9] | Limaye, dg. Laboratory tests for water bearing capacity of Deccan trap and associated recent rocks in the Deccan and Konkan areas. J Geol Mining Metallurgical Soc India, v.12 (2), pp. 31 – 50, 1940. |
| [10] | Monterio Santos, P.A., Rade, A.A.R. and Mendes, V.L.A. Study of the Chaves geothermal field using 3D resistivity modeling. Jour. Appl. Geophys, v.37, pp.85- 102. 1997. |
| [11] | Prasanna M.V, Chidambaram S, Shahul Hameed A and Srinivasamoorthy K.. Study of evaluation of groundwater in Gadilam Basin using hydro geochemical and isotope data. Environmental monitoring and assessment, DOI 10.1007/s10661- 009-1092-5, 2009. |
| [12] | Sankaranarayanan, PR. and Ramanujachary, KR. An inverse slope method of determining absolute resistivities. Geophysics, v.32 (6), pp.1036 – 1040, 1967. |
| [13] | Satheesh Herbert Singh. and Lawrence, J.F. Groundwater quality assessment of shallow aquifer using geographical information system in part of Chennai city, Tamilnadu. Journal Geological Society of India, v.69 (5), pp.1067-1076. 2007. |
| [14] | Stewart, M., Layton, M. and Lizanoe, T. Application of resistivity surveys to regional Hydrogeologic reconnaissance. Ground Water, v.21 (1), pp.42-48. 1983. |
| [15] | Verma, RK., Rao, MK. and Rao, CV. Resistivity Investigations for Ground Water Metamorphic Areas near Dhanbad, India. Groundwater, v.18 (1), pp. 46–55, 1980. |