-
Paper Information
- Next Paper
- Previous Paper
- Paper Submission
-
Journal Information
- About This Journal
- Editorial Board
- Current Issue
- Archive
- Author Guidelines
- Contact Us
Geosciences
p-ISSN: 2163-1697 e-ISSN: 2163-1719
2012; 2(4): 81-92
doi: 10.5923/j.geo.20120204.03
Assessment of Hydrogeochemical Characteristic in an Urbanized Estuary using Environmental Techniques
 Abstract
 Reference
 Full-Text PDF
 Full-Text HTML
Robin R.S 1, Pradipta R. Muduli 2, K. Vishnu Vardhan 2, K.R. Abhilash 3, A. Paneer Selvam 4, B. Charan Kumar 5, T. Balasubramanian 1
1Centre of Advanced Study in Marine Biology, Faculty of Marine Sciences, Annamalai University, Parangipettai, India
2Department of Inorganic and Analytical Chemistry, Andhra University, Visakhapatnam, India
3Department of Marine Biology, Microbiology & Biochemistry, Cochin University of Science and Technology, Kochi, India
4Institute for Ocean Management, Anna University, Chennai India
5Marine Biology Laboratory, Andhra University, Visakhapatnam, India
Correspondence to: Robin R.S , Centre of Advanced Study in Marine Biology, Faculty of Marine Sciences, Annamalai University, Parangipettai, India.
| Email: |  |
Copyright © 2012 Scientific & Academic Publishing. All Rights Reserved.
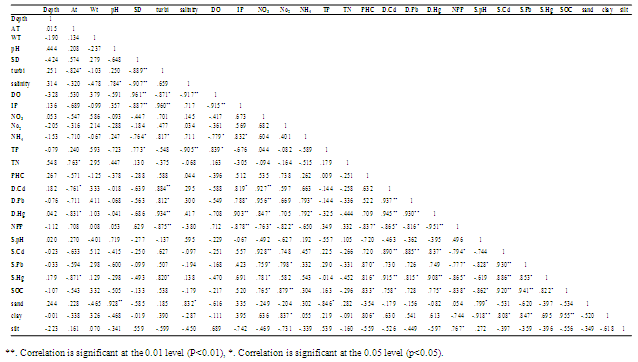
Assessment of spatial variation in hydrogeochemical characteristics was studied in a tropical estuary, Cochin India. Noticeable spatial variations was observed in transparency, turbidity, salinity, PO43--P, NH4+-N, dissolved Cd and Hg. Light limitation due to high turbidity reduced the primary production, even under high nutrient conditions. An enrichment of both dissolved and sediment Cd, Pb and Hg were noticed in the harbour region associated with high organic carbon and silty-clay fraction. The multivariate statistical methods such as factor analysis (FA), cluster analysis (CA), canonical correspondence analysis (CCA) and analysis of variance (ANOVA) were employed to appraise and interpret complex hydrogeochemical data, to categorize pollution sources for better understanding about various biogeochemical processes. CA and CCA showed a meaningful classification of estuarine samples based on spatial criteria. Statistical analysis revealed that Secchi disk depth (SD), water salinity, NO2--N, NO3--N, dissolved oxygen (DO), total phosphorus (TP), total nitrogen (TN), petroleum hydrocarbon (PHC), sediment pH, organic carbon (SOC) and Pb were the most crucial parameters influencing the hydrogeochemistry of the estuary.
Keywords: Cochin Estuary, Multivariate Statistical Analysis, Heavy Metals, Hydrogeochemistry, Factor Analysis, Cluster Analysis
Article Outline
1. Introduction
- The Cochin backwaters, located along the southwest coast of India, constitute a system of interconnected channels and swamps penetrating the mainland encircling many islands within it[1]. Owing to the micro tidal characteristics, the estuary is facing gross pollution problems following the release of untreated effluents from industries (0.104 x 10⁶ m3 d- 1) and domestic sectors (0.26 x 10³ m3 d-1) over the past five decades resulting in deleterious changes in the estuarine ecosystem[2, 3]. The major polluting industries in the region include fertilizer plant, oil refinery, rare earth processing plant, minerals and rutile plant, zinc smelter plant, insecticide factory and organic chemical plant[4]. Further, construction of hydraulic barriers on the northern and southern limbs to prevent saline incursion into the upstream agricultural fields has imposed severe flow restrictions and increased sedimentation in the estuary[3, 5].Even though several works have been carried out in the Cochin estuary mentioning the long term changes of physico-chemical[6, 7] and biological characteristics, no systematic studies have been reported pertaining to the short-term changes of environmental variables using multivariate techniques. The objective of the present study is to analyze the hydrogeochemical status of Cochin estuary due to urbanisation, industrialisation and impact from the harbour activities.
2. Materials and Methods
2.1. Study Area
- The Cochin backwaters (9° 40’ & 10° 12’N and 76° 10’ & 76° 30’E), represent a tropical estuary in Kerala having an area of about 256 km2 (Figure 1). To the North and South, the harbour is continuous with extensive, shallow, brackish water areas, with large scale riverine inputs. The backwater stretches parallel to the coastline and is permanently connected with the Arabian Sea by a gut; about 450 m wide which forms the ship channel at the Cochin harbour region and is continuously dredged and maintained at 10 to 13 m[8]. Constant mixing with seawater through tidal exchanges has given the backwater the characteristics of a tropical estuary[9, 10]. Six rivers discharge 2 x 10¹⁰ m3 of fresh water annually[7], into the Cochin backwaters, of which, the Periyar on the north and the Pamba on the south, are the largest. The bordering areas and islands in the estuary are centres of intense human activity. The movements of ships and mechanized ferry services keep the water in the harbour area churned up to a considerable extent.
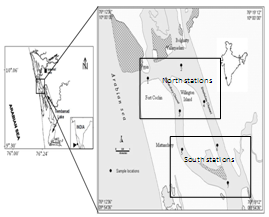 | Figure 1. Location of the sampling sites in the Cochin estuary |
2.2. Sample Collection and Pre-treatment
- Water and sediment samples were collected from 7 stations during February, 2006. Water samples were collected using 5 litre Niskin bottles and sediment samples were collected using a Van Veen Grab (0.05 m2). In situ temperature was recorded using a thermometer (1–51oC range within ± 0.1oC; Brannan, UK). DO was estimated according to Winkler’s method[11]. Salinity was determined using a digi auto salinometer (Model TSK, accuracy ± 0.001) and the pH using an ELICO LI 610 pH meter (accuracy ± 0.01). Soil pH was determined by adopting the method of Jackson (1958). Turbidity was measured by Nephelometer using NTU standards. Samples for nutrients (NH4+-N, NO2--N, NO3--N, PO43--P, TN and TP) were analyzed following the standard methods[11]. For the estimation of PHC content, seawater samples were collected in amber coloured 2.5 litre glass bottles and were analyzed by fluorescence emission measurements, using a Shimadzu RF-5000 spectrofluorometer. Solutions were excited at 310 nm, and the fluorescence emission was measured at 360 nm[12]. Net primary production (NPP) was measured by the 14C method following[13] using NaH14CO3 of 5 μCi ml−1 (Board of Radioisotope Technology, Department of Atomic Energy, India). The disintegration per minute (DPM) was measured by Wallace 1409 DSA, Perkin-Elmer, USA and converted into daily production rates (mg C m−3 d−1) taking into account the initial activity in the bottles and the initial adsorption of 14C by particles in the bottles[14]. For trace metal analysis, water samples were collected in acid washed polythene jerry cans and was filtered through pre-ignited and pre-weighted Millipore filter paper (0.45 μm) and the filtrate was acidified to pH < 2 using concentrated suprapure nitric acids. The dissolved metals were extracted using Ammonium Pyrrollidine Dithocarbamate (APDC) and Methyl Isobutyl Ketone (MIBK) at pH 4.5 and brought back to aqueous layer by back-extraction with concentrated nitric acid and made up to 20 ml with mille-Q water[15]. The extracts were analyzed in the flame AAS (AAanalyst 100 Perkin Elmer) for dissolved trace metals, viz Cd and Pb. Sediments were collected using Van Veen grab carefully by avoiding contamination and kept frozen till analysis. Soil pH was determined by adopting the method of[16]. Textural characteristics (sand, silt, clay) were determined following pipette analysis[17] and sediment organic carbon (SOC); of the composite samples were estimated using chromic acid digestion followed by back titration with ferrous ammonium sulphate[18]. For the heavy metal analysis, finely powdered and dried (70°C) sediments were digested in a mixture of HF-HClO4-HNO3[19]. Complete digestion was ascertained by repeating the acidification until a clear solution was obtained and brought into solution in 0.5 M HCl (25 ml) using Milli Q water. Samples were analyzed on a flame AAS (AAanalyst 100-Perkin Elmer) after calibration with suitable E-Merck elemental standards. For cadmium analysis, a Graphite-AAS (ZL 4110 Perkin Elmer) was used. The precision of the analytical procedure was checked by certified reference material (BCSS-1) in triplicate (National Research Council of Canada). The standard deviations (SD) were typically ± 5% for Cd and Pb. For the estimation of dissolved mercury, water samples (one liter) were acidified on board with 1.0 ml of concentrated HNO3. The pH of water samples after acidification ranged from 1.98 to 2.04 and the Hg concentrations were determined by ECIL mercury analyzer (MA 5800 E) after a pre-concentration step by[20]. Mercury in sediment was determined by cold vapour atomic absorption technique after an acid extraction procedure[21].
2.3. Data Analysis
- Pearson correlation co-efficient (r) and multivariate regression analyses were performed to find the significance among the environmental parameters. Hierarchical cluster and multidimensional scaling (MDS) analyses were carried out using PRIMER to identify the similarity between stations. PASW was used for analysis of variance (ANOVA). Simultaneous representation of stations with influenced variables was performed using CANACO statistical package. Cluster analysis (CA) was executed performed to classify elements of different sources based on their similarities using dendrograms and to identify relatively homogeneous groups of variables with similar properties[22]. Factor analysis (FA) was employed on the variables those are correlated to isolate or determine specific factors that are associated with such groupings of hydrogeochemical concentration to establish their origin. All mathematical and statistical computations were made using Excel 2007 (Microsoft office) and STATISTICA.
3. Results
3.1. Hydrographic Cnditions
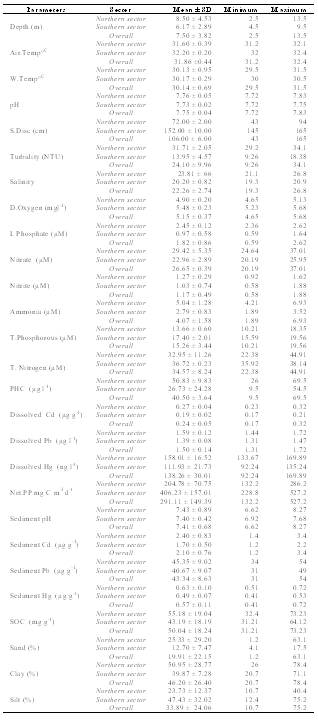
- The average data of hydrogeochemical variables studied are given in Table 1. Cochin had a warm humid climate, with air temperature ~32oC. Water column remained relatively cool at the surface (30.14 ± 0.69°C). Salinity showed distinct variations with maximum of 26.8 at station 1, whereas a pronounced decline was noticed in southern stations (20.20 ± 0.82).
|
3.2. Distribution of Nutrients and Primary Productivity
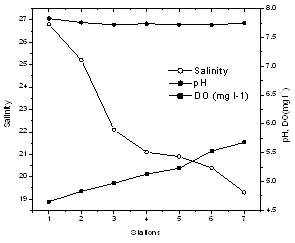
- In general, the Cochin estuary showed the elevated levels of inorganic nutrients (Table 1 and Figure 3). The total dissolved inorganic nitrogen (DIN= NO3- + NO2- + NH4+) was 31.89 ± 6.80 μM among these, nitrate has contributed a maximum of 83.5 % (26.65 ± 0.39 μM) followed by ammonia of 12.77 % (4.07 ± 1.58 μM) and nitrite of 3.66% (1.17 ± 0.49 μM), respectively. Marginal increase in DIN was noticeable at the northern stations as compared to the southern, while nitrite was rather less (< 2 μM) in the study area during sampling period. The inorganic phosphorous (IP) showed minor increase (1.82 ± 0.86 μM) at northern and harbour stations as compared to southern stations. The mean N:P ratios were well above 16 and also seemed to be inconsistent throughout the area. The N:P ratios varied between 13.38 (station 3) to 44.57 (station 6). From N:P ratio, it was evident that nitrogen is the limiting nutrient at the mouth and harbour station, whereas at the southern sector phosphate proved to be the limiting factor. Dissolved inorganic nutrients generally showed an inverse relationship with salinity. Significant positive relationship was found between salinity and pH (P >0.01), whereas nitrate and phosphate showed insignificant and inverse correlation with salinity and pH, respectively. TN concentration varied from 22.73 µM (station 6) to 44.91 µM (station 1). The decrease in TN concentration coincided with decrease in the inorganic nitrogen concentration during the same period. Total phosphorous (TP) showed a minimum value of 10.21 µM (station 7) to a maximum of 19.56 µM (station 4). PHC concentrations (Table 1 & Figure 4) varied between 9.5 and 69.5 µg l-1. Low PHC concentrations were observed in channel entrance (station 1) and southern station (station 7). PHC were relatively higher along western arm of the estuary (Mattancherry channel) compared to Ernakulam channel of Cochin harbour. Primary production exhibited considerable variation in the estuarine waters, with higher values in the southern stations. The total primary production showed one fold increase in the southern estuarine stations (406.23 ± 157.01 mg C m-3 d-1) compared to the northern stations (204.78 ± 70.75 mg C m-3 d-1) during the study period (Table 1 & Figure 5).
 | Figure 2. Variation of salinity, pH and DO in the estuary |
 | Figure 3. Variation of inorganic nutrients in the estuary |
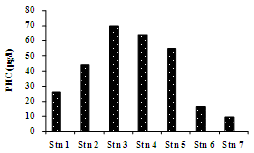 | Figure 4. Variation in PHC along the estuary |
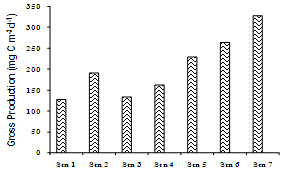 | Figure 5. Net primary production at various sampling locations |
3.3. Distribution of Organic Carbon and Sediment Texture
- The sediments were generally rich in organic carbon and predominantly silty-clay in texture. The textural analysis of the sediment showed higher sand fractions at the bar mouth (63.1%) followed by at station 2 (33%), (Table 1 & Figure 6). The sediments were generally rich in organic carbon and predominant in silty-clay fraction. The study region is mainly dominated by clay (40%). Silt was slightly lower, showing 39% were as its percentage composition reached up to greater than 70% at stations 4 and 6. The concentration of organic carbon was also high and irregular in its distribution with comparatively lower concentrations at stations 1, 6 and 7 (Table 1 & Figure 8). The bar mouth (station 1) and station 7 have recorded low values of organic carbon, with low percentage of clay, silt and high percentage of sand. pH in the sediment ranged between 6.62 and 8.27. The sediment pH was high in barmouth and low in the channels (Table 1 & Figure 8).
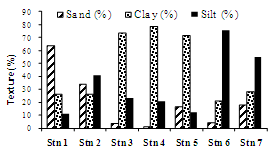 | Figure 6. Percentage composition of sediment texture |
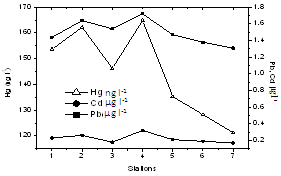 | Figure 7. Variation of dissolved metals along estuary |
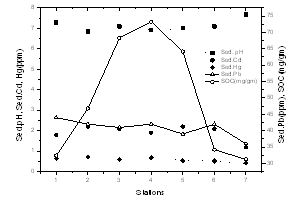 | Figure 8. Variation of metals in sediment along the estuary |
3.4. Distribution of Heavy Metals in the Estuary
- There was a sharp increase in dissolved heavy metal concentrations (Cd, Pb and Hg) in the harbor region (Table 1, Figure 7 & 8). In the present study concentrations of all three elements in the sediment were higher than that of water and it is in the order of Pb> Cd> Hg. Pb concentrations in the sediment was found to be higher (54 µg g-1 dry wt.) among the elements estimated. In water, Pb concentration was 1.5 ± 0.14 µg l-1. There is considerable variation in the concentration of Pb in the estuarine sediments. The maximum concentration (>50 µg g-1) was observed at the proximity to harbour (station 3 and 4); while the lowest value of 31 µg g-1 recorded at station 7. Cd concentration in sediment was found to be 2.1 ± 0.76 µg g-1 (dry wt.) with dissolved Cd concentration of 0.24 ± 0.05 µg l-1. Hg recorded mean value of 0.57 ± 0.11 µg g-1 dry wt. in sediment, whereas the same in water was 138.26 ± 30.01 ng l-1. The highest concentration of dissolved Hg (164.89 ng l-1) and sediment Hg (0.72 µg g-1 dry wt.) were recorded at station 4 and 2, respectively.
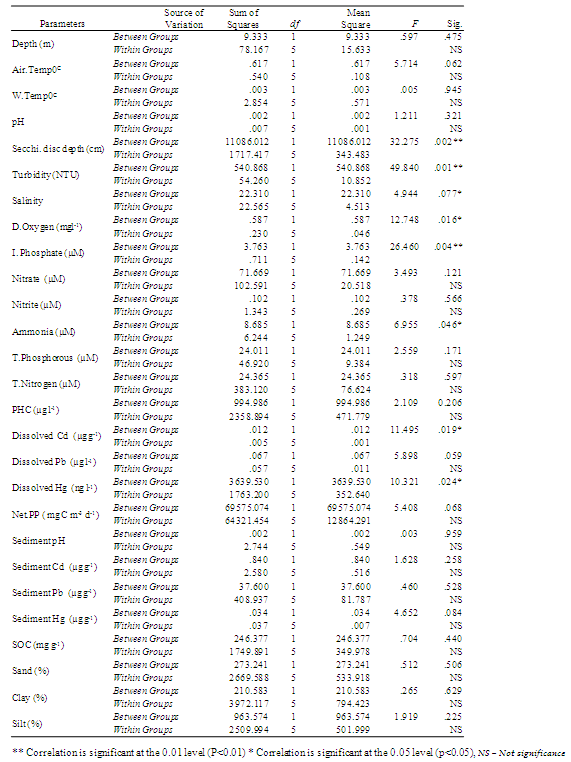
3.5. Correlation Analysis
- Variables such as pH, DO, SD salinity, NO2--N, NO3--N, IP, NPP, Cd, Pb, Hg, sediment organic carbon (SOC) showed a significant correlation among themselves and with other variables. The correlations among hydro geochemical parameters were studied and the results are presented in Table 2.
3.6. Cluster analysis (CA), Canonical Component Analysis (CCA) and Analysis of Variance (ANOVA)
- Group average clustering from euclidean distances (CA) and canonical correspondence analysis (CCA) biplot revealed a grouping of stations (sector ways) which was confirmed by dendrogram plot for the same location. Dendrogram plot based on the hydrographical condition provided a fairly convincing grouping of stations. Station 1 and 2 falls quite dissimilar corresponding to northern sector which represents estuarine mouth. Stations 3 and 4 formed another group, comprising of the harbour (ship channels). Stations 5 and 6 represented southern sector, station 7 falls separately with respect hydrogeochemical condition (Figure 9 and 10). Comparison of the results obtained by the above two methods indicates that several stations may be clustered to different groups; for example the northern stations (1 and 2), as obtained from the tree diagram (Figure 9) are highly influenced by variations in seawater characteristics. The stations which receive maximum urban sewage and port activities (e.g. 3 and 4) were grouped together in the CA and CCA analysis and they also form a part of a larger group. These groups of stations influenced by the most relevant point sources. Subsequently, the southern stations which are away from the proximity of port activities and highly influenced by freshwater influx (station 5, 6 and 7) is also grouped together in both cluster and biplot analyses. The station 3 and 4 represented by intense port activities which is most polluted among all stations evident from elevated dissolved and sediment metal concentrations associated with high organic load. Biplot of sites and elemental concentrations identifies three clusters as mouth, harbour and south sector reveal that station 3 and 4 stations are highly prone to anthropogenic activities as compared to other stations (Figure 10).
|
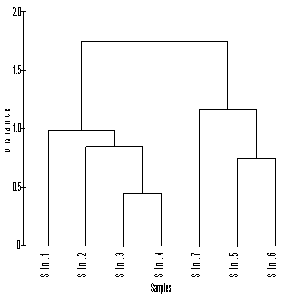 | Figure 9. Dendrogram showing euclidean distance based similarity of stations |
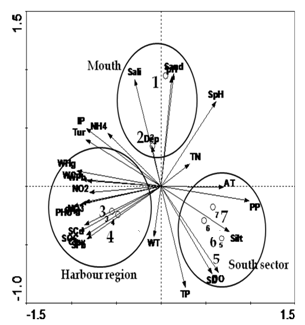 | Figure 10. Canonical correspondence analysis biplot showing samples and environmental variables |
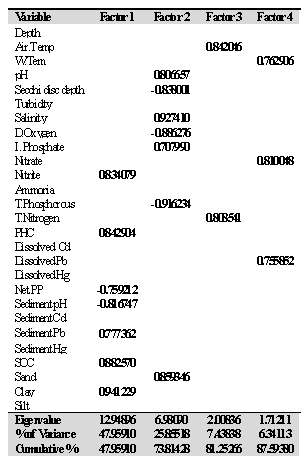
3.7. Factor Analysis (FA)
- Factor analysis was applied to Cochin estuary data and the results present the eigen values and percentage of variance with factor loadings (varimax normalized), maximum likelihood factors and marked loadings >0.70 (Table 4). The correlation matrix of variables was generated and factors extracted by the centroid method, rotated by varimax rotation. The factor analysis generated four significant factors which explained 87.59% of and sediment pH. Factor 2 explains 19.0% of the total variance and pH, Salinity, PO4 and sand (positive loading), Secchi disc reading, DO and TP (negative participation). Factor 3 and 4 recorded a total variance of 7.44% and 6.34% with positive loading of air temperature and TN in factor 3 and water temperature, nitrate and dissolved Pb in factor 4, respectively.
|
4. Discussion
- The Cochin estuary is extremely complex, partly due to the strong influence of different sources of pollution (industrial, urban and harbour) and the tidal inflow and outflow. The results presented above suggest that the spatial variability of the system is the result of changes in temperature, salinity and the non cyclic evolution of the loads of dissolved nutrients and trace metals which are discharged into the estuary by the rivers and other point sources. The salinity in southern estuary was less than that in the northern estuary due to fresh water influx from Cochin backwater.
|
4.1. Influence of Sediment Organic Matter on Trace Metals in the Estuary
- Irregular load of organic carbon was observed with high values at stations 2, 3, 4 & 5. The bar mouth region recorded low organic carbon, with low percentage of clay, silt and high percentage of sand. The distribution of SOC closely followed the distribution of sediment type i.e. low clay sediment contains low SOC and vice versa[34]. The organic carbon in coastal sediments is derived from primary production within the aquatic ecosystem (autochthonous sources) and also from terrestrial biota (allochthonous sources) by the transportation of leached and eroded material[36]. In addition to this an increase in organic matter content in the sediments may be due to the fine nature of sediments (clayey and silt sediments) and high rate of sedimentation[37], and decomposition of domestic sewage which is coming from domestic settlements. Apart from this, the montmorrilonites in the coastal environment are responsible for greater accumulation of organic matter due to their larger surface area.The distribution of dissolved metals with Pb > Cd > Hg in all the seven sampling stations exhibited a unique spatial pattern with highest values at harbour stations. This variation may be attributed by petrochemical industries and number of factors like distribution, mobility, biological availability of chemical elements, pH, redox potential and availability of reactive species such as complex forming ligands (organic and inorganic), particle surface for adsorption and colloidal matter to be a probable factor behind the high value encountered along the harbour stations. In the present study, significant negative correlations between aquatic pH and dissolved heavy metals confirm the role of pH as one of the major factor influencing chemical speciation of the heavy metals in the estuarine conditions. The dilution factor results in the decrease of salinity and pH will facilitate the dissolution of the precipitated form of metals and increase the amount of metallic ions in solutions[38]. Dissolved Cd and Pb in the estuary indicated that salinity and pH plays a major role in the depletion of the dissolved metals during estuarine mixing. As salinity increases, the concentrations of dissolved Pb and Cd decreased. The decrease in the concentration of heavy metals with salinity shows that the contribution from fresh water sources is insignificant which indicates that point sources and physical mixing of anthropogenic inputs by industrial, harbour activity, sewage is controlling the metal concentrations. The average concentrations of trace metals in surficial sediments of Cochin estuary (Table 1) followed the order Pb > Cd > Hg in all the seven sampling stations and exhibited a unique spatial pattern with highest values at harbour stations. Such spatial variations observed in the present study could be due to the difference in the source of heavy metals, determined by a complex equilibrium governed by various physical, chemical and biological factors[39]. Lu and Chen[40] have shown that trace metals are relatively static under reducing conditions because of increased organic load leading to an accumulation in the sediment. Thus the industrial complex consisting of fertilizer, refinery, smelters, etc. discharging their effluents through run off via Thannermukkam bund to the harbour might be responsible for the accumulation of heavy metals in sediments. Further, the reduced flushing in Cochin harbor Balachandran et al.,[41] may increase the organically rich domestic sewage, leading to settlement of particles to the bed. In the Cochin estuary, sediment metals (Cd and Pb) possess strong affinities towards clay, silt and organic carbon, whereas sediment Hg has association with SOC. The preference of Cd towards the clay fraction is notable in the harbour region. A striking difference in the geochemical characteristics of the harbour stations (station 3 and 4), the southern stations (5, 6 and 7) and channel entrance (station 1) was the association of these elements with organic carbon and texture and their inertness towards pH. The above variation in metals with respect to the carrier phases (clay, organic carbon and silt) is indicative of a basic shift in the geochemical properties in response to the texture on moving from south to north estuary. In the station 1 sediments, normalization of metals among the three carrier phases is probably masking their enrichment[41]. Flocculation properties, co-precipitation of iron hydroxide along with scavenging of other elements could be the probable mechanism behind the accumulation of metals in the Cochin estuary.
4.2. Statistical Interpretation of Hydrogeochemical Parameters
- Cluster analyses were performed on the data using group linkage with euclidean distance as a similarity measure and were synthesized as dendrogram plots for various stations (Figure 3). Harbour stations were merged into one cluster because of same hydrogeochemical characteristics. On this basis, clusters (groups) of three sectors were identified. The dendrogram clarified the influence and association of the clusters or groupings by their relative elemental concentrations at each site. Therefore, on the basis of similarity coefficients, stations forms different groups comprise of same characteristics. Biplot of hydrogeochemical concence- ntrations (Figure 10) discriminiates petrochemical and harbour activities are the point sources of Cd, Pb and Hg, apart from SOC, NO2--N, NO3--N and clay texture. Salinity, pH, depth and sandy texture are characteristic features of barmouth and are quite reasonable. Whereas southern sector characterized by of high NPP, DO, SD, TP and silty texture. The association of NPP with SD can be explained on the premise that high SD will help in the process of photosynthesis their by increased NPP and thereby DO. Factor analysis was performed to establish the possible factors that contribute to hydrogeochemical concentration and source apportionment (Table 4). Three axes with eigen values >1 were extracted. The first three factors accounted for over 75% of the total inertia or variance. Factor analysis of the entire data set evolved four factors with Eigen values > 1.0 and 87.63% of the total variance in the water quality data set. The first factor (F1) accounted for 47.95% of total variance and had strong positive loading with NO2--N, PHC, Pb, SOC and clay and negative loading with NPP and sediment pH. These results could be interpreted as influences from point sources such as municipal and industrial effluents. The second factor (F2) accounted for 25.85% of the total variance and has strong positive loading with water pH, salinity, IP, sand and moderate negative loading with SD, DO, TP which again indicating the influence of seawater mixing. In this study, water quality parameter with a strong factor loading (> 0.700) was considered to be a significant parameter contributing to variations of the hydrogeochemical quality in Cochin estuary. NO2--N, NO3-N, PHC, sediment pH and Pb, salinity, SOC, clay, SD, DO, TP, TN, and dissolved Pb, are the most important parameters affecting the hydrogeochemical quality of Cochin estuary (Table 4). High and positive scores for dissolved and sediment metals on varifactors 1 or 2 indicated high anthropogenic metal inputs through point source (Figure 11). It can be seen in these figures that: (i) AT, NPP, DO and SD were included in the same quadrant, (ii) sediment pH, water pH, sand and salinity formed another quadrant (iii) NH4+-N, IP, turbidity, NO2--N, NO3-N, PHC, along with sediment SOC, Hg and dissolved Pb, Cd, Hg in same quadrant. The presence of multiple variables in the same quadrant suggested close association among them. The association between NPP, DO, SD and AT was understandable and explained basis that high SD and AT helped in the plankton production and thus of high primary production. The presence of NH4+-N, NO2--N, NO3-N, IP in the same quadrant indicated that the sources of these inorganic nutrients was identical. Influx of nutrients in the estuarine waters from the Periyar River discharges carries the waste effluents from the fertilizer units might substantiate this finding.
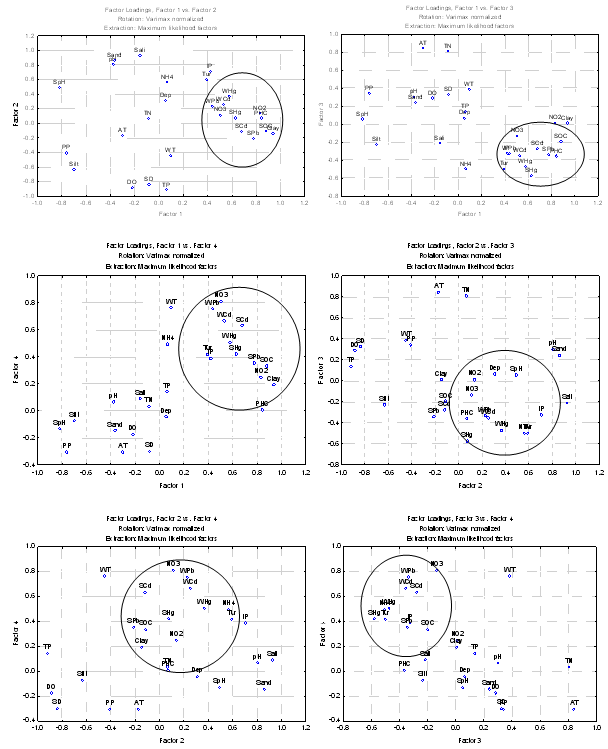 | Figure 11. Scores loadings of the first four principal components (factor:1, factor: 2, factor: 3, factor: 4) explained ~70% of the total variance |
5. Conclusions
- In this study, different multivariate statistical techniques were used to evaluate variations in hydrogeochemical characteristics of the Cochin estuary. Cluster analysis grouped seven sampling sites into three clusters of similar water quality characteristics. Principle component analysis helped in identifying the factors or sources responsible for water and sediment quality variations. The main cause of degradation of the estuary is the discharge of industrial, harbour and of municipal sewage from the upper northern areas of greater Cochin. Movement of ships, barges, fishing boats, extensive dredging, and shipping activities were also among the major sources responsible for deterioration of hydrogeochemical quality of Cochin estuary. This study illustrates the usefulness of multivariate statistical techniques for the analysis and interpretation of complex data sets, which helps for the identification of pollution sources and understanding variations in hydrogeochemical quality for any effective management plan.
ACKNOWLEDGEMENTS
- The authors are grateful to the Ministry of Earth Sciences, Government of India for the financial support during the study period. The authors are grateful to the University authorities for the support and facilities during the study period. We would like to record our deep appreciation to our colleagues who assisted us in sampling, analysis, post processing and the manuscript preparation.