-
Paper Information
- Next Paper
- Paper Submission
-
Journal Information
- About This Journal
- Editorial Board
- Current Issue
- Archive
- Author Guidelines
- Contact Us
Geosciences
p-ISSN: 2163-1697 e-ISSN: 2163-1719
2012; 2(4): 60-65
doi: 10.5923/j.geo.20120204.01
Groundwater Prospecting in Fractured Shale Aquifer Using an Integrated Suite of Geophysical Methods: a Case History from Presbyterian Church, Kpiri-Kpiri, Ebonyi State, SE Nigeria
 Abstract
 Reference
 Full-Text PDF
 Full-Text HTML
Odoh B. I. 1, Utom A. U. 1, Nwaze Simon Obini 2
1Department of Geological Sciences, Nnamdi Azikiwe University
2Ebonyi State Rural Water Supply and Sanitation Agency, Abakaliki, Nigeria
Correspondence to: Odoh B. I. , Department of Geological Sciences, Nnamdi Azikiwe University.
| Email: |  |
Copyright © 2012 Scientific & Academic Publishing. All Rights Reserved.
Groundwater has strategically remained valuable in Ebonyi state, SE Nigeria owing to the lack of surface water reservoir supply facilities maintenance culture and inconsistencies attributed to various limiting factors. But in the study area, groundwater exploration has always being critical since secondary features such as fractures control groundwater movement and occurrence. Intermittent water shortages which lower drilling success rates of water boreholes have also resulted from negligence to the application of geoscientific techniques. To study the groundwater potential and conditions in details, we applied an integrated suite of surface-geophysical methods to characterize the hydrogeology of fractured shale aquifer at the Presbyterian Church, Kpiri-Kpiri, Ebonyi state, SE Nigeria. First, an EM 34-3 electromagnetic anomalies were identified and determined as the location and lateral continuity of fractures and to identify the hydraulic properties of transmissive fractures in the region 180 - 300 meters (highest electrically conductive anomaly). Second, 3 Vertical Electrical Soundings (VES) using Schlumberger configuration with AB/2 spacing ranging from 3.5 m to 165 m were obtained with the main objective of determining the formation resistivities and depth to the aquifer. The last but not the least was the results of an Azimuthal Resistivity Survey (ARS) indicating from graphical interpretation of survey data that the mapped fractures trend generally in the northwest-southeast direction at the depths of 28.3, 40.0 and 50.0 m with the coefficient of anisotropy ranging from 1.15 to 1.55. Areas with low resistivity values were associated with the fracture zones inferring high secondary porosity and high electrical conductivity. This investigation illustrates the effectiveness of the use of combine geophysical methods for identification and evaluation of electrically conductive fracture zones.
Keywords: Groundwater, Fractures, Azimuthal Resistivity, Electromagnetic Method, Vertical Electrical Sounding
Article Outline
1. Introduction
- Presently, it is physically evident that the large urban sector in Ebonyi state relies on groundwater for more than 95% of its water needs constituting a great water supply challenge. Water wells are poorly located and abortive tube wells are often drilled due to partial or total negligence of geoscientific investigation techniques. These wells are also susceptible to drought and contamination especially in dry weather conditions (dry season). Attempts had been carried out under various programs to provide potable groundwater sources to the Abakaliki urban under various programs (Odoh and Ogala, 2008, Utom et al., 2008).The yield of groundwater in a fractured rock terrain isdependent on the size of the fractures and their interconnectivity (Sharma and Baranwal, 2005). Application of Schlumberger resistivity sounding is well know for determining resistivity variation with depth to the aquifer while azimuthal square-array (Lane et al., 1995) resistivity sounding provides method for measuring in-situ anisotropy and directional nature of vertically dipping fracture system. However, inductive terrain conductivity method (EM 34-3) has also been used as a fast reconnaissance to profile across the selected areas in order furnish a priori information on possible areas of linear features such as joints and fracture zones (McNeil, 1990) before resistivity soundings. Electromagnetic and resistivity methods have been widely used in groundwater prospecting due to the close good correlation and relationship between electrical conductivity and hydrological parameter (Goldmann and Neubaur, 2004). Therefore, an integrated use of electromagnetic (EM 34-3) and direct-current (DC) resistivity techniques has the potential to be successful (Benson et al., 1997, Bernard and Valla, 1991).
2. Terrain Geology and Geohydrology
- The study area (Figure 1) is part of the Abakaliki shale Formation which lies within the Albian Asu River Group. The area is mainly characterized by rather poorly bedded shale, occasionally sandy, splintery metamorphosed mudstone. Lenses of sandstone and sandy limestone are highly jointed and fractured. It has been noted that the influence of tectonic activities which introduced the discordance dip between the Asu River Group and the overlying Turonian Eze-Aku Formation (Afikpo Basin). Younger intrusive bodies in combination with numerous faults and joint systems have the secondary porosity in the shale Formation. The fracture systems which spread across Abakaliki anticlinorium and Afikpo syncline in the Benue rift during the deformational episode originated from vertical movement resulting from the rising and cooling of magma, which intruded the sediments in the Santonian time (A.C. Umeji, personal communication, 2005).Paleontologically, the study area is mainly characterised by species of Mortoniceras and Elobiceras (Reyment, 1965). Pelecypods and Gastropods are also relatively rare. The sediments are folded and fractured particularly in the country south of Abakaliki; the fold axes stretch NW – SE. The formation is associated with lead-zinc mineralization. Hydrogeologically, weathered rocks, alluvium and fractured zones form the aquifers in the study area. However, pockets of weathered and fractured rocks may form isolated groundwater reservoirs.
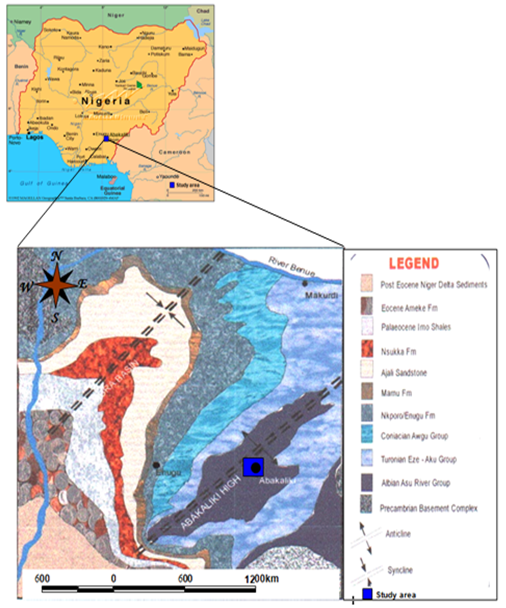 | Figure 1. Location and geological map of the study area |
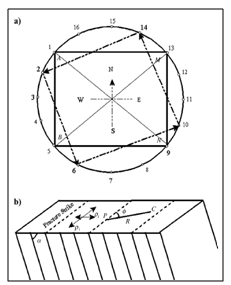 | Figure 2(a). Electrode arrangement for the square-array azimuthal survey; A, B = current electrodes; M, N = potential electrodes. (b) A homogeneous anisotropic half-space showing the orientation Ф of current and potential electrodes positions (C and P) with respect to the strike of fractures; ρl is the apparent resistivity measured when measurement electrode are aligned longitudinal (parallel) to the fracture strike, and ρt is the traverse alignment of electrodes with respect to fracture strike. The term α is the angle the fracture makes with the vertical (Boadu et al., 2005) |
3. Surface Geophysical Methods
3.1. Electromagnetic Surveys
- The EM 34-3 inductive terrain conductivity method (Powers et al., 1999) was used with a 20-m coil separation. Data was collected at every 20 m. Depending on whether the coils are operated in the horizontal dipole mode or the vertical dipole mode, the depths of investigation are 3.8 m, 7.6 m and 15.2 m in the horizontal dipole mode, and 8.7 m, 17.4 m and 34.8 m in the vertical dipole mode (Barker et al., 1992). The method of application of Geonics EM 34-3, its advantages and disadvantages are well documented by MacNeil (1980). The conductivity of the near surface and deeper layers could be determined from the response of EM 34-3 in horizontal and vertical dipole mode (Kellet and Bauman, 2004). In this study area, we ran one traverse along the E – W direction.
3.2. Resistivity Surveys
- The three (3) georesistivity data which was measured in the study area by Vertical Electrical Soundings (VES) Schlumberger configuration with the AB/2 spacing ranging from 3.5 m to 165 m is generally acceptable for groundwater exploration due to its well known variation of apparent resistivity with depth (Edwards, 1977). The VES data was first interpreted using the conventional curve matching techniques and later using the quantitative interpretation made using the IP12WIN program to determine the thicknesses and apparent resistivities of the stratigraphic units. The geometrically corrected measurements are defined as apparent resistivities controlled by material resistivity and the presence, quality and quantity of groundwater and by secondary porosity or precipitation in the case of resistivity of a fracture zone. Azimuthal square-array resistivity technique (Lane et al., 1995) was further used to identify the anisotropy caused by the fractures and the dominant strike direction as well. The azimuthal square-array profiling method uses two squares of electrodes of equal side length “A” spacing (m) rotated by 22.5o around a centre point, defined as the measurement location (Figure 2). The array expanded symmetrically about the central point, in increments of A (2)1/2 (Habberjam and Watkins, 1987), so that the soundings can be interpreted as a function of depth.
4. Results and Discussion
- Figure 3 shows the relative amplitudes of the vertical and horizontal components to predict the presence of any vertical conductor (faults and fractures). It is a general knowledge that porosity (secondary porosity in case of fissured rocks) increases with conductivity (Kortatsi and Quansah, 2004). Thus, the region 180 – 300 m as shown in Figure 3 is probably interpreted as the most deeply weathered with no uniform conductivity that increases from 6 to 23 mmhos/m. The fracture zone between 180 m and 300 m provide a good correlation for sitting water borehole. Another significantly better yield may be expected from a borehole drilled into the fracture mapped around VES 1 station (region 80 – 125 m).The Figure 4 show the correlation between the geoelectrical parameters and the geology from VES 3 carried out along EM 34-3 traverse line. The result of the VES investigations shows that the surface unit whose resistivity range from 850 Ωm to 1025 Ωm is 2 -11 m thick corresponding to the dry reddish lateritic overburden. The second geoelectric unit, which is associated dry shale (fresh) shows relatively high resistivity values followed by moist grey and saturated fractured shale unit characterized by relatively low resistivity values (8 - 50 Ωm) and then by dry weathered shale. Within the rock units, there are several linear features of low resistivity values that are interpreted as fracture zones. The interpretation of the subsurface rock layer from the georesistivity was constrained by a priori geologic and borehole information within the study area.The cross square-array data provided information about the resistivity as a function of direction (22.5o) at each station along the profile. The mean apparent resistivity and the magnitude of apparent anisotropy in the resistivity were determined for each crossed square. A decreased mean resistivity and an increase in porosity indicate the location of the fracture zone. Also, the fracture strikes trending northwest- southeast at the depths of 28.3, 40.0 and 50.0 m were identified to be perpendicular to the direction of maximum apparent resistivities (Keller and Frischknetch, 1966) as shown in Figure 5.The secondary porosities for the azimuthal square-array, which is a measure of the magnitude of resistivity variation as a function of direction, were evaluated from Lane et al (1995) equations:
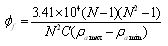 | (1) |
 | (2) |
 | (3) |
 is the fracture porosity; N is the vertical anisotropy related to the coefficient of anisotropy λ and α, dip of the bedding plane as shown in equation (2);
  is the maximum apparent resistivity;
  is the minimum apparent resistivity;
  and
and  are, respectively the apparent resistivity transverse and longitudinal to the direction of the fracturing; and C = specific conductance of ground water in microsiemens per centimeter (μs/cm). In this study, the specific conductance of groundwater in the Abakaliki shale averaged 736 μs/cm.
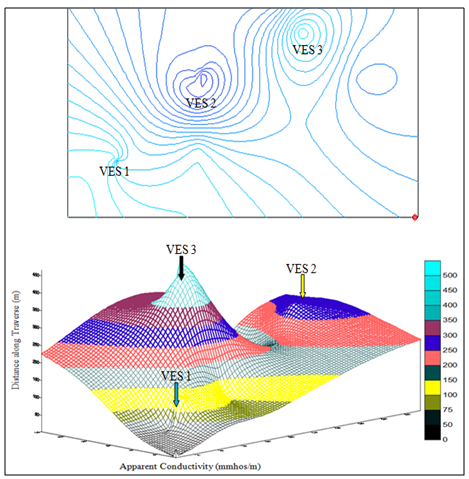 | Figure 3. 2D (top) and 3D (base) Geonics response contour map along the traverse in the study location with the anomalous peak points indicating the presence of subsurface fractures. Highly fractured bedrock was encountered at the VES 2 region of (180 - 300 m) followed by the VES 3 region (400 – 500 m) and lastly by the VES1 region (80 – 125 m) |
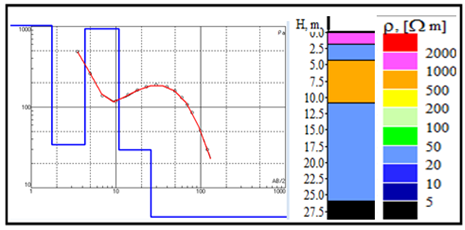 | Figure 4. Typical representation of the vertical electrical sounding curve, VES 3 |
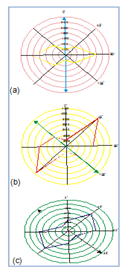 | Figure 5. ARS polar plots of the apparent resistivities against azimuths at depths: (a) 28.3m (b) 40.0m (c) 50.0m |
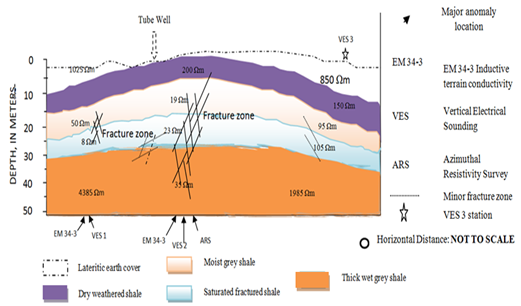 | Figure 6. Integrated geophysical survey model in the study area. The weathered zones are characterized by low resistivities |
5. Conclusions
- This paper has illustrated how the three geophysical methods were used to determine the location of fracture zones in the sedimentary terrain for groundwater prospecting (Figure 6). Two methods of the direct-current (DC) resistivity (one-dimensional Schlumberger-array and azimuthal square-array profiling) and inductive terrain electromagnetic (EM 34-3) were used over a survey line extending about 500 meters. Results of the measurements were well correlated. The results obtained from the integrated interpretation of the electromagnetic and resistivity, agree with the geology of the study area. The deeply weathered/fractured zone ranging from 6 – 23 mmhos/m between 180 m and 300 m provide a good correlation for siting borehole. The results also revealed the existence of five major georesistivity units with resistivity values generally ranging from 8 to 4385 ohm-m and thickness between 10 and 22 m. The saturated fractured shale unit is characterized by relatively low resistivity values (8 - 50 Ωm). The estimated secondary porosity of the interpreted fracture zones is between 0.002 to 0.009 percent. Meanwhile porosity is roughly proportional to the cube of permeability. It has also been demonstrated that the coefficient of anisotropy has the same functional form as permeability anisotropy to the first order (Bespalov et al., 2002). Conclusively, careful selection of acquisition parameters, processing steps and interpretation strategies are important for providing geophysical models that are useful for targeting successful boreholes.
ACKNOWLEDGEMENTS
- Part of this study was supported by the Society of Exploration Geophysicists (SEG) Foundation Project of Merit Grant. The authors thank anonymous reviewers for their comments and suggestions. The paper was presented at the 5th International Conference on Applied Geophysics in Phuket, Thailand, 11-13 November, 2010.