-
Paper Information
- Next Paper
- Previous Paper
- Paper Submission
-
Journal Information
- About This Journal
- Editorial Board
- Current Issue
- Archive
- Author Guidelines
- Contact Us
Geosciences
p-ISSN: 2163-1697 e-ISSN: 2163-1719
2012; 2(3): 51-59
doi: 10.5923/j.geo.20120203.03
Geostatistical Assessment of Groundwater Quality from Coastal Aquifers of Eastern Niger Delta, Nigeria
 Abstract
 Reference
 Full-Text PDF
 Full-Text HTML
Amadi A. N. 1, Olasehinde P. I. 1, Yisa J. 2, Okosun E. A. 1, Nwankwoala H. O. 3, Alkali Y. B. 1
1Department of Geology, Federal University of Technology, Minna, Nigeria
2Department of Chemistry, Federal University of Technology, Minna, Nigeria
3Department of Geology, University of Port-Harcourt, Port Harcourt, Nigeria
Correspondence to: Amadi A. N. , Department of Geology, Federal University of Technology, Minna, Nigeria.
| Email: |  |
Copyright © 2012 Scientific & Academic Publishing. All Rights Reserved.
The quality of groundwater in the coastal aquifer of eastern Niger Delta has been assessed in the present study using Geostatistical techniques. The range, standard deviation and variance of the dataset show that multi-chemical processes are controlling the groundwater quality/facies and their spatial distributions. The overall WQI value was 285.20 and this is an indication that the groundwater in the area is of poor quality. The higher mean values of copper, iron, lead, nitrate, TC, EC, COD, chromium, nickel and zinc are some of the contributors to deteriorating groundwater quality and their presence can be attributed to both natural and anthropogenic sources. Six Factors, accounting for 91.18% of the total variance were identified. Factors 1 (Conductivity, Cl-, TH, TSS, TDS, Na and Mg), factor 2 (Ca, Fe, pH, NO3-, K and SO42-), factor 3 (BOD, COD, PO42-, EC and TC), factor 4 (Cu, F, Mn and Zn), factor 5 (Cr, Pb and Ni) and factor 6 (Ar and Hg) represent the signatures of saltwater intrusion, chemical weathering, leaching and various human activities domiciled in the area. Factors 1 and 2 represents ions with dominant concentration and therefore are the contributors to the groundwater salinity while factors 3 to 6 are indicators of anthropogenic interference. Piper diagram revealed that the water in the area is Calcium-Chloride type, suggesting a marine origin. The usefulness of Geostatistical methods in interpreting the hydrogeochemical data as well as identifying and categorizing pollutants has been demonstrated in this study.
Keywords: Geostatistical Techniques, Groundwater Quality, Eastern Niger Delta
Article Outline
1. Introduction
- The Niger Delta region of Nigeria is among the world’s largest petroleum provinces and its importance lies on its hydrocarbon resources. Due to the presence of oil companies and other associated industries, the population has increase enormously and the demand for potable water by individuals and companies has also increased. The area has a good groundwater potential, and as a result, boreholes are common leading to high rate of groundwater abstraction which may pose a serious pressure on groundwater resources if unchecked[1].Groundwater is used for domestic and industrial water supply and irrigation all over the world. In the last few decades, there has been a tremendous increase in the demand for fresh water due to rapid growth of population and the accelerated pace of industrialization[2]. Human health is threatened by most of the agricultural development activities particularly in relation to excessive application of fertilizer and unsanitary conditions. Rapid urbanization, especially in developing countries like Nigeria, has affected the availability and quality of groundwater due to its overexploitation and improper waste disposal[3]. According to World Health Organization,[4] 80% of all the diseases in human being are water-borne. Once groundwater is polluted, its quality cannot be restored by stopping the pollutants from the source. It therefore becomes imperatives to regularly monitor the quality of groundwater and to device means to protect it. Also most of the companies operating in the area discharge their effluent directly into the sea or creek without considering the effects of these wastes on the coastal shallow aquifers and aquatic lives.Previous studies on groundwater quality and aquifer characteristics of the Niger Delta by[5], indicated two hydrogeochemical regimes for the area: the inland and the coastal as well as high iron content in the groundwater.[6] observed that the groundwater problem in the area includes salinity, bacteriological contamination and the presence of some undesirable ions.[7] outlined factors controlling saline water migration in coastal aquifers of southern Nigeria and observed that the chemistry of the natural water in Port-Harcourt and Degema areas changes with season.[8] identified one major and two sub-aquifer horizon within the geological and geomorphological units of the Niger Delta.[9] delineated the extent of seawater intrusion in the coastal beach ridge of the Forcados, Niger Delta using geoelectric survey data.[10] observed that nitrate, sulphate and pH are higher in rainwater than in groundwater in Port-Harcourt area while[11] noticed low pH in the groundwater from the area.[12] identified the problem of high iron content, saltwater intrusion and tidal influence on the groundwater from the area while[3] attributed the groundwater problem in the area to saltwater intrusion, low pH and high concentration of heavy metal. Salinity problems in other parts of the world have been studied by[13-17] considered the intrusion saltwater into freshwater aquifers as a result of over-exploitation of groundwater resources.The objective of the present work is to discuss the suitability of groundwater from the shallow coastal aquifer of eastern Niger Delta, Nigeria for human consumption using Geostatistical approach. This is necessary because the coastal plain-sand aquifer of eastern Niger Delta is characterized by shallow water table, high porosity and permeability, which makes the aquifer vulnerable qualitatively and prolific quantitatively.
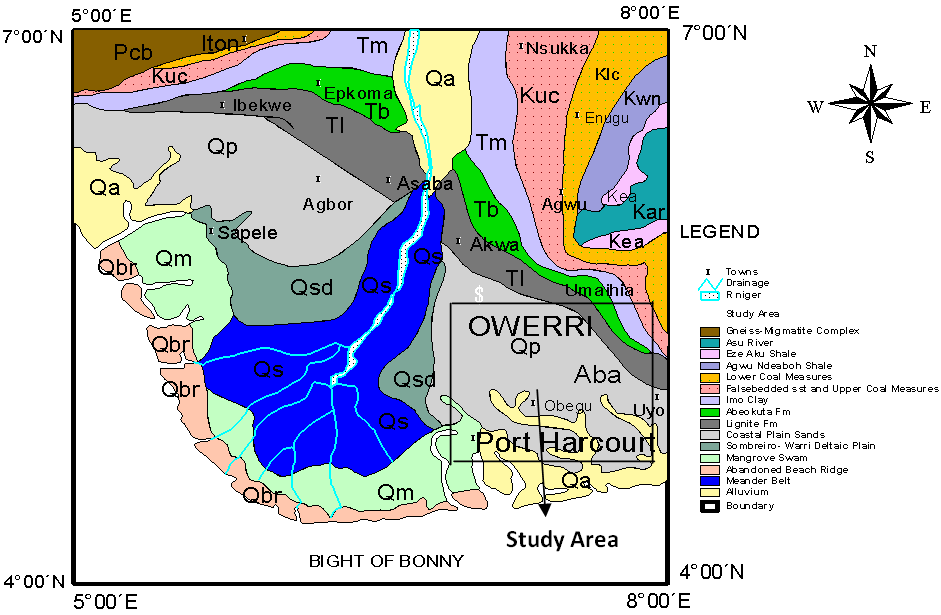 | Figure 1. Geological map of Niger Delta showing the study area[22] |
|
2. Materials and Methods
2.1. Study Area Description
- The study area lies within the eastern Niger Delta region of Nigeria (Fig.1), covering parts of Abia, Imo and Rivers States. It is situated between latitude 420IN to 5º50IN and longitude 6º10IE to 7º40IE [Fig.1, 18]. The area is generally low lying with a good road network system and is drained by Aba, Imo and Bonny Rivers and their tributaries.
2.2. Geomorphology, Geology, Hydrogeology and Stratigraphy of the Area
- The formation of the Niger Delta Basin is linked to the development of the Benue Trough as a failed arm of a rift triple junction associated with the separation of African and South Ameriacan plates and the subsequent opening of the South Atlantic[19-21]. The Niger Delta consists of three diachronous units, namely: the Akata (oldest), Agbada (intermediate) and Benin (youngest) Formations (Fig. 2; Table 1). The Benin Formation (Oligocene to Recent) is about 2100 m thick at the basin centre and consists of medium to coarse-grained sandstones, thin shales and gravel[22]. It is the most prolific aquifer in the region. Overlying this formation are the Quaternary deposits (Table 2), an unconfined aquifer sequence comprising of rapidly alternating sequence of sand, silt and clay with the silt and clay becoming very prominent seawards[Table 2, 23]. The Niger Delta spreads across a number of ecological zones, comprising sandy coastal ridge barriers, brackish/saline mangrove, freshwater and swamp forest[8]. Recharge to aquifers is by direct infiltration of rainfall, which ranges annually from 2540 mm on mainland to about 5010 mm towards the coast[6]. The wettest months are May to October while the driest month months are December to March, although some pockets of rain is likely to fall in the driest months[23]. Groundwater in the area occurs in shallow aquifers belonging to the coastal plainsand, comprising of sand, gravel and clay intercalations[3]. Borehole yields is very good, with production rates of about 20,010 l/h and borehole success rate is usually high[6]. The transmissivity ranges 59.00 to 6050.00 m2/d, hydraulic conductivity varies from 0.04 to 60.00 m/d and storage coefficient is of the order of 10-6 to 0.15[7,24]. Surface water occurrence in the area is numerous which includes, streams, rivers and creeks
2.3. Sample Collection and Laboratory Analysis
- A total of 158 groundwater samples were collected between April, 2009 and October, 2010 using two sets of polyethylene bottles of one liter capacity, for cation and anion analysis and labeled accordingly. The boreholes were allowed to flow for about 3 minutes before the water is collected, and containers were thoroughly washed and rinsed with the water to be collected into them. Samples for the determination of cations were stabilized with dilute hydrochloric acid on collections. All the samples were preserved by refrigeration and analyzed within 24 hours of collection. The analyses were carried out in accordance with[25] Spectrophotometric method was used to analyze for cations and anions. The physical parameters pH and conductivity were determined on the field using a calibrated pH meter and conductivity meter respectively. The microbial analysis was done using carried out using the filter membrane method and presumptive count and each sample was incubated for at least 24 hours.
3. Geostatistical Techniques
3.1. Water Quality Index
- Water quality index (WQI) is one of the most effective tools to communicate information on the quality of water to the concerned citizens and policy makers. It thus, becomes an important parameter for the assessment and management of surface water. WQI is a scale used to estimate an overall quality of water based on the values of the water quality parameters[26]. It is a rating reflecting the composite influence of different water quality parameters. WQI is calculated from the point view of the suitability of groundwater for human consumption[2,27].
3.2. Calculation of WQI
- The Water Quality Index (WQI) was calculated using the Weighted Arithmetic Index method. The quality rating scale for each parameter qi was calculated by using this expression:
 A quality rating scale (qi) for each parameter is assigned by dividing its concentration (Ci) in each water sample by its respective standard (Si) and the result multiplied by 100 Relative weight (Wi) was calculated by a value inversely proportional to the recommended standard (Si) of the corresponding parameter:
 The overall Water Quality Index (WQI) was calculated by aggregating the quality rating (Qi) with unit weight (Wi) linearly.
 Where:qi: the quality of the ith parameter, wi: the unit weight of the ith parameter and n: the number of the parameter considered.Generally, WQI were discussed for a specific and intended use of water. In this study the WQI for drinking purposes is considered and permissible WQI for the drinking water is taken as 100.Overall
3.3. Factor Analysis
- Geostatistical techniques simplifies and organizes large geochemical data-sets into meaningful information[3,28]. In the present study, factor analysis (FA), was also used to evaluate the concentrations of physical, chemical and bacteriological data from groundwater samples in Port-Harcourt. The statistical software package SPSS 16.0 for windows[29] was used for the analysis.In the last two decades, Factor analysis (FA) has been successfully used to sort out the hydrochemical processes and relationships of analyzed groundwater data[26,30-32]. The purpose of FA is to simplify the quantitative description of a system by determining the minimum number of new variables necessary to reproduce various attributes of the data. These procedures reduce the original data matrix from one having (n) variables necessary to describe the (N) samples to a matrix with (m) factors (m < n) for each of the (N) samples. It is also aimed at transforming the variables so that the axes become orthogonal, which then allows the definition of new independent variables. By so doing, the first factor is chosen to explain as much as possible of the total variance of the observations, the second factor to explain as much as possible of the residual variance, and so forth.In other words, the first factor is determined such that the sum of squares of the projections of the points on the factor is highest (factor loadings). Next, to define the second factor, the points are projected on a plane orthogonal to the first factor and so on for the other factors, each explaining less and less of the total variance. On the other hand, the sum of squares of the factor loadings for each variable is the communality and reflects the proportion of the total variability of each variable accounted for by the factoring. The FA subsumes a fairly large variety of procedures. It follows three main steps, namely: extraction initial factors, rotation of factors and calculation of each factor scores. In the present work, factor extraction was done by principal components; whereas, Varimax rotation with Kaiser normalization was used for orthogonal rotation and results in factors that are uncorrelated[33]. The factor scores that are computed for each observation[34,35] which expresses the importance of each factor at that observation site.[36] outlined the importance of factor scores and their relations to potential of the processes described by each factor. R-mode procedure was applied for finding a comparison of the relations among the variables in terms of the samples.
4. Results
- The statistical overview of groundwater chemistry data from Port-Harcourt City are summarized in Table 3.The computed WQI values of the groundwater from the area is shown in Table 4 while the global water quality classification scheme is summarized in Tables 5. The results of principal component analysis generated from the data with the aid of SPSS 16.0 for windows are illustrated in Table 6.
5. Discussion
- A close look at Table 4 shows chromium, chemical oxygen demand (COD), total coliform (TC), iron, lead, nickel and Escherichia coli (EC) have slightly higher mean concentration when compared with the Nigerian Standard for Drinking Water Quality[37]. The mean was used as estimate of central tendency. The distribution of the original data for all the parameter analyzed were positively skewed except pH, which implies that measure of the central tendency are not dominated by outliers in the distribution. Large standard deviations and variance in the case of chloride, conductivity, total hardness, nitrate, sulphate and total dissolved solids revealed their randomly fluctuating concentration levels in the groundwater. In each case, test for normality were conducted using the test based on analysis of the combined effects of skewness and kurtosis. The substantial difference in the symmetric parameters in the case of copper, iron, lead, nitrate, TC, EC, chromium, nickel and zinc indicated a non-normal distribution, thus supporting a possibility of the their enrichment through some anthropogenic sources.All the physical, chemical and bacteriological parameters analyzed were used to calculate the WQI in accordance with the procedures explained above and contained in Table 4. The computed overall WQI value was 285.20 and this means that the groundwater in the area falls within the ‘very poor quality’ as contained in Table 5.Overall
 The high value of WQI obtained was as a result of the high concentration of copper, iron, lead, nitrate, TC, EC, COD, chromium, nickel and zinc in the groundwater which can be attributed to natural sources such as saltwater intrusion and chemical weathering processes as well as the various human activities taking place in the area.In addition to WQI, factor analysis (FA) of the studied groundwater samples was performed in order to get an overall impression about assembling the samples in a multidimensional space defined by the analyzed parameters. The FA has emerged as a useful tool for better understanding of the relationship among variables and for revealing groups (or clusters) that are mutually correlated within a data body. This procedure reduces overall dimensionality of the linearly correlated data by using a smaller number of new independent variables called varifactor, each of which is a linear combination of originally correlated variables (Table 6). Six Factor Components (Eigenvalues > 1) emerged accounting for. The first factor loading with 27.30% variance showed higher loading for chloride, conductivity, total hardness (TH), total dissolved solid (TDS), total suspended solid (TSS), pH, magnesium and sodium. The high concentration of chloride, conductivity and total dissolved solid is an indication that the groundwater may be in contact with water of marine origin and that there is a possibility of saltwater intrusion into the coastal aquifer system in the area. High chloride concentration in groundwater may indicate pollutions by sewage, industrial waste or saline water intrusion[38]. Chloride and sodium have health implication on human but at high concentration chloride could impart taste in water.
|
|
|
|
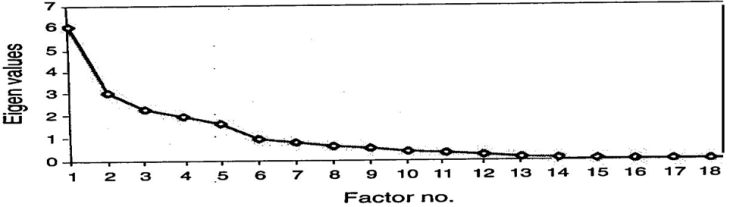 | Figure 2. Scree-plot test |
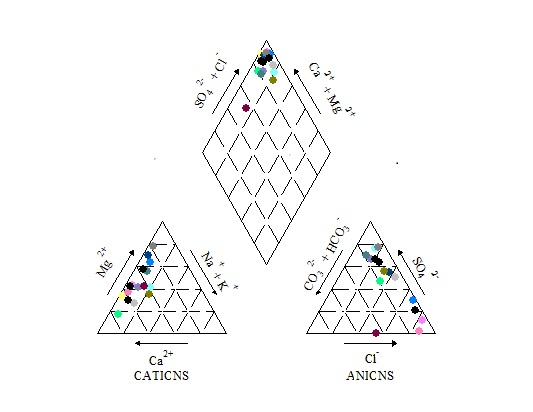 | Figure 3. Piper diagram of the groundwater from the study area |
5.1. Piper Diagram
- The concentration of 8 major ions (Na+ ,K+, Mg2+, Ca2+, Clˉ, CO32-, HCOˉ3 and SO42-) are represented on the Piper trilinear diagram by grouping the (K+ with Na+) and the (CO32- with HCOˉ3), thus reducing the number of parameters for plotting to 6. On the piper diagram, the relative concentration of the cations and anions are plotted in the lower triangles, and the resulting two points are extended into the central field to represent the total ion concentration. The degree of mixing between waters can also be shown on the piper diagram (Fig.3). The Piper diagram was developed by[48] and used to classify the hydrochemical facies of the water samples according to their dominant ions. The water in the area is Calcium-Chloride type, which suggests that the water might be from a marine source with calcium and chloride as dominant cation and anion in the groundwater system. This is a reflection of the wide range and high standard deviation and variance observed in the ionic concentration of calcium and chloride in the dataset.
6. Conclusions
- The result of the multivariate statistical analysis, as applied to the hydrochemical data set in the coastal area of eastern Niger Delta, provides an insight into the underlying factors controlling hydrogeochemical processes in the area. The observed wide range, high standard deviation and variance in some of the parameters are indications that there are substantial differences in the groundwater quality within the study area. The WQI value was 285.20, which suggest that the groundwater in the area as very poor in quality. The high value of WQI obtained was due to the high concentration of copper, iron, lead, nitrate, TC, EC, COD, chromium, nickel and zinc in the groundwater which can be attributed to both natural and anthropogenic sources. Factors analysis reduces the dataset into six major components representing the different sources of the contaminant. Major contributors to factor 1 and 2 are natural phenomenon while those of factors 3 to 6 were of anthropogenic origin. The water in the area is Calcium-Chloride type from Piper diagram, which suggests that the water might be from a marine source. Controlled abstraction of groundwater is recommended in the area and industrial wastes should be treated before discharged into the environment. Standard sanitary landfill system and proper lining of soak-away and pit-latrine should be enforced in the area. The effectiveness of Geostatistical techniques (WQI and FA) in groundwater quality studies have been demonstrated in this study.
References
| [1] | H. O. Nwankwoala, J. Shalokpe. Groundwater Resource Evaluation of Amuwo-Odofin, Lagos State, Nigeria. International Journal of Natural and Applied Sciences, 2008, 4(3): 330–336. |
| [2] | A. N. Amadi, P.I. Olasehinde, J. Yisa. Characterization of Groundwater Chemistry in the Coastal plain-sand Aquifer of Owerri using Factor Analysis. Int. J. Phys. Sci., 2010, 5(8): 1306-1314. |
| [3] | A. N. Amadi. Effects of urbanization on groundwater quality: A case study of Port-Harcourt, Southern Nigeria. Natural and Applied Sciences Journal, 2010, 11(2): 143 – 152. |
| [4] | World Health Organisation, WHO. International Standards for Drinking Water. 3rd Edition, Geneva, 2003, 346-385. |
| [5] | J. O. Etu–Efeotor. Preliminary hydrogeochemical investigation of subsurface waters in parts of the Niger Delta. Journal of Mining and Geology, 1981, 18: 103 – 105. |
| [6] | J. O. Etu–Efeotor, M. I. Odigi. Water supply problems in the Eastern Niger Delta. Journal of Mining and Geol.,1983, 20(1): 182 – 192. |
| [7] | U. M. P. Amadi, P. A. Amadi. Saltwater migration in the coastal aquifers of southern Nigeria. Journal of Mining and Geology, 1990, 26(2): 35 –44. |
| [8] | J. O Etu–Efeotor, G. E Akpokodje. Aquifer Systems of the Niger Delta. Journal of Mining and Geology, 1990, 26(2): 264 – 266. |
| [9] | A. U. Oteri. Delineation of saltwater intrusion in a coastal beach ridge of Forcados.Journal of Mining and Geology, 1990, 26(1): 31 – 45. |
| [10] | S. A. Ngah. Patterns of groundwater chemistry in parts of the Niger Delta. 38th Annual International Conference of Nigerian Mining and Geosciences Society, Abstract, 2002, 39p. |
| [11] | A. E. Ofoma, D. Omologbe, P. Aigberuna. Physico-chemical quality of groundwater in parts of Port-Harcourt City, Eastern Niger Delta. Journal of Water Resources, 2005, 16: 16 – 24. |
| [12] | H. O. Nwankwoala, G. J. Udom. Influence of land Reclamation on the status of Groundwater in Borokiri Area of Port Harcourt, Niger Delta, Nigeria. International Journal of Natural and Applied Sciences, 2008, 4(4): 431 –434. |
| [13] | A. M. Hoguane, A. E. Hill, J. H. Simpson and D. G. Bowers. Diurnal and tidal variation of temperature and salinity in the Ponta Rosa Mangrove Swamp, Mozambique Estuarine. Coastal and Shelf Science, 1999, 4: 251 – 264. |
| [14] | E. Karro, A. Marandi, R. Vaikmae. The origin of increased salinity in the CambriamVendian aquifer system on the Kopli Penninsula, Northern Estonia. Hydrogeology Journal, 2004, 12: 424 –435. |
| [15] | S. Faye, P. Maloszewski, W. Stichler, P. Trimborn. Groundwater salinization in the Saloun (Senegal) delta aquifer using minor elements and isotopic indicators. Science of the Total Environment, 2004, 343: 243 – 259. |
| [16] | Q, Zhang, R. E. Volkes, D. A. Lockington. Numerical investigation of seawater intrusion at Gooburrum Bundaberg, Queensland Australia. Hydrogeology Journal, 2004, 12: 674 – 687. |
| [17] | L. Vives, M. Varni, E. Usunoff. Behaviour of the freshwater and saltwater phases in an urban area in Western Buenos Aires Province, Argentina, Hydrogeology Journal, 2005, 13: 426 – 435. |
| [18] | K. C. Short, A. J. Stauble. Outline of the geology of Niger Delta, American Association of Petroleum Geologists Bulletin, 1967, 51: 761-779. |
| [19] | J. R. L. Allen. Late Quaternary Niger Delta and Adjacent areas. American Association of Petroleum Geologist Bulletin, 1965, 49: 547 – 600. |
| [20] | E. Oomkens. Lithofacies relations in the Late Quanternary Niger Delta Complex. Sedimentology, 1974, 21: 115 – 122. |
| [21] | B. D. Evamy, J. Haremboure, P. Karmerling, W. A. Knaap, F. A. Molloy, P. H. Rowlands. Hydrocarbon habitat of the Tertiary Niger Delta, American Association of Petroleum Geologists Bulletin, USA, 1978, 62: 1-39. |
| [22] | K. J. Weber, E. M. Daukoru. Petroleum geological aspect of the Niger Delta. Proc. 9th World Petrology Congress, 1975, 2: 209 – 222. |
| [23] | A. E. Ofoma, S. A. Ngah. Applicability of solute balance technique in estimating recharge: A case study of a paved and non-paved area of the Eastern Niger Delta, Nigeria. Global Journal of Pure and Applied Sciences, 2006, 12, 15 – 30. |
| [24] | M. I. Odigi. Evaluating groundwater supply in Eastern Niger Delta, Nigeria. Journal of Mining and Geology, 1989, 25(1): 159 – 164. |
| [25] | American Public Health Association, APHA. Standard Methods for Examination of Water and Wastewater. 19th Edn, Published by E and FN SPON, Washington, DC., 1985, 2-56. |
| [26] | A. N. Amadi. Assessing the Effects of Aladimma Dumpsite on Soil and Groundwater Using Water Quality Index and Factor Analysis. Australian Journal of Basic and Applied Sciences, 2011, 5(11): 763 – 770. |
| [27] | J. W. Njenga. Comparative studies of water chemistry of four tropical lakes in Kenya and India. Asian J. Water, Environ. Pollu., 2004, 1: 87-97. |
| [28] | N. Lambarkis, A. Antonakos, G. Panagopoulos. The use of multi-component statistical analysis in hydrogeological environmental research. Water Res. 2004, 38(7):1862-1872. |
| [29] | Statistical Package for the Social Sciences SPSS-16. SPSS Inc., Chicago, USA, 2009. |
| [30] | F. W. Lawrence, S. B. Upchurch. Identification of recharge areas using geochemical factor analysis. Groundwater, 1982, 20: 680-687. |
| [31] | M. Saad, A. Turgeon. Application of principal component analysis to long-term reservoir management. Water resources, 1988, 24(7): 907 – 912. |
| [32] | Olobaniyi, S. B. and Owoyemi, F. B. Characterization by factor analysis of the chemical facies of groundwater in the deltaic plain-sands aquifer of Warri, Western Niger Delta, Nigeria. African Jour. Of Science and Tech., 2006, 7(1): 73-81. |
| [33] | E. J. Usunoff, A. Guzman. Multivariate analysis in hydrochemistry: An example of the use of factor and correspondence analysis. Groundwater, 1989, 27(1): 27 – 34. |
| [34] | J. E. Klovan. R-mode and Q-mode factor analysis: In R. B. McCammaon (ed), Concepts in Geostatistics, Springer-Verlag, New York, 1975, 168p. |
| [35] | R. K. Johnston. Multivariate statistical analysis in geography. Longman Inc., New York, 1980, 280p. |
| [36] | M. G. Dalton, S. B. Upchurch. Interpretation of Hydrochemical facies by factor analysis. Groundwater, 1978, 16(4): 228 – 233. |
| [37] | Nigerian Standard for Drinking Water Quality, NSDWQ. Published by Nigerian Industrial Standard, 2007, 554: 1-14. |
| [38] | J. Bertram, R. Balance. Water quality monitoring: A practical guide to the design and implementation of freshwater quality studies and monitoring programmes. 1st Edn. Taylor and Francis, USA, 1998, 400p. |
| [39] | I. M. Adekunle, M. T. Adetunji, A. M. Gbadebo, O. B. Banjoko. Assessment of groundwater in a typical rural settlement in southwest Nigeria. Inter. J. Environ. Public Health, 2007, 4: 307 -318. |
| [40] | M. McCasland, N. M. Trautmann, R. J. Robert, K. S. Porter. Nitrate: Health effects in drinking water, 2007, http://psep.cce.cornell.edu/facts-slides-self/facts/nit-heef-grw85.aspx. |
| [41] | USEPA. National standard for drinking water. United States Environment Protection Agency, 2002, 816-F-02-013. |
| [42] | T.V. Otukune, C.O. Biukwu. Impact of Refinery Influent on Physico-chemical properties of a water body on Niger Delta. J. Appl. Ecol. Enviro. Res., 2005, 3: 61-72. |
| [43] | D. R. Odero, E. Semu, G. Kamau. Assessment of cottage industry-derived heavy metal pollution of soil within Ngara and Gikomba area of Nairobi city, Kenya. African journal of Science and Technology, 2000, 1: 52 – 62. |
| [44] | N. J. A. Baptista, B. J. Smith, J.J. McAllister. Concentration of heavy Metals in sediments from urban runoff: Implications for environmental quality emNitteroi/RJ-Brazil. An Acad. Bras Cienc., 2007, 79: 981-995. |
| [45] | Y. Nakamaru, K. Tagami, S. Uchida. Antimony mobility in Japanese agricultural soils. Environ. Pollt. 2006, 141: 321 – 326. |
| [46] | M. P. Tighe, S. Ashley, S. Lockwood, S. Wilson. Soil, water and pasture enrichment of antimony and arsenic within a coastal floodplain system. Sci. Total Environ., 2005, 347: 175 – 186. |
| [47] | B. K. Mandal, K. T. Suzuki. Arsenic round the world: A review. Talanta, 2002, 58: 201 – 235. |
| [48] | A. M. Piper. A graphical procedure in the geochemical interpretation of water analysis. Trans. Ameri. Geophysics Union, 1944, 25: 914–923. |