Maria N. Reshetnyk
National Nature Science Museum of NAS Ukraine; Kiev, 01130, Ukraine
Correspondence to: Maria N. Reshetnyk , National Nature Science Museum of NAS Ukraine; Kiev, 01130, Ukraine.
| Email: |  |
Copyright © 2012 Scientific & Academic Publishing. All Rights Reserved.
Abstract
In this work, the new magnetometric method of investigations of Precambrian rocks – Method of Magnetic Scanning MS is proposed. MS it is a complex petro-magnetic method of detail investigation of rocks exposures. It is the combination of field and laboratory measurements, theoretical and a priori data. Introduction of joint scanning of Т and speed low-cost detailisation of “in-field” investigations does possible to use a magnetic field data not as a source of anomalies, and as a way of studying of all geological environment As an example, we will present results of researches of one exposure of Ukraine shield in Soutern Bough River. The practice result of a new Method consist in her ability to exacting and addition of magnetic-field and geologic magnetic-differentiates maps.
Keywords:
Magnetic Susceptibility, Remanent Magnetization, Magnetic Field, Factor of Kenigsberger, Amphibolites Complex, Granolithic Complex
1. Introduction
As a rule, the geological magnetic investigations are carried out by selection of rock (ground) simples and laboratory analysis[1]. For example, the anisotropy of magnetic susceptibility[2] measurement in variable fields, termomagmetic measurements, are used in modern practice. Observation of the magnetic field are used standard aero-ore cur- survey method[3]. In now is populate observation magnetic field on cosmically sputniks[4]. Detail magnetic investigation used for archeology or ore resources in[10,8]. Palaeomagnetic and anisotropy of magnetic susceptibility (AMS) studies were carried out on a orogenic gold deposit in Jokisivu (Finland): the aim of the studies was to test the capability of palaeomagnetic and AMS methods to provide relative age constraints about the structurally controlled gold formation processes[14]. Model studies of gravity and magnetic data are used in conjunction with rock property data and geologic control to investigate geologic structure at depth in the poorly exposed internal zone of the Paleoproterozoic Penokean Orogen (Minnesota) [15].In some cases, the combination of magnetic methods and map modelling is used. Authors of[13] proposes the analysis of surface data, including a digital elevation model (DEM), Landsat Enhanced Thematic Mapper Plus images, and geologic maps, was combined with subsurface data, including well logs and magnetic data.So, the most part of magnetic investigations includes separately selection process “in situ” (on the field) and laboratory researches - there are two separate operations. It does impossible search of existing correlations of magnetic properties of rocks with their geological characteristics that so are necessary for mapping. But investigation of precambrian formations and complex high-metamorfized objects requires the new methods. Precambrian formations characterized intensive “strike” abnormal magnetic field anomalies, related to the oldest formations of the Earth, presented in different hypsometric cuts on all Earth[9]. The understanding of geological structure of region with such differentiated basement structure requires detailed studies of small geological bodies. Their size might be to small to be resolved by standard geological survey, but these bodies are magnetic markers of geological structure.In this work the new complexing detalisated method of petromagnetic investigations is described. Method of magnetic scanning (MMS) let use a new possibilities of mapping for high-differenciated sectors of precamdrian basement.
2. Methods
Magnetic Scanning[6] – it is a complex petro-magnetic method of detail investigation of rocks exposures. In this method, laboratoric and “in field” magnetometric investigations are carried out in direct interrelation with each other, whenever possible by one collective of geologists- geophysicists. At the first stage basic materials are analyzed, and obvious disagreement or correlations “magnetic field- geological structure” appears. Thus, development of the basic actual directions of researches in the given territory is spent. At the second stage, magnetometric investigations “in field” are carried out. Their difference from standard methods[5] consists in the following.1. The interconnected simultaneous field scanning of magnetic field Т and magnetic susceptibility χ (consecutive continuous reading of the magnetic information modern magnitomethers[11] and χ-meters[12]) is carried out.2. As a result of measurements, in agreement with aprioristic data, places for specifying field shootings Т and χ and places of sampling for laboratory analyses are defined.3. The obtained data is interpreted in a complex and with the account of aprioristic data.In the offered method new matters are:- Introduction in practice of field works of joint scanning of Т and χ;- Speed and low-cost detailisation of “in-field” investigations. It does possible to use a magnetic field data (and other magnetic properties) not as a source of anomalies, and as a way of studying of all geological environment;- Use in full of complexing at performance of field and laboratory works, and at interpretation of the received results in system with the aprioristic data.Scanning of magnetic field by new method gives the chance to use the high-frequency fluctuations of curves Т (rejected earlier as "noise") for the analysis of distribution of magnetic minerals in surface layer of exposure. χ-metric and laboratory studying specify a picture and real character of behaviour of magnetic fraction in rock. The resulting of MS in new geointhormation system be used [7]. Also, the method of comparative magnetic analysis is developed. He consists in comparison of several profiles of geophysic areas by visual and magnetic characteristics (see tab.1).| Таble 1. Scheme of use of comparative magnetic analysis (CMA) |
| | Received data | Аpriori data | True or false for attended ratio among geological areas | | Corresponding of fragments of T-curve | Corresponding of geological data on different areas | | Similar | Similar | Similar (?) | | Similar | Not Similar | Similar (?) | | Not Similar | Similar | Not Similar (?) | | Not Similar | Not Similar | Not Similar (?) |
|
|
In case of high similarity by form of fragments of detailed T-curves can intuitive accept the structural-geological similarity of corresponding domen (in area of scanned profiles). This thesis is argumented in next way: detalization of T-curve individualize him and his form can identificate structural-geological formation of rock in scanned area.
3. Results
There are two examples of CMA demonstration. On area of South Bug river (among villages Salenci and Samchenci) the aprioristic data (maps, archives) shows a complete petrographical formation of basement. The coast-river areas are well rocked, but not described by geological scanning. In addition, the maps analysis let tell about weak corresponding of geological and magnetic maps. For example, on the map (fig.1a) the crystalline-rocks massive is imaged not reality because of the strong different volumes have magnetic field takes place. According to MS, as first the kappametry of rocks and T-scanning (by profiles VG in right coast and AВ in left coast) were carried out. After analysis of received data, the sites of additive investigations (field measurements, accumulation of patterns) were definited.Analysis of similarity of domens VG and АМ consisted in using of CMA to curve T on VG and on АМ. The similarity obviously is present for fragments PG і В’G’, and all other fragments are visually not-similar. Not-similarity of corresponding geological fragments were confirmed by investigations of rocks (fig.2).Subscriptions: a) 1 - applite-pegmatoidal granites; 2 – schists and gneiss; 4,5,6 –zero-, positive and negative isolines of anomally magnetic field; b) 1 -applite-pegmatoidal granites; 2 – schists and gneiss with low magnetic properties; 4 – schists and gneiss with high magnetic properties; 5,6,7 - zero-, positive and negative isolines of anomally magnetic field | Figure 1. a) Fragment of the map of anomally magnetic field 1:25000 (iso-lines in nTl) with shapes of geological bodies (according with [1]); b) changed map after magnetic scanning |
When come to interval V’G’, the volumes of T increases rapidly to 51200 nTl but it is smallest on 1000 nTl then on the second coast; curve T on interval V’G’ have shape like to interval PG. Both curves falls similarly, they have same angle of decline of curve and length of are falling similarly ΔТright=ΔТleft=2400 nТl (fig.2). In addition, the similarity of magnetic susceptibility on both coasts is registered in this zone. All their facts let confirm that on PG and V’G’ takes place upcoming transition band of schists bodies from right coast to left. It means that schists and gneisses bodies upcomes by his small part V’G’, according to image in fig. 1b. | Figure 2. Fragments of the curves of magnetic field induction T along the river South Bough in both coasts. Grease bands mark intervals for exposures of rocks |
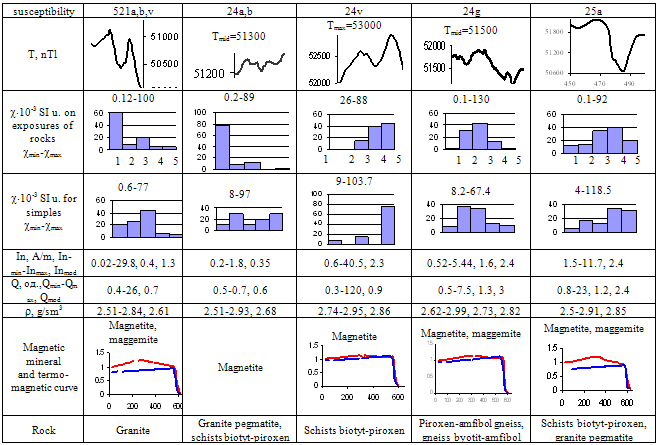
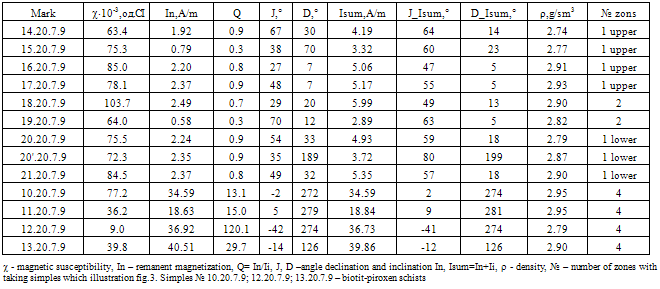
Extremely high T (> 52,500 nT) is traceable to the range of 20 m. As shown in table 2 and fig.3 (magnetic susceptibility in situ) almost 80% of rocks belong to the medium and high magnetic types, for which 40 <χ < 100•10-3 SI u., which is a unique case for this area. And the results of field kappametric and the results of laboratory samples are not recorded significant number slabomahnitnyh breeds, although they are dominant in neighboring outcrops. (As Table 4.6 shows that the samples selected from outcrop 24v clearly divided into two groups: Group number 1 (for samples numbered from 1 to 9) and group number 2 (№ № 10-13). For samples of group number 1 are observed values In within 0,5-2,5 A/m and magnetic susceptibility of 60 <χ <110•10-3 SI u. Thanks In orientation towards the modern geomagnetic field Isum is high. So samples of group number 1 have slightly higher magnetic characteristics in relation to other species common in the area of research. Respect to group number 1 group number 2 is abnormally high In: 18-40 A / m, for samples of this group χ is lower relative χ group sample number 1 (9-40 •10-3 SI u., except for sample 10.20.7.9). Orientation In the first group of samples is inclined (fig.4). According to the results of mineralogical analysis of thin sections the first group is represented by schists biotyt-piroxen, and somewhat tektonization. Thermomagnetic analysis showed the presence of magnetite with Curie temperature of 580℃ and traces maggemite. Samples of the second group were for mineralogical analysis schists too, but with a lesser density.Таble 2. Card of 24а,b, 24v, 24g
 |
| |
|
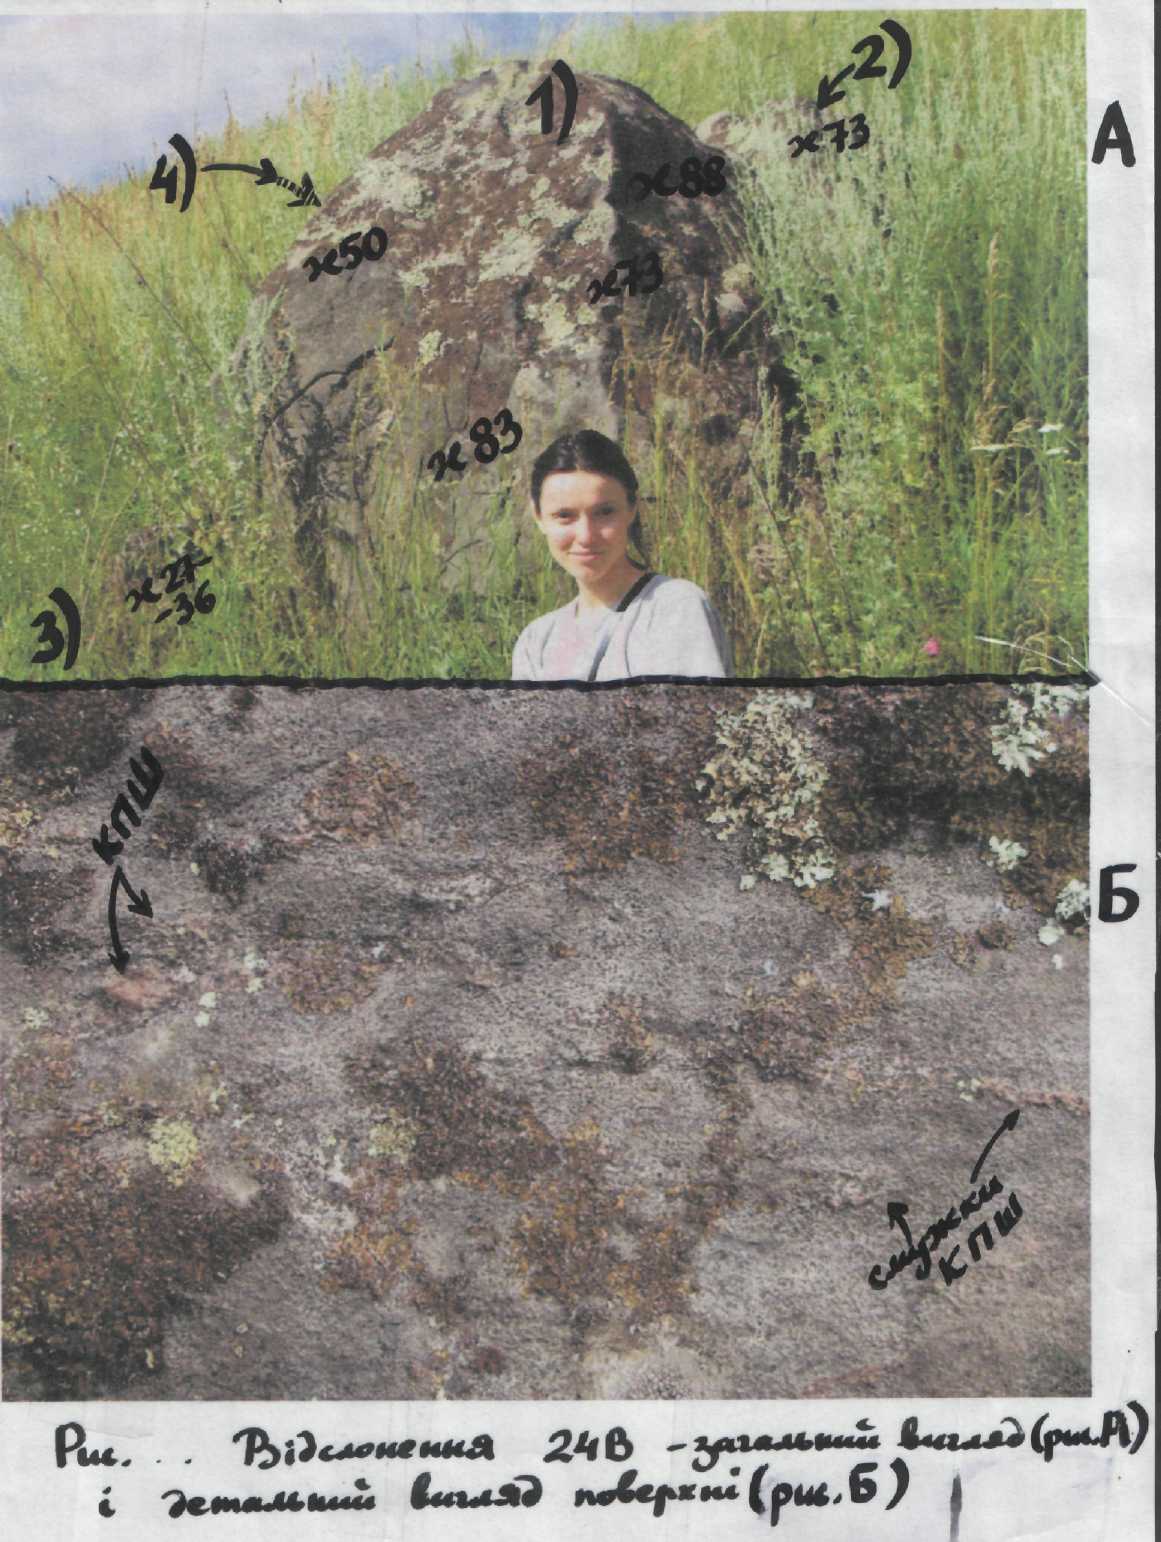 | Figure 3. Photography of exposures of rocks 24b (A - on cite exposures of rocks 24b, B – textures of rocks on 24b) and volumes magnetic susceptibility (χ•10-3 од. СІ). Numbers it is zones wear taking simples |
Analysis of aprioristic or received by magnetic scanning data shows that body of xenolyte (from schists and gneisses) is exposed from two coasts or river. This body is to cut by river on interval VG (right coast) and smallest interval V’G’ (left coast, fig.1).The next example of successful exploitation of method MS is related to territory among village Samchinzi and village Raygorod in left coast of river. Here, the curve T have obviously similar fragments ІК and І’К’ in both coasts of river (fig.5). This similarity causes about similarity of corresponding geological bodies. But this fact do not correlate with traditional geological map of investigated territory. The similarity have a “parallel” type (fragments ІК = І’К’ by parallel transfer), i.e. profile of T-scanning cut two geological bodies with parallel-similar structure in fragments ІК and І’К’. | Figure 4. Stereoprojection of remanent magnetization vectors on the low нижню півсферу (black orientation In on the lower півсферу, and наоборот) simples on 24b |
Perpendicularly to their cuts on the maps of abnormal magnetic field are prolongated anomalies >700 nTl (fig. 6). Two of their areas, pint by nord-west prolongated izo-lines of magnetic field, are ≈ parallelic one to one. Presentated analysis of T-map and similarity of forms and items of T in fragments І-К and І’-К’ let conclude: in pre-cambrian basement are formed two geo-bodies that are very similar by magnetic structure prolongated in nord-west orientation (fig.6b).Таble 3. Results measurement on LAM-24 simples rocks teaks with exposures of rocks 24b
 |
| |
|
 | Figure 5. Fragment of T-curve along the river South Bough (verbs are corresponding to route of scanning) |
 | Figure 6. Fragment of суміщеної map of abnormal magnetic field (1:25000, isolines are measured in nTl) and geological map [1]; b) structure of the basement with corrections according results of MS. 1 - granodiorites; 2 – applite-pegmatoidal granites; 3 – diorites; 4 – plagiogranites; 5) migmatites; 6) +-isolines of abnormal magnetic field; 7 – isoline of Bouget; 5 - granodiorites; 6 –diorites; 7 – aplit-pegmatit; 8 – granites; 9 - plgiogranites 10 – migmatites; 2 -4 -isoline of abnormal magnetic; 1 – isoline of Bouget-anomalie |
4. Conclusions
Due to detalization of measurements and synchronization of χ- and T-scanning, the possibility of real imagination of magnetic field sources appears. The complex computerizing analysis of in sitг and laboratoric magnetometry let investigate the magnetic markers for next analysis of problem geological zones and correction of geological maps.
References
| [1] | Collinson D. W., Methods in Rock Magnetism and Palaeomagnetism, Chapman and Hall, London, 1983, pp.503 |
| [2] | Hrouda, F. Determination of field-independent and field-dependent components anisotropy of susceptibility through standard AMS measurement in variable low fields I: Theory. Tectonophysics.V.466.2009.pp.114-122. |
| [3] | Instruction of magnitometrics. Survey magnetic field. St. Petersburg. 1981, 3 toms. |
| [4] | Rotanova N. M., Tsvetkov Yu. P., Odintsov V. I., Burtseva E. A. Magnetic Scanning of the Earth's Crust in Siberia from a stratospheric Aerostat Journal Mapping Sciences & Rвemote Sensing Volume 39, Number 2 / April-June 2002 pp. 93-107 |
| [5] | Hmelevskoi V.K. Geophysical methods investigation Earth 1997 http://www.astronet.ru/db/msg/1173309/page11.html#3 |
| [6] | Reshetnyk M. Magnetic scanning the Precambrian basement (on the Ukrainian shield example).// Abstract 1st Students International Geological Conference. – Krakow, Geological association, 2010. – p.40-41. |
| [7] | Kirpicheva E Y Solving the geo-prediction problems on the basis of bank of expert knowledge about of search features of standard objects// Systems analysis in science and education "Issue № 4, 2009. з.34-40 |
| [8] | Khesin B. Mineral Resources southern Israel // http://www.elektron2000.com/khesin_0152.html |
| [9] | M.J. van Kranendonk, R.H.Smithies, V.C.Benneth. Earth`s Oldest Rocks. // ELSEVIER, 2007. – chapter 4.4. |
| [10] | http://www.archaeological-surveys.co.uk |
| [11] | http://www.magnetometer.ru |
| [12] | www.terraplus.ca Magnetic Susceptibility Meter |
| [13] | Saadi, N.M. Aboud, E. Watanabe, K. Integration of DEM, ETM+, Geologic, and Magnetic Data for Geological Investigations in the Jifara Plain, Libya. // Geoscience and Remote Sensing, - 10. 2009. – V.47, Iss.10. –P. 3389 – 3398 |
| [14] | S.Mertaneni, Fr.Karelli. Rock magnetic investigations constraining relative timing for gold deposits in Finland.// Bulletin of the Geological Society of Finland, Vol. 83, 2011, pp 75–94 |
| [15] | V.W.Chandler, M.A.Jirsa. A G, T.J.Boerboom. A Gravity and Magnetic Investigation of East-Central Minnesota: Insigths into the Structure and Evolution of the Paleoproterozoic Penokean Odogen. /Univ.of Minnesota, St-Paul, 2008. |
 Abstract
 Reference
 Full-Text PDF
 Full-Text HTML