-
Paper Information
- Previous Paper
- Paper Submission
-
Journal Information
- About This Journal
- Editorial Board
- Current Issue
- Archive
- Author Guidelines
- Contact Us
Geosciences
p-ISSN: 2163-1697 e-ISSN: 2163-1719
2012; 2(2): 25-32
doi: 10.5923/j.geo.20120202.04
Long-Term Seismic Hazard Analysis in Northeast Himalaya and Its Adjoining Regions
 Abstract
 Reference
 Full-Text PDF
 Full-Text HTML
D. Shanker 1, A. Panthi 2, H. N. Singh 3
1Department of Earthquake Engineering, Indian Institute of Technology Roorkee, Roorkee-247667, Uttarakhand India
22Department of physics, Butwal Multiple Campus, Tribhuvan University, Butwal, Nepal
3Department of Geophysics, Banaras Hindu University, Varanasi, 221 005, India
Correspondence to: D. Shanker , Department of Earthquake Engineering, Indian Institute of Technology Roorkee, Roorkee-247667, Uttarakhand India.
| Email: |  |
Copyright © 2012 Scientific & Academic Publishing. All Rights Reserved.
Northeast Himalaya and its adjoining region India, has been delineated into nineteen seismogenic sources on the basis of certain seismological and criteria for the estimation of repeat times of earthquakes, to apply a regional time- and magnitude-predictable model for all these sources to study the future seismic hazard. For this, published earthquake data since 1906 to 2008 from different available earthquake catalogues and books have been used. Considering the inter-event time between successive mainshocks, the following two predictive relations were computed: logTt = 0.01 Mmin + 0.22 Mp - 0.05 log m0 + 0.98 and Mf = 0.89 Mmin – 0.26 Mp + 0.29 log m0 - 5. Multiple correlation coefficient and standard deviation have been calculated as 0.50 and 0.26, respectively for the first relation and 0.75 and 0.41, respectively for the second relation. The positive dependence of Tt on Mp indicates the validity of time predictable model on the area considered in this study.on the basis of these relations and using the magnitude and time of occurrence of the last mainshocks in each seismogenic source, time dependent conditional probabilities of the next mainshocks and their occurrence during the next 10, 20 and 30 years as well as the magnitude of the expected main shocks are forecast.
Keywords: recurrence time, inter-event time, time- and magnitude-predictable model, Northeast Himalaya
Article Outline
1. Introduction
- An earthquake hazards programme requires chiefly three parameters to evaluate i.e. magnitude, time of occurrence and the location of the epicenter/ focal depth related to an earthquake. Delineating a potential zone and predicting future seismic hazards in a region help taking appropriate measures in such eventuality and necessary mitigation measures to minimize the destructive effects caused by an earthquake. Fore-warning of earthquake related activities in a region help minimize resulting destructions up to some extent and can save lives. Such an action eventually provide an opportunity for taking appropriate measures for future planning and policy making in the potential zone. Several attempts have been made during the last five decades to understand the tectonic processes that cause the earthquakes and their association with the precursory activities that have some causative relationship with forthcoming earthquake ((Mogi, 1969; Evison, 1977; Habermann, 1981; Shanker et al., 1995). These findings have helped developing several new earthquake generation seismicity models (like “time predictable” recurrence model formulated by Shimazaki and Nakata, 1980) and associated precursory phenomena (seismic and non-seismic) that precede large earthquakes. One pre-requisite requirement of seismic hazards prediction is the identification of seismically potential zone in earthquake prone region. But due to the complex structure of Earth’s interior, it may be difficult to estimate all the required parameters related to a forthcoming earthquake (location, magnitude and time of occurrence) with reasonably good accurate.The earthquake recurrence intervals are the time interval between the largest mainshoks occurred in earthquake prone region. This interval may vary from several decades to several hundred years. If a particular pattern were identified associated with seismic activity in the hypocentral zone and its surrounding after the occurrence of one large earthquake to next earthquake, then it will help for long term- prediction of large earthquake in that region. Earlier different models were proposed for the recurrence of earthquake generation in the past. After long debates and discussions a Regional Time- and Magnitude- Predictable Seismicity Model have been accepted and applied successfully in different seismically active regions to estimate the magnitude and the time of occurrence of forthcoming earthquakes. These models have put forward to Central Himalaya and its vicinity (Paudyal et al., 2009); Eastern Anatolia (Sayil, 2005); Taiwan (Wang, 2005); Hindukush Pamir Himalaya (Shanker and Papadimitriou, 2004); China (Qin et al., 2001); Circum-Pacific belt (Papadimitriou et al., 2001); Greece and Japan (Karakaisis, 2000); Alpine-Himalayan belt (Papazochos et al., 1997); North-east India (Shanker and Singh, 1996); Indonesian region (Papadimitriou and Papazachos, 1994); the Aegean area (Papazachos and Papaioannou, 1993); New Guinea–Bismark sea region (Karakaisis,1993); the Western coast of the South and the Central America (Papadimitriou, 1993); Greece (Papazachos, 1989); North- East India Himalaya (Panthi et al., 2011) and others. Applicability of the Time- and Magnitude Predictable model has been tested in northeast India Himalaya and its adjoining regions bounded by 20°-32° N and 88°-98° E, and finally evaluate the seismic hazards in the identified seismogenic sources.
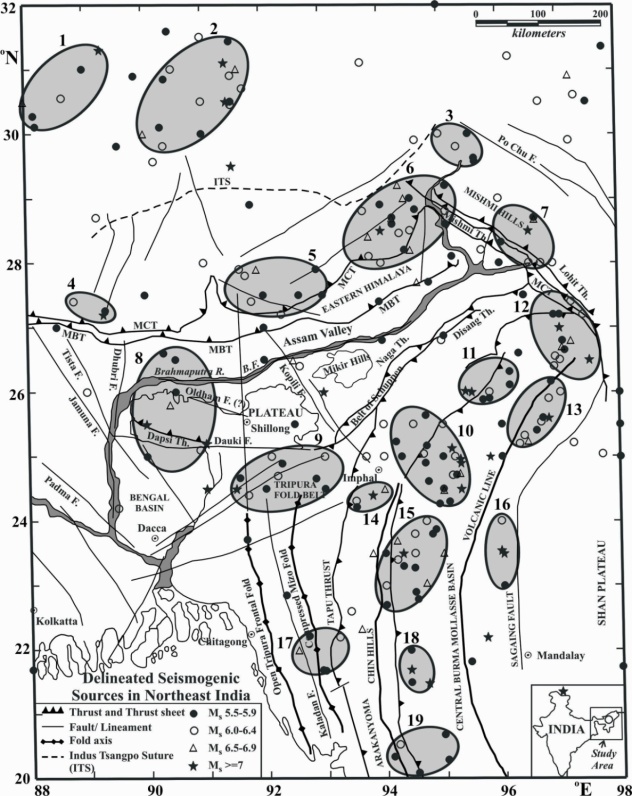 | Figure 1. Spatial distribution of earthquake with Ms ≥ 5.5 occurred during the period 1906-2008 in northeast India Himalaya and its adjoining regions. Using this distribution, 19 seismogenic sources have been delineated in relation to the major tectonic features of the area and are considered to test the validity of Time-and Magnitude Predictable model and to estimate the probability of future seismic hazards in each of the delineated seismogenic sources. The seismogenic sources are enclosed by shaded elliptical areas (Panthi et al., 2011). |
2. Earthquake Data and Seismogenic Sources
- Data set for the area bounded by 20˚-32˚ N and 88˚-98˚ E has been considered to study the long-term earthquake hazard prediction (Panthi et al., 2011). This area covers the Eastern Himalayan belt, adjoining southeastern Tibet and northeast India region including Arakan-yoma fold belt and consists of several mountain peaks, thrust, faults and lineaments. Compilation of the seismicity data base and delineation of the region into seismogenic sources have already been discussed in detail in (Fig 1) (Panthi et al., 2011). One of the basic requirements for determination of prediction relations is the values of a, b, Mmax and log m0 for each seismogenic source zone Table (1).This table shows respectively, the region and code number of each seismogenic source zone as shown in Fig. 1. The a-value and b-values are calculated separately for each seismogenic source zones using the method of least square the value of Mmax is determined with the help of historical and modern dataset for each source.
3. Methodology
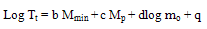
- The groundwork results obtained in their previous work (Panthi et al., 2011) have been used as input data in the present work to extended the work further to determine the seismic hazard in each nineteen seismogenic sources.The relation of repeat time (T) (between two successive mainshocks) with the magnitude of the preceding mainshock, Mp, is represented in the form of
 | (1) |
 | (2) |
 | (3) |
4. Development of Predictive Regressions
- Regression was performed to determine the model parameters (b, c, d, q, B, C, D and m) expressed by relations (2) and (3) using all available data (Table 2). A total of eighty four data sets pertaining to nineteen seismogenic sources of the Northeast India Himalaya and its adjoining regions are used to establish the time and the magnitude predictable relationships as follow:
 | (4) |
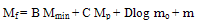
 | Figure 2. (a) Dependence of the repeat time (T*) on the magnitude of the preceding mainshocks (Mp); and (b) dependence of the magnitude of the following mainshock () on the magnitude of the preceding mainshock (Mp) |
 | (5) |
 is computed using the equation
  = Mf - 0.89 Mmin - 0.29 log m0 + 5.5 corresponding to each Mp and a database is generated.The relation between
  and Mp is illustrated in Fig. 2b; where T, Mmin, logmo, and Mp are observed values. The observed negative dependence of the magnitude of the following mainshock on the magnitude of the preceding mainshock indicates that a large mainshock is followed by a small one and vice-versa.The frequency distribution of log (T/Tt), which is fitted by a normal distribution with mean, μ = 0 and standard deviation, σ = 0.26 is shown in Figure 3 shows the validity of the model. The frequency distribution of the difference between the observed magnitude (MF) of the following mainshock and the calculated magnitude (Mf) of the following mainshock, MF -Mf, using the Equation (5) is shown in Fig. 4. This is fitted by a normal distribution curve with μ = 0 and a standard deviation (σ) equal to 0.41.
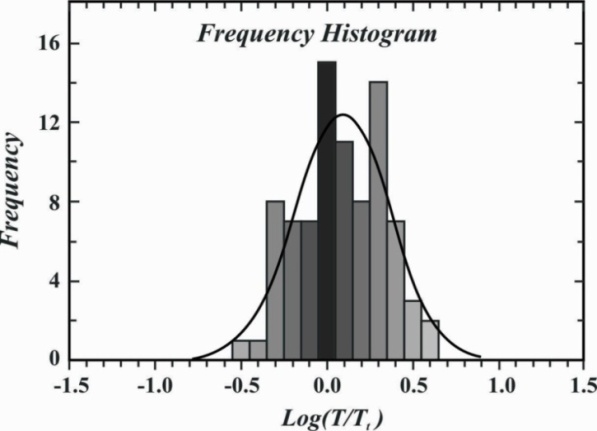 | Figure 3. The frequency distribution of the observed repeat times (T) in relation to theoretically estimated repeat times (Tt) |
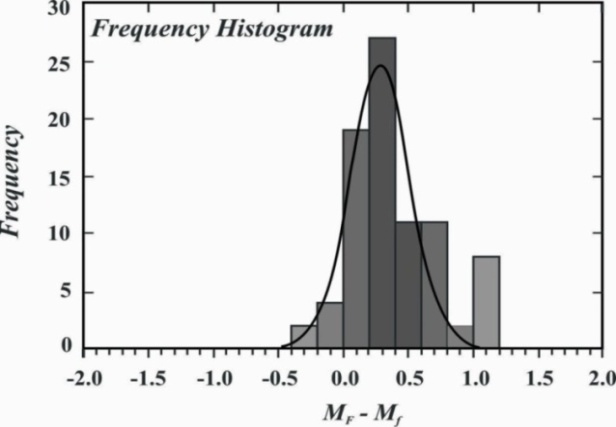 | Figure 4. The frequency distribution of difference in observed and calculated magnitudes (MF- Mf) of the following mainshocks |
5. Long-Term Seismic Hazards Prediction
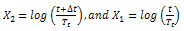
- Generally repeat times of large earthquakes in seismogemic sources or fault is considered for long- term earthquake prediction. The earthquake prediction is important for the estimation of seismic hazards in the earthquake prone regions. Since the Time- and Magnitude- Predictable Model is valid for northeast India region, it is possible to evaluate long- term seismic hazards using data from nineteen delineated seismogenic sources.The developed prediction equation for the considered region as above relation (4) can be used for long- term earthquake prediction. Fig. 2a indicates that there is a significant fluctuation in the observed repeat time, T, and corresponding inter- event time Tt. Owing to this, it is preferred to calculate the conditional probability of next mainshock greater than certain magnitude (e.g. Mmin ≥ 5.5 for the considered region) and for given time interval. It is found that the ratio T/Tt follows the lognormal distribution rather than Gaussian or Weibull distributions (Papazachos, 1988; Papazachos and Papaioannou, 1993). Suppose that this distribution holds true for each seismogenic sources of the region, then the conditional probability, P, can be calculated for the occurrence of mainshocks with M ≥ Mmin during the next Δt years from now (i.e. 2010) when the previous such earthquake with magnitude Mp occurred t years ago from present time (2010), by using the following relation (Papazachos and Papaioannou, 1993):
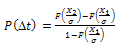 | (6) |
 F is the complementary cumulative value of the normal distribution with the mean equal to zero and σ is the standard deviation of the above equation. Given the date and the magnitude of the last event in a seismogenic source along with the uncertainty of the model expressed by its standard deviation σ = 0.26, the probabilities of the occurrence of the next shallow main shocks with Ms ≥ 5.5 during the next 10, 20 and 30 years were computed and furnished in Table 3 along with the magnitude of the expected large shallow earthquakes based on the model defined in Equations (4) and (5). In Table 3, the second column gives the name of the seismogenic source and the third column the magnitude of the expected main shock, Mf, as used in Equation (5). The next three columns provide the corresponding probabilities of occurrences which were calculated for the magnitudes of large mainshocks in the next three decadal periods: 2010- 2019, 2010–2029 and 2010-2039. The results show significantly high probabilities of earthquake occurrences in these seismogenic sources. It is evident that the absolute values of the probabilities change from source to source signifying different characteristics of an individual seismogenic source. The values thus found are of relative importance and may be refined if more sample data are used in the computation.
6. Discussion
- Understanding earthquake generation processes in a region is the key to evaluate future seismic hazards in space and time domains. Presently, the major tools for such evaluation are the systematic analysis of the observed phenomena before and after the earthquakes and use of statistical tools for analysis of seismicity data considering different models with probabilistic approach. Presently, major requirements of the society is the prediction of earthquake related hazards with reasonably high degree of probability which eventually help mitigating expected hazards that would save loss of lives and property. Nonetheless, it is not an easy task to predict precisely the time, magnitude and location associated with future earthquakes with any accuracy, despite many efforts being made worldwide by scientific community. Because of the lack of required density of seismological stations/ instrumentations and technologies, it would be almost impossible to unravel the tectonic processes occurring inside the Earth that eventually trigger the earthquakes. Any wrong prediction of earthquake may pass the wrong message to the public and hence it would be even more hazardous than predicting the seismic hazards. Nevertheless, several researchers are attempting to find suitable earthquake generation models and searching various earthquake precursors for reliable prediction of future seismic hazards in a region.The study of long-term characteristics of the earthquake generation processes in different seismogenic sources is of fundamental importance for the seismic hazard evaluation. The probabilistic analysis for the occurrence of large earthquakes has not yet been attempted so far in the considered region. The present study discusses the application of the time- and magnitude predictable model and estimation of conditional probability for the occurrence of medium to large size next earthquake and associated magnitude in the next three decades in the region; and to appraise the probabilities of occurrence time and the magnitudes of future earthquake (Ms ≥ 5.5) in the 19 delineated seismogenic sources of northeast India Himalaya and its adjoining regions (Table 4). A positive slope between the inter-event time and the magnitude of the preceding earthquake indicates that the larger the magnitude of the earthquakes requires a longer return period and vice-versa. This is because the large earthquake releases the accumulated stress to a minimum level; however, the tectonic loading may remain the same. Contrary to this, a weak and negative dependence of the magnitude of the following mainshocks on the repeat times is observed. With this information, The estimated probabilities for the occurrence of medium to large size earthquakes (Ms 5.3-7.1) during the next three decades (2010-2039) indicates that there are very good likelihood for occurring such mainshocks in each of the delineated sources. The probabilities 0.81, 0.91 and 0.96 is observed for the occurrence of large size earthquakes (M 7.1) in Arakan-yoma region (eastern side close to the Sagaing fault) during the next 10, 20 and 30 years respectively. The conditional probabilities P10 estimated for different sources during the next decade (2010-2019) shows the highest value 1.0 (P10=1.00) in Eastern Syntaxis (source 7) and in Shillong plateau (source 8) whereas it is slightly lower in other regions (0.95≤ P10 ≤0.99).Using the estimated value of conditional probability and the maximum magnitude of the expected earthquake during the period 2010-2019, we observed that there are very high probabilities for the occurrence of moderate to large earthquakes (M 6 -7.1) in Eastern Syntaxis (source No. 07), Himalayan Frontal Arc (Source No. 06) and Arakan-yoma regions (source Nos. 10, 11, 13,14, 16 and 18) as given in Table 4. We have also correlated the focal depths of the events occurred in each of these sources during the considered period and observed that the foci of the expected mainshocks, if they occur within the stipulated period, would lie at shallow depths (up to 60 km) in sources 6, 7, 13, 14 and 16 and at intermediate depths (up to 140 km) in sources 10, 11 and 18. All the intermediate expected mainshocks would be located in the middle portion of the delineated intermediate active zones of Arakan-yoma region. The largest expected mainshock (M 7.1) would be shallow focus and would occur in association with the source 16 located to the eastern side close to the Sagaing fault. In view of the above discussion, we expect eight mainshocks ranging in magnitude M 6 to 7.1 to occur during the period 2010-2019. Occurrence of Sikkim earthquake of September 18, 2011 (predicted magnitude 5.8/occurred 6.8; proximity to source no 4 (27.730N, 88.082E)) and Myanmar-India border earthquake of 4th February, 2011 (predicted magnitude 6.2/occurred 6.4; in source No 10 (24.616°N, 94.740°E)), signify the validity of the model and forecasts. This result enables a tentative seismic hazard assessment in areas where no zonation has ever been attempted. More accurate seismic hazard studies require a detailed zonation based on as much data as possible.
Appendix-1
|
| ||||||||||||||||||||||||||||||||||||||||||||||||||||||||||||||||||||||||||||||||||||||||||||||||||||||||||||||||||||||||||||||||||||||||||||||||||||||||||||||||||||||||||||||||||||||||||||||||
| ||||||||||||||||||||||||||||||||||||||||||||||||||||||||||||||||||||||||||||||||||||||||||
ACKNOWLEDGEMENTS
- Author (DS) is indebted to Prof. & Head Department of Earthquake Engineering for Excellent computational facility. One of the Author (HNS) is grateful to Prof V P Singh and Prof. U S Singh head of Department of Geophysics, Banaras Hindu University, Varanasi India for their continuous inspiration, support and encouragement at every moment in upgrading and organizing the scientific knowledge. Authors are also thankful to one of the anonymous reviewer who helped to improve the text and clarify some vague points.
References
| [1] | Evison, F.F., (1977). Fluctuations of seismicity before major earthquakes. Nature (Lond.) 226, 710–712. |
| [2] | Habermann, R.E., (1981). Precursory seismicity patterns: stalking the mature seismic gap in earthquake prediction—an international review. Maurice Ewing Series 4, AGU Publication, pp. 29–42. |
| [3] | Karakaisis, G. F. (2000). Effect of zonation on the results of the application of the regional time predictable seismicity model in Greece and Japan, Earth Planets Space, 52, 221-228. |
| [4] | Karakaisis, G. F. (1997). Long term earthquake prediction in New Guinea–Bismark sea region based on time and magnitude predictable model, J. Physics of the Earth, 41, 365–389. |
| [5] | Panthi, A., Shankar, D., Singh, H. N., Kumar, A., and Paudyal, H. (2011). Time-predictable model applicability for earthquake occurrence in Northeast India and vicinity, Jour. Nat. Hazards Earth Syst. Sci., 11, 993–1002. |
| [6] | Mogi, K., (1969). Some features of recent seismic activity in and around Japan, activity before and after great earthquakes. Bull. Earthquake Res. Inst., Univ. Tokyo 47, 395–417. |
| [7] | Papadimitriou, E. E., and Papazachos, B. C. (1994). Time dependent seismicity in the Indonesian region. Jour. Geophys. Res., 99, 15387 – 15398. |
| [8] | Papadimitriou, E. E. (1993). Long term earthquake prediction along the western coast of south and Central America based on a time predictable model, Pure and Appl. Geophys., 140, 301-316. |
| [9] | Papadimitriou, E. E., Papazachos, C. B., and Tsapanos, T. M. (2001). Test and application of the time and magnitude predictable model to the intermediate and deep focus earthquakes in the subduction zones of the circum-Pacific belt, Tectonophysics, 330, 45 -68. |
| [10] | Papazachos, B. C. (1992). A time and magnitude predictable model for generation of shallow earthquakes in the Aegean area, Pure and Appl. Geophys., 138, 287-308. |
| [11] | Papazachos, B. C. (1989). A time predictable model for earthquake generation in Greece, Bull. Seismo. Soc. Am., 79, 77-84. |
| [12] | Papazachos, B. C., and Papaioannou, Ch. A. (1993). Long term earthquake prediction in Aegean area based on a time- and magnitude- predictable model, Pure and Appl. Geophys., 140, 593-612. |
| [13] | Papazachos, B. C., Karakaisis, G. F., Papadimitriou, E. E., and Papaioannou, Ch. A. (1997). The regional time- and magnitude predictable model and its application to the Alpine-Himalayan belt, Tectonophysics, 271, 295-323. |
| [14] | Papazachos, B. C. (1988). Long-term earthquake prediction of earthquakes in seismogenic sources of Greece, UN Seminar on prediction of Earthquakes, Lisbon, Portugal, 1-10. |
| [15] | Papazachos, C. B., Papadimitriou, E. E. (1997). Evaluation of the global applicability of the regional time- and magnitude- predictable seismicity model, Bull. Seismo. Soc. Am., 87, 799-808. |
| [16] | Paudyal, H., Shanker, D., Singh H. N., and Singh ,V. P. (2009). Application of time- and magnitude predictable model in the central Himalaya and vicinity for estimation of seismic hazard, Acta Geod. Geoph. Hung., 44 (2), 213–226. |
| [17] | Qin, C., Papadimitriou, E. E., Papazachos, B. C., and Karakaisis, G. F. (2001). Time dependent seismicity in China, J. Asian Earth Sciences, 19, 97-128. |
| [18] | Qin, C., Papadimitriou, E. E., Papazachos, B. C., and Karakaisis, G. F. (1999). On the validity of regional time- and magnitude predictable model in China, Annali Di Geofisica, 42, 939-956. |
| [19] | Sayil, N. (2005). An application of the time- and magnitude- predictable model to long- term earthquake prediction in eastern Anatolia, Jour. Seismology, 9, 367-379. |
| [20] | Shanker, D., and Papadimitriou, E. E. (2004). Regional time- predictable modeling in the Hindukush-Pamir-Himalayas region, Tectonophysics, 390, 129-140. |
| [21] | Shanker, D., and Singh, V. P. (1996). Regional Time- and Magnitude-predictable seismicity model for north-east India and vicinity, Acta Geod. Geoph. Hung., 31 (1-2), 181-190. |
| [22] | Shanker, D., Singh, H.N., Singh, V.P., 1995. Anomalous seismic activity and long-range earthquake prediction in Himachal Pradesh, India. Acta Geod. Geophy. Hung. 30 (2–4), 379–395. |
| [23] | Shimazaki, K., and Nakata, T. (1980). Time-predictable recurrence model or large earthquakes, Geophys. Res. Lett., 7, 279-282. |
| [24] | Wang, J. H. (2005). Earthquake rupturing the Chelungpu faultin Taiwan are time predictable, Geophys. Res. Lett., 32, L06316, doi: 1029/2004GL021884. |