-
Paper Information
- Previous Paper
- Paper Submission
-
Journal Information
- About This Journal
- Editorial Board
- Current Issue
- Archive
- Author Guidelines
- Contact Us
Geosciences
p-ISSN: 2163-1697 e-ISSN: 2163-1719
2012; 2(2): 14-24
doi: 10.5923/j.geo.20120202.03
Variation of Focal Parameters and Medium Characteristics During Small Earthquakes
1Shanghai Earthquake Administration, Shanghai, China, 200062
2Department of Mechanical Engineering University of Louisiana, Lafayette, LA70504, USA
Correspondence to: Yucheng Liu , Department of Mechanical Engineering University of Louisiana, Lafayette, LA70504, USA.
| Email: |  |
Copyright © 2012 Scientific & Academic Publishing. All Rights Reserved.
In earthquake prediction, strong earthquakes are usually preceded by a series of small earthquakes. Thus, correct identification of those small earthquakes characteristics tell precursor observations and will lead to accurate prediction and judgement of impending main shocks. This paper discusses seismic source dynamic parameters, medium and rupture characteristics, and their variations during small earthquakes. Focal mechanism and its variation before and after main shock are also demonstrated along with several seismic examples to summarize the change of rupture characteristics (primary rupture direction, ambient shear stress, and waveform’s temporal) and periodicity during small and medium earthquakes.
Keywords: focal mechanism, seismic source parameters, medium characteristics, rupture characteristics, small and medium earthquakes
Article Outline
1. Introduction
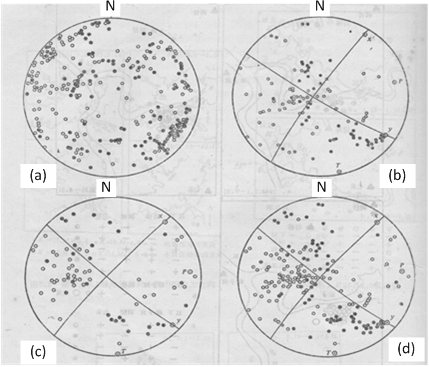
- After Tangshan earthquake, Hua[1] used all first motion data of P wave occurred within 360 km from its epicenter to make comprehensive focal plane mechanism. This data was recorded by Baijiatuan (since 1958) and Beianhe (since 1975) observatories. It was found that the mechanism could not be solved during 1958 to 1971 because the contradiction ratio ψ reached 40%. After 1972, ψ went down to below 20% and it was found the P axis of the average major compressive stress aligned with the P axis of the later Tangshang M7.8 earthquake. After Tangshan earthquake, ψ came back to 40% and the distribution of initial motion of small earthquakes became irregular (Fig. 1). Xu et al. [3] divided the area N38° ~ 41°, E114° ~ 120° into three regions and determined the average direction of the P axis from the comprehensive focal plan mechanism and using initial motion smoothing method, separately. The obtained P axis direction was consistent with Hua’s results. The variation of the contradiction ratio before and after the Tangshan earthquake can also be clearly seen from the focal plane mechanism made based on the P wave’s initial motion data recorded by Changli observatory (Fig. 2).It was indicated by numerous previous earthquake examples that in several years before the destructive earthquake, the directions of major compressive stress axes (P axes) of small and micro earthquakes occurred within the later destructive earthquake would become consistent, which were close to the P axis direction of that destructive earthquake and the direction of regional stress field. During that time the contradiction ratio evidently decreased. It was even found that the larger area in which the directions of P axes were consistent, the higher magnitude the future earthquake may have. This conclusion is an effective method in earthquake prediction. In order to explain this problem, the focal mechanism should be understood as a stress field released during earthquakes, which is the focal stress field. It is not a regional stress field and depends on the tectonic structures of the regional stress field and the local area of the hypocenter. The distribution of direction of faults can be considered as regular from the view of a large scale (> 10 km). Therefore, the strong earthquakes, which are caused by large rupture activities, have reliable and regular focal mechanisms which are consistent with the local stress field. However, from a small scale (< 100 m), small crevices with different directions and rate of movement spread over the entire area and inhomogeneous of the tectonics become prominent. Thus, the directions of P axes of small and micro earthquakes are generally disorganized. If the local stress field intensifies at some time, two conjugate small crevices in a certain area will be easy to rupture and the crevices with other directions will not. The directions of P axes of small and micro earthquakes become consistent. A large area in which those directions are consistent means a strong local stress field and a wider control range, and the future earthquakes occurring in that area will have higher magnitudes.As found by seismologists of former Soviet Union, in Garm and other regions of middle Asia, the directions of P axes of small and micro earthquakes turned to be consistent from disorder within one and half to two years before the occurrence of medium and strong earthquakes. Moreover, those directions turned to 90º at two months or a little bit longer before the main shock[3-5]. Such phenomena were also observed in China. For example, before the Songpan earthquake, the nodal plane solution of Songpan station showed that the directions of P axes started to turn from EW direction to NS direction at end of 1974. Moreover, the nodal plane solution of Gangu station indicated that, from the beginning of 1971, the directions of P axes turned to be along NS direction from disorder status and those directions had been switching to EW direction from the beginning of 1974 till the occurrence of Songpan earthquake.
|
2. Seismic Source Dynamic Parameters
- Zhu et al.[8] investigated the stress drop Δσ and focal radius a of micro earthquakes (ML1.5 ~ 2.9) occurred from Apr-2-1971 to Feb-14-1977 (before and after the Tangshan earthquake) using spherical explosive source model (section 3.3.3.2). They found that before the ML7.8 Tangshan earthquake, Δσ of small earthquakes occurred in the region of Ninghe-Tangshan-Luanxianwere comparatively high and had an average value 22 bar. After the main shock, that average value dropped to 12 bar, however, a small earthquake occurred near Ninghe and two small earthquakes occurred at north to Luanxian still had high Δσ values. Soon after, two strong aftershocks with M6.9 and M6.0 occurred in these two areas. It was also found that the average focal radius of those small earthquakes before the Tangshan earthquake was 40m, which increased to 49m after it.Lin et al.[9] studied Δσ and a of partial ML1.5 ~ 2.9earthquakes occurred from May-25-1970 to Jun-25-1977 in the areas of Tangshan-Fengnan-Ninghe-Tianzhuang using circular shear dislocation model (section 3.3.1). It was found that the average Δσ was 2.3 bar before the Tangshan earthquake and the value dropped to 0.2 ~ 0.3 bar after it. The average focal radius (a) was 490m before that earthquake and the radius became 540m after the main shock.Such phenomena were also found from the small earthquakes occurred before and after the Haicheng earthquake: Δσ of small earthquakes before the main shock are higher than Δσ of those after the main shock; focal sizes of small earthquakes before the main shock are lower than those after the main shock; the distribution area of such earthquakes is by and large consistent with the aftershock area. However, other researchers found that there were not obvious variations before and after the Haicheng earthquake in Δσ and focal size[10]. Even worse, different results were obtained by different researchers who studied the same earthquake using same focal source model (see section 1.3.1). Tsujiura [11] and Bakun[12] studied foreshock sequences of several earthquakes occurred in Japan and United States, and found different results in comparing Δσ of the foreshocks to that of the main shock.Chen et al. introduced rupture mechanics into the determination of the focal dynamic parameters[13] and studied the variation of ambient shear stress (τ0) before and after Tangshan earthquake[14]. It was concluded by them that the τ0 is higher before the main shock and lower after it. This conclusion is well accepted in China.τ0 is basically the same as Δσ. In physics, Δσis the difference of focal stresses before and after the shock. From the view of rupture mechanics, after the earthquake, the focal medium entirely broke so that the stress is zero. In this case, Δσequals the focal stress before the earthquake. Also, by using the cracks (type II) of a 2D plane strain as the seismic rupture model, the focal stress before the earthquake Δσ is the preseismic ambient share stress τ0. In determining Δσ, the first step is to obtain seismic moment and focal radius in the frequency or time domain based on the circular shear dislocation model. Next, Δσ along with the average and maximum dislocation can be calculated from elasticity using the following equations
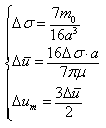 | (1) |
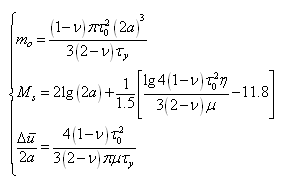 | (2) |
3. Variation of Characteristics of Media
- Variation of Q value before medium and strong earthquakesThe quality factor of medium, Q, is a dimentionless parameter that describes the seismic wave absorption capability of the medium. A medium with excellent integrity will absorb less seismic waves, and therefore has a high Q value, which can be used to predict future earthquake tendency in three ways. (1). Q can be applied in creating seismic ground motion parameter zonation map and used for long-term prediction. In the areas with high Q values, the expected maximum magnitude of its potential hypocenters will be high; otherwise, the maximum magnitude will be low. Fig. 2a shows the distribution of the Q value in Shanghai and vicinity and Fig. 2b displays the distribution of potential seismic sources. By comparing the two figures, it can be found that the distributions are consistent with each other[15].
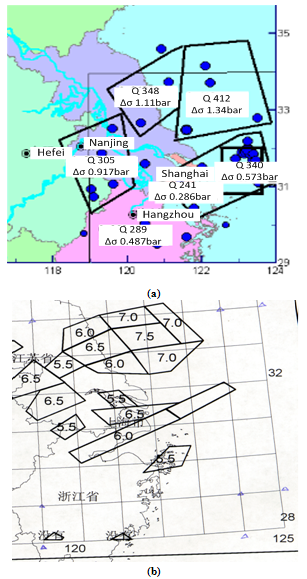 | Figure 2. Distribution of (a) Q value and (b) potential seismic sources in Shanghai and vicinity |
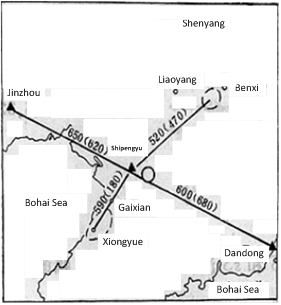 | Figure 3. Distribution of Q values before and after Haicheng earthquake |
3.1. Microtremor
- If the enlargement factor of a seismograph is turned higher, regular, periodic vibrations will be shown on the seismogram even without earthquake. Such vibrations whose period ranges from 0.1 second to several minutes are called microtremor. In order to acquire a higher enlargement factor while not to affect the seismic record, the enlargement factor is usually set to a level that the double amplitude of the induced microtremor will not exceed 1 mm. Abnormal microtremor was found before a number of strong earthquakes, which has drawn a lot of attention.For example, the abnormal microstremor was detected before the Haicheng earthquake[16]. The daily amplitude of microtremor was determined following below steps. Three maximum amplitudes were selected in 10 minutes before and after 12:00 am and 12:00 pm that day, separately. Two average values were calculated which represented the amplitudes at 12:00 am and 12:00 pm, the average value of the two average amplitudes is the daily amplitude of microtremor. As shown in Fig. 4, the amplitude of South-North microtremor recorded by short period seismograph of Shipengyu seismic station, which is 20 km from the epicenter, decreased in two days before the Haicheng earthquake. That value slightly increased at 10 hours before the main shock. Similar variation was also observed from the records of Dandong station, which is 100 km from the epicenter. The amplitudes of microtremor recorded by other local stations did not show evident variation.As found by Zhu[18], before the Tangshan earthquake, the amplitude of microtremor recorded by Changli station, which was 80 km from the epicenter, dramatically decreased (Fig. 5). The decreasing of the microtremor’s amplitude in a short period was also detected before several strong aftershocks. However, no obvious variation in such amplitude was observed from distant observatories.
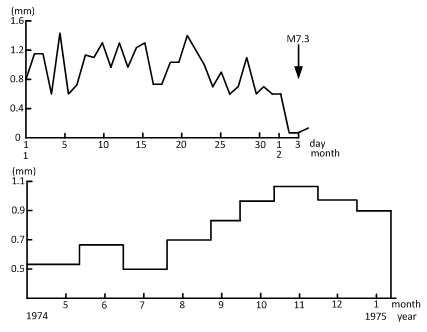 | Figure 4. Amplitude of microtremor recorded by Shipengyu station |
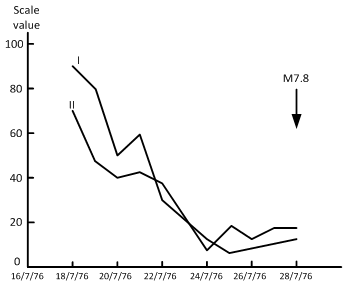 | Figure 5. Amplitude of microtremor recorded by Changli station |
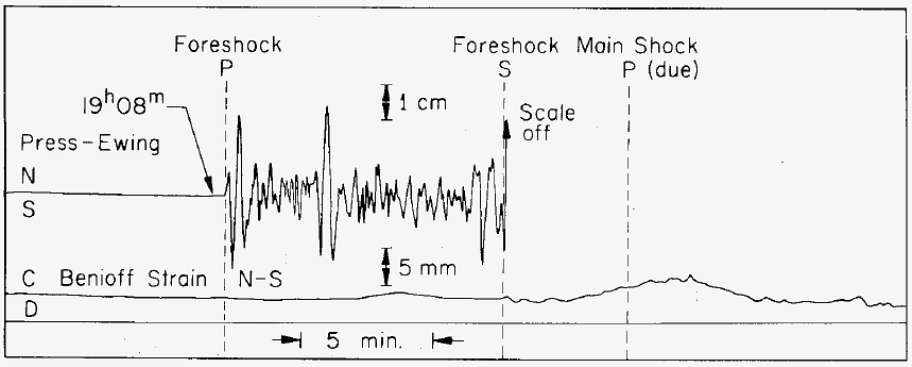 | Figure 6. Blow-up of the precursor on the strain seismogram, the Press- Ewing seismogram is shown for comparison |
4. Epicentral Rupture Characteristics
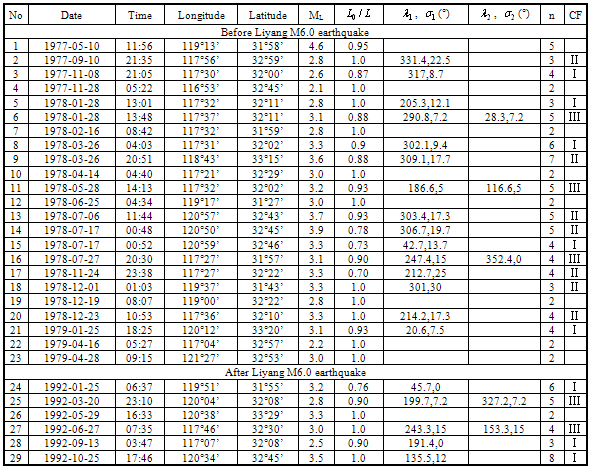
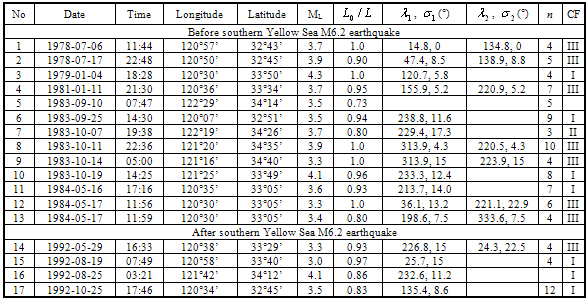
- Assuming an earthquake with nonsymmetric bilateral rupture and the rupture lengths for the two sides are L0 (for primary rupture with long side) and Lπ (for secondary rupture with short side). Major epicentral rupture characteristics include the direction of the primary rupture L0 and the ratio of the length of the primary rupture and the total length of the rupture L0/L, where L = L0 + Lπ. The value L0/L varies between 0.5 and 1, where 0.5 indicates a symmetric bilateral rupture, and 1 means a unilateral rupture. Detailed methods of calculating that ratio will be introduced in a separate paper. Width of Fourier spectrum (w) is defined as the bandwidth which is 70% of the maximum spectral amplitude. w represents the complexity of seismic waves. The wider w is, the more frequency the seismic wave has, the more complicated the rupture process should be, and therefore the more unevenly the epicentral medium and stress are distributed.Liu et al.[21,22] studied four earthquakes with magnitude around M6.0 which occurred in southeastern China since 1970. Those earthquakes are: M6.0 Liyang earthquake July 9, 1979; M5.9 Heze earthquake November 7, 1983; M6.2 southern Yellow Sea earthquake May 21, 1984; and M6.1 and M6.2 northern Gulf earthquakes December 31, 1994 and January 10, 1995, respectively. In studying those earthquakes, six seismic wave parameters were investigated using seismic wave method, error estimations were also discussed. Those parameters are: rupture characteristics (L0/L), primary rupture directions, ambient shear stress τ, temporal periodicity of waveform r, Q values for P waves, and the width of Fourier spectrum w. In their study, the characteristics seismic wave parameters of abnormal earthquakes occurred on seismic gap and belt were studied to define the single foreshock in order to reveal the radiation of the seismic wave of the single foreshock, which is difficult to be identified before the main shock by using traditional seismic activity method. Through their investigation, following conclusions were obtained.(1) The primary rupture directions of earthquakes occur on seismogenic zones are parallel to the coming main shock’s nodal plane and they either are tangent to the zone or point outside the zone. However, during the normal periods, the primary rupture directions are disorganized. Let’s use the Liyang M6.0 earthquake as an example. Table 3 lists the calculated results of rupture characteristics of medium and small earthquakes that occurred before and after the main shock. In that table, λ and σ denote the azimuth of the primary rupture directions and its root-mean-square error (RMSE), respectively. If distribution of the local seismic stations was not ideal, three or more possible primary rupture directions could be found. λ and σ values were not selected for such cases. n is the number of seismic observatories. Certainty factor (CF) of the primary rupture direction was defined as: CF = I when
 ≤ 15° and only one primary rupture direction was determined; CF = II when 15° <
  ≤ 30° and only one primary rupture direction was determined; CF = III when two possible primary directions were found.
|
|
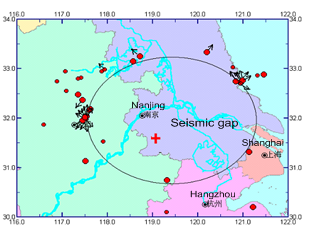 | Figure 7. Primary rupture direction of small and medium earthquakes on the seismogeniczone of Liyang M6.0 earthquake |
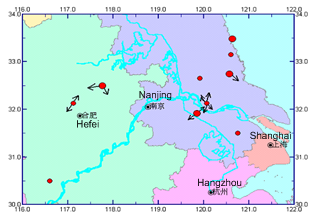 | Figure 8. Primary rupture direction of small and medium earthquakes that occurred during normal periods in Liyang area |
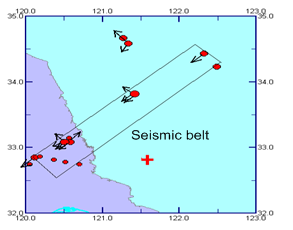 | Figure 9. Primary rupture direction of small and medium earthquakes occurred on the seismic beltbefore southern Yellow Sea M6.2 earthquake |
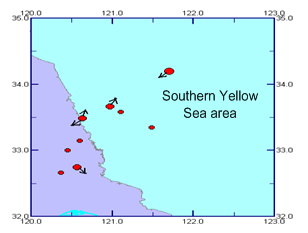 | Figure 10. Primary rupture direction of small and medium earthquakes occurred during normal periods in southern Yellow Sea area |
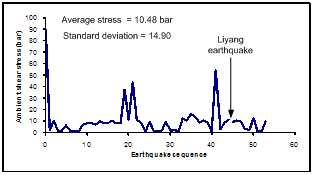 | Figure 11. Ambient shear stress (τ) of small and medium earthquakes inLiyang M6.0 earthquake sequence |
|
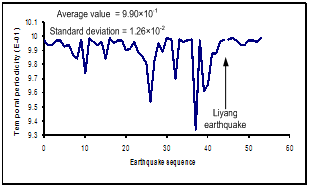 | Figure 12. Waveform’s temporal periodicity (r) of small and medium earthquakes inLiyang M6.0 earthquake sequence |
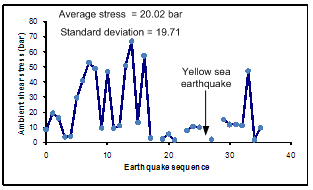 | Figure 13. Ambient shear stress (τ) of small and medium earthquakes insouthern Yellow Sea M6.2 earthquake sequence |
|
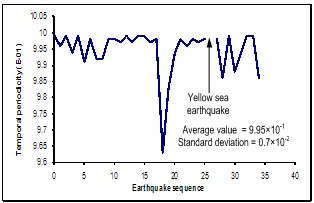 | Figure 14. Waveform’s temporal periodicity (r) of small and medium earthquakes insouthern Yellow Sea M6.2 earthquake sequence |
 value had more and higher peak values and violently varied in the year before the M6.1 and M6.2 earthquakes. However, the τ value was low and varied smoothlyduring other time periods. Expected value and RMS of τ of earthquakes that occurred 3 years 9 months, 1 year 10 months, 1 year before the main shock, and that occurred during normal period were calculated and compared in Table 7, from which obvious differences can be observed.Fig. 16plots the variation of temporal periodicity of waveforms r in this earthquake sequence. From that figureitis observed that the temporal periodicity r was higher and varied smoothly during most of the normal time periods while it reached the lowest value of 0.939 and violently varied from January 13, 1993 till the main shock.
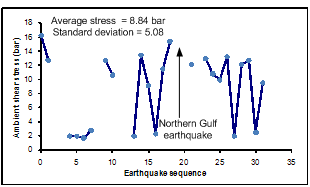 | Figure 15. Ambient shear stress (τ) of small and medium earthquakes in northern Gulf M6.1 and M6.2 earthquake sequence |
|
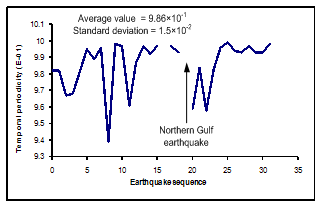 | Figure 16. Waveform’s temporal periodicity (r) of small and medium earthquakes in northern Gulf M6.1 and M6.2 earthquake sequence |
5. Conclusions
- This paper introduces important seismic source parameters (stress drop, focal radius, etc.), characteristics of medium (Q value, amplitude of microtremor, etc.), and rupture characteristics (L0/L, primary rupture direction, ambient shear stress, and waveform’s temporal periodicity), and explains how those parameters affect the small and medium earthquakes’ focal mechanisms (direction of P axes, nodal plane solutions, etc.) through a number of earthquake examples. This paper reveals that the investigation of these parameters measured from small and medium earthquakes can be used as effective criteria in determining and judging impending main shocks that occur in same seismic zone. The findings of this paper can be further applied for advancing seismic wave method in earthquake prediction.
References
| [1] | P.-S.Chen, Y.-R.Zhuo, Y.Jin, Z.-G.Wang, W.-Q.Huang, W.-X.Li, R.-S. Hu, “Stress Field of Beijing, Tianjin, Tangshan, and Zhangjiakou Area Before and After Tangshan Earthquake”, Chinese Journal of Geophysics, 21(1), 1978, 24-58. |
| [2] | X.-W. Hua, “Variation Process of Regional Stress in Beijing and Tianjin before and after the Tangshan Earthquake”, ActaSeismologicaSinica, 2(2), 1980. |
| [3] | Z.-H. Xu, Y.-F.Liu, Y.-Z.Zhang, “Directional Characteristics of Seismic Stress Field in Beijing, Tianjin, Tangshang, and Zhangjiakou”, ActaSeismologicaSinica, 1(2), 1979. |
| [4] | M.A. Sadovsky, I.L. Nersesov, S.K. Nigmatullaev, L.A. Latynina, A.A. Lukk, A.N. Semenov, I.G. Simbireva, V.I. Ulomov, “The Processes Preceding Strong Earthquakes in Some Regions of Middle Asia”, Tectonophysics, 14(3-4), 1972, 295-307. |
| [5] | M.A. Sadovsky, I.L. Nersesov, “Forecasts of Earthquakes on the Basis of Complex Geophysisical Features”, Tectonophysics, 23(3), 1974, 247-255. |
| [6] | M. Wyss, “Precursors to the Garm Earthquake of March 1969”, Journal of Geophysical Research, 80(B20), 2926-2930. |
| [7] | B.T. Brady, “Theory of Earthquakes II. Inclusion Theory of Crustal Earthquakes”, Pure and Applied Geophysics, 113(1), 1975, 149-168. |
| [8] | C.-Z. Zhu, C.-H.Fu, S.-L.Luo, “Focal Parameters of Micro Earthquakes Occurred before and after Tangshan ML7.8 Earthquake”, ACTA GeophysicaSinica, 20(4), 1977. |
| [9] | Y.-T. Chen, B.-H.Lin, X.-C.Li, M.-Y.Wang, D.-D.Xia, X.-H.Wang, W.-Q.Liu, Z.-Y. Li, “Determination of the Focus Parameters of the Small Earthquakes in Qiaojia, Shimian, and the Assessment of Seismic Hazard”, Chinese Journal of Geophysics, 19(3), 1976, 206-231. |
| [10] | I.N. Gupta, “Precursory Reorientation of Stress Axes due to Vertical Migration of Seismic Activity”, Journal of Geophysical Research, 80(2), 1975, 272-273. |
| [11] | H.-D. Gu, Y.-T. Chen, X.-L.Gao, Y. Zhao, “Earthquake Mechanism of Haicheng Earthquake in Liaoning”, Chinese Journal of Geophysics, 19(4), 1976, 27-285. |
| [12] | M. Tsujiura, “Spectral Features of Foreshocks”, Earthquake Research Institute, University of Tokyo, 52(3-4), 1977, 357-371. |
| [13] | W.H. Bakun, T.V. McEvilly, “P-Wave Spectra for ML5 Foreshocks, Aftershocks, and Isolated Earthquakes near Parkfield, California”, Bulletin of the Seismological Society of America, 17(2), 1981, 423-436. |
| [14] | R.B. Herrmann, “Q Estimates Using the Coda of Local Earthquakes”, Bulletin of Seismological Society of America, 70(2), 1980, 447-468. |
| [15] | P.-S. Chen, J.-C.Gu, W.-X. Li, “A Study of the Earthquake Faulting Process and Earthquake Prediction in the Light of Fracture Mechanics”, Chinese Journal of Geophysics, 20(43), 1977, 185-202. |
| [16] | C.-Z. Zhu, C.-H.Fu, Z.-G.Rong, S.-L.Luo, “Hypocentral Parameters and Quality Factor of Medium of Small Earthquakes Before and After Haicheng Earthquake”, ACTA GeophysicaSinica, 20(3), 1977. |
| [17] | Y.-Q. Zhu, W.-L.Liu, “Determination of Key Areas for Earthquake Surveillance and Protection during 2006-2020 in Shanghai”, Project Report, 2006. |
| [18] | B.-H. Lin, S.-F.Wu, Z.-M.Gao, “On the Lowering of the Epicentral Intensity of the Ninghe Aftershock of May 12, 1977”, Chinese Journal of Geophysics, 22(1), 1979, 14-24. |
| [19] | C.-Z. Zhu, K.-B.Shi, L.-T. Wang, “Variations in Microseism before and after the Tangshan Earthquake”, Chinese Journal of Geophysics, 24(3), 1981, 327-335. |
| [20] | H. Kanamori, J.J. Cipar, “Focal Process of the Great Chilean Earthquake May 22, 1960”, Physics of the Earth and Planetary Interiors, 9, 1974, 128-136. |
| [21] | W.-L. Liu, Y.-L.Xu, C. Zhang, H. Zhang, W.-D.Shen, W.-X.Zhong, “Study on the Distinguish Elements of The Seismic Wave of The Gap, Belt and Foreshock”, Seismological Research of Northeast China, 22(2), 2006. |
| [22] | W.-L. Liu and Y.-C. Liu, “Identify Criteria of Seismic Wave of Earthquake Gap, Earthquake Belt, and Foreshock“, ISET Journal of Earthquake Technology, 2011 48(1). |
| [23] | Z.-C. Zhang, L.-G.Luo, H.-H.Li, L.-D.Chen, Y.-H. Li, “Chinese Earthquake Cases (1976-1980)”, Seismic Publisher, Beijing, China, 357-384. |
 Abstract
 Reference
 Full-Text PDF
 Full-Text HTML