A. M. A Dawood 1, T. T. Akiti 2, E. T. Glover 1
1National Radioactive Waste Management Centre, GAEC, P. O. Box Lg 80, Accra-Ghana
2Graduate School of Nuclear and Allied Sciences, P. O. Box AE 1, Accra-Ghana
Correspondence to: A. M. A Dawood , National Radioactive Waste Management Centre, GAEC, P. O. Box Lg 80, Accra-Ghana.
| Email: |  |
Copyright © 2012 Scientific & Academic Publishing. All Rights Reserved.
Abstract
The earth is characterized by many layers, each with different physical properties. When sound waves travel through the earth encounter a change in the physical properties of the material in which they travel, they will either reflect back to the surface or penetrate deeper into the earth; where they may again be reflected at another interface. At a geological interface some seismic energy will react when it encounters a subsurface layer. This physical property is closely associated with the density of a layer. A site earmarked for a radioactive waste disposal facility was assessed by means of seismic refraction survey for purposes of revealing the sub-surface information and to ascertain whether or not the site is ‘competent’ to host a radioactive waste disposal facility. The processed seismic information obtained indicates discontinuity in the rock-formation at certain points on the survey lines. These points have been mapped as the weak zones at stations 25 meters and 65 meters along line 2 and at stations 25 meters, 50 meters and 100 meters along line 3-spread 1.
Keywords:
seismic waves, refraction, faults, fractures, geological structures, geophones
1. Introduction
Information such as faulting and fracturing, bedding plane direction, the presence of pore fluids, complex geological structure and detailed stratigraphy are commonly interpreted from 2D or 3D seismic data sets[1,8,9]. These geological structures are objects of geological discern in geophysical investigation that inform the ‘competence’ or otherwise of the sub-surface.In a seismic investigation, acoustic energy propagation is measured within a medium. The velocity of acoustic energy in the form of compressional and shear waves is related to the dynamic elastic moduli and density of a material[2, 8, 12]. The use of seismic surveys in foundation studies and groundwater exploration has traditionally relied on seismic refraction techniques using compressional waves which show increasing velocity with density[2, 9].The earth is characterized by many layers, each with different physical properties. When sound waves travel through the earth encounter a change in the physical properties of the material in which they travel, they will either reflect back to the surface or penetrate deeper into the earth; where they may again be reflected at another interface. At a geological interface some seismic energy will react when it encounters a subsurface layer[4, 12, 14]. Thisphysical property is closely associated with the density of a layer. Acoustic energy is diffracted by fractured rocksurfaces in much the same way that a visual image is distorted in a shattered mirror. Identifying diffracted energy patterns is one way in which geological structures such as faults and fractures can be identified and mapped[2, 4, 14].
2. Tectonics and Structures of Study Area
The internal constitution of the earth can be brought to bear from the acquisition and interpretation of seismic data generated by earthquakes[7, 15]. Most earthquakes are generated by movement along fault plane from a single point known as the focus or hypocenter[7, 15].The site under investigation is located at Kwabenya in the Greater Accra region of Ghana. The area falls under the Togo Series and the Dahomeyan System and it is characterized by various geological structures including the Eastern and Western Boundary Faults. The Eastern Boundary fault is between the Togo Series and the Dahomeyan system whereas the Western Boundary fault follows the contact between the Birimian, the Voltaian and the Buem formation to the west of the Akuapim ranges of hills[3, 6, 7].
3. The Seismic Wave Principle
When a seismic wave encounters an interface between two different rock types, some of the energy is reflected and the remainder continues on its way at a different angle, i.e., it is refracted[4, 16]. The law of reflection is very simple; the angle of reflection is equal to the angle of incidence. Refraction on the other hand is governed by Snell’s law, which relates the angles of incidence and refraction to the seismic velocities in the two media as follows[4]: (1.0)If v2 is greater than v1, refraction will be towards the interface. If sin i equals
  the refracted ray will be parallel to the interface and some of its energy will return to the surface as a head wave that leaves the interface at the original angle of incidence.
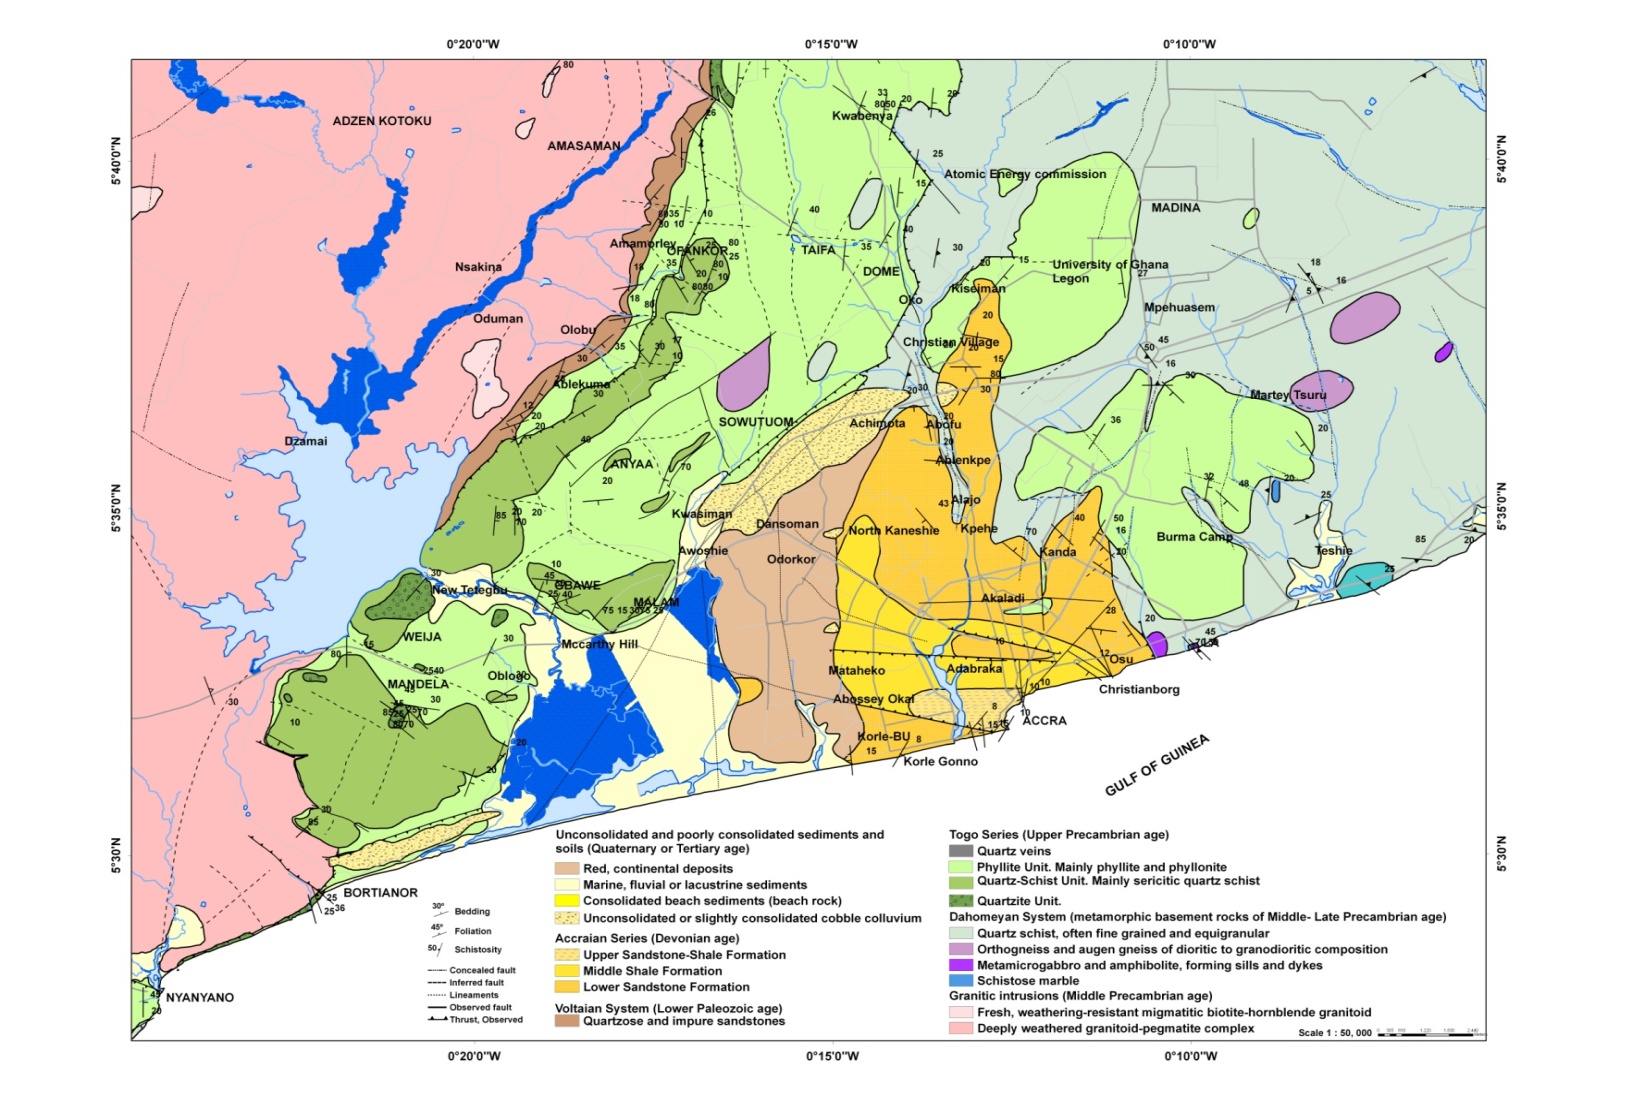 | Figure 1. Geological map of the Greater Accra Metropolitan Area (GAMA) indicating study area (after Muff and Efa, 2006) |
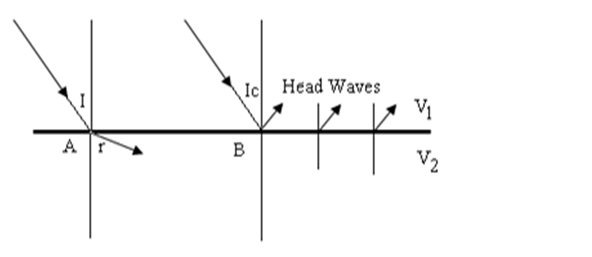 | Figure 2. Seismic wave travel; showing simple and critical refraction occurring at an interface |
At greater angles of incidence there can be no refracted ray and all the energy is reflected.Simple refraction occurs at A while at B critical refraction occurs, (fig. 2).The cross-over distance for which the travel times of the direct and refracted waves are equal is shown in equation 2.0 below[4]: (2.0)This equation forms the basis of a simple method of refraction interpretation.Xc is always more than double the interface depth and is large if the depth is large or the difference in velocities is small. The cross over distance is the distance at which the first arrival times are direct signals[4]. It marks the point when the refracted wave overtakes and arrives before the direct wave. It is related to the refractor depth, h, (fig. 3) and the velocities of the overlying medium and the refractor v1 and v2 respectively. The term critical distance is used for the minimum distance at which refractions return to the surface[4]. When the velocity is higher in the underlying layer there is a particular angle of incidence known as the critical angle, IC, for which the angle of refraction is 90o. This gives rise to a critically refracted ray that travels along the interface at the higher velocity v2.
3.1. Times–Distance Plots
This is a graph of time (on the y-axis) versus distance (on the x-axis). In a seismic refraction survey, the data extracted consist of sets of times (usually first-arrival times) measured by geophones at various distances from the source positions[4, 5, 10]. These times are plotted against distances. The gradient of any line is equal to the reciprocal of a velocity, i.e. steep slopes correspond to slow velocities[4]. 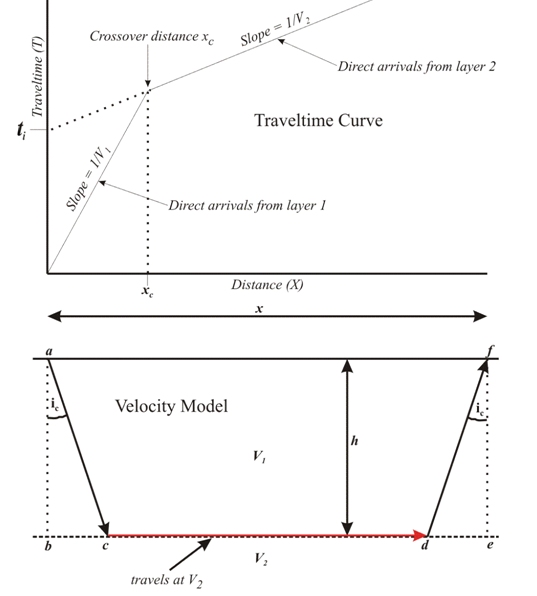 | Figure 3. Time-Distance graph for seismic refraction |
3.2. Travel-Time due to Refraction
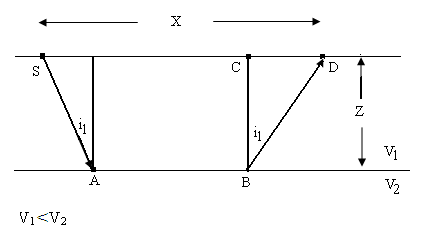 | Figure 4. Refraction ray-path for two layers. |
The total travel time along the refraction ray path, figure (4) above is SABD (where S is the source of the wave).Time = distance / Velocity (3.0)Thus the refraction time TR is given by: (3.1)
(3.1)
 | (3.2) |
But  and
and  The travel time may be expressed as
  | (3.3) |
Alternatively, The intercept time, Ti, is given as  | (3.4) |
Where  are the true velocities in the first and second media respectively.The intercept time, T i is defined as the time at which the back-extrapolated refracted arrival line cuts the time axis[4, 5]. Intercept times are conventionally obtained by drawing best-fit lines through the refracted arrival times but even a very good fit is no guarantee that the depth of the refractor does not change in the region near the shot point, from which no refractions are observed.
4. Materials and Methodology
A seismic equipment-set consist of a hammer for striking the shot-point (wave source), a high-speed digital data recording systems called seismographs and acoustic sensors called geophones.In this investigation, four survey lines L1, L2, L3 and L4 at 20 m apart were made on the study site of 180 by 250 metres square. Each line was pegged at 5 meters intervals.Seismic refraction field data (compressional and shear velocities) were measured on lines L2 and L3 with the SmartSeis Exploration Seismograph ES 3000, manufactured by Geometrics Inc. The SIPIK programme developed by RIMROCK Geophysics of U.S.A. was used to pick the arrival times.Line 2 had only one (1) spread on which the geophones were planted and seismic data measured. Two shots (at points A and B) were made on this spread at positions 0 and 80 meters.Line 3 had two (2) spreads with five shot-points (A, B, C, D and E) at positions between 0 and 125 on spread 1. 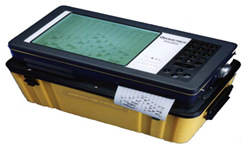 | Figure 5. SmartSeis Exploration Seismograph |
5. Results and Discussion
Seismic refraction data obtained on lines L2 and L3 were plotted in a time-distance graph shown below in figures (6 & 7). The modeled data on each line is presented in figures (8 & 9). The compressional velocity; Vp and shear velocity; Vs of the various zones measured on lines L2 and L3 are recorded as shown in the tables 5.1 and 5.2 respectively. | | Spreads | Velocities of topsoil (m/s) | Velocities of weathered zone (m/s) | Velocities of bedrock (m/s) | Depth to weathered zone (m) | Depth to bedrock (m) | | Vp | Vs | Vp | Vs | Vp | Vs | | | | 1 | 479 | 277 | 2176 | 1256 | 4190 | 2419 | 1.6-2.7 | 9.0-11.4 |
|
|
| | Spreads | Velocities of topsoil (m/s) | Velocities of weathered zone (m/s) | Velocities of bedrock (m/s) | Depth to weathered zone (m) | Depth to bedrock (m) | | | Vp | Vs | Vp | Vs | Vp | Vs | | 1 | 375 | 221 | 2124 | 1180 | 3918 | 2262 | 0.9-2.2 | 3.1-12.7 | | 2 | 637 | 368 | 927 | 535 | 4844 | 2797 | 0.8-7.3 | 5.8-13.9 |
|
|
| Line 2-Table 5.3.1 Array of shot points and their positions |
| | Spread | Shotpoints | | A | B | | 1 | 0 m | 80 m |
|
|
| Line 3-Table 5.3.2: Array of shot points and positions |
| | Spread | Shotpoints | | | A | B | C | D | E | | 1 | 0 m | 32.5 m | 62.5 m | 92.5 m | 125 m | | 2 | 110 m | 142.5 m | 172.5 m | 202.5 m | 235 m |
|
|
5.1. Seismic Refraction Graph & Site Models
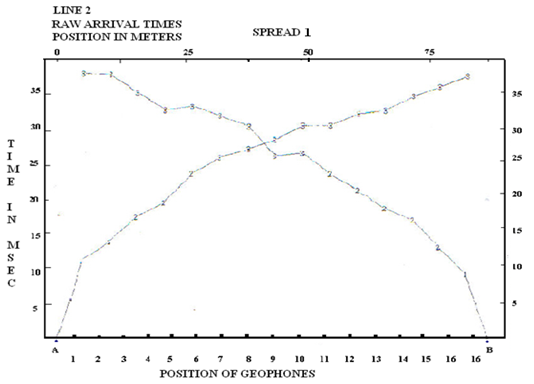 | Figure 6. Time-Distance graph of line 2 |
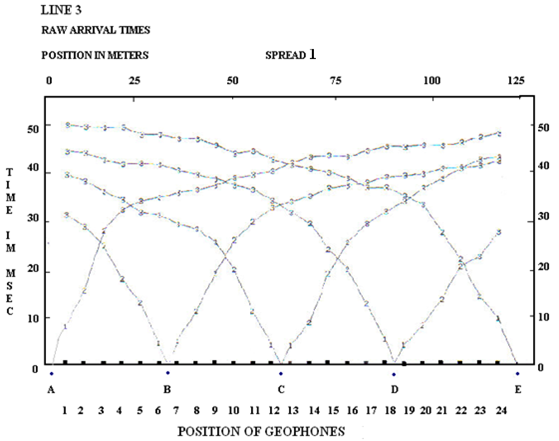 | Figure 7. Time- Distance graph of line 3 |
Line 2-Model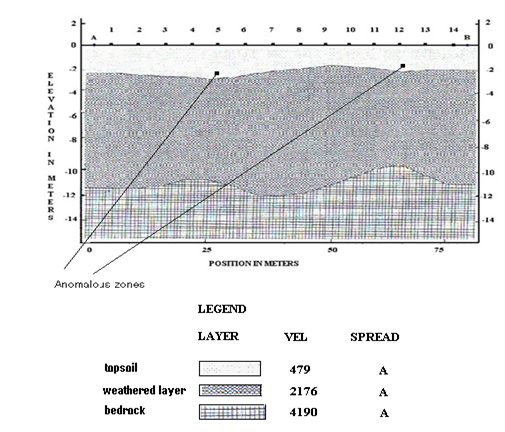 | Figure 8. Geological model obtained on line 2 showing geological anomaly |
Line 3-Model 1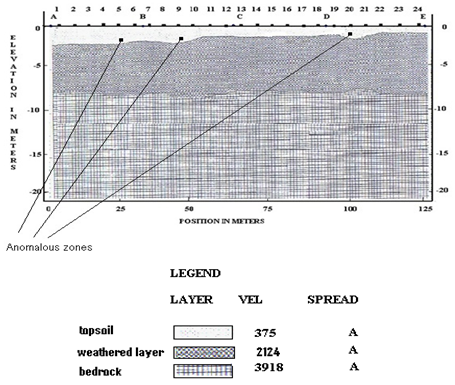 | Figure 9. Geological model obtained on line 3 showing geological anomaly |
5.1.1. Observations and Interpretation
The weathered layer on line 2 recorded compressional and shear velocities of 2176 m/s and 1256 m/s, the topsoil recorded 479 m/s and 277 m/s respectively. The bedrock was characterized by compressional and shear velocities of 4190 m/s and 2419 m/s. The weathered layer was located at a varied depth of 1.6-2.7 meters whiles the depth to the bedrock was varied at 9.0-11.4 meters.The topsoil, the weathered layer and the bedrock of line 3-spread 1 recorded compressional and shear velocities of 375 m/s and 221 m/s, 2124 m/s and 1180 m/s, 3918 m/s and 2262 m/s respectively. The weathered layer and the bedrock were located at varied depths of 0.9-2.2 meters and 3.9-12.7 meters respectively. Between depths of 0.9 meters and 1.6 meters is the weathered bedrock which has formed part of the overburden. Spread 2 of line 3 however, recorded compressional and shear velocities for the three layers as 637 m/s and 368 m/s, 927 m/s and 535 m/s, 4844 m/s and 2797 m/s. The weathered zone and bedrock were located respectively at varied depths of 0.8-7.3 meters and 5.8-13.9 meters.At stations 25 meters and 65 meters along line 2; some geological anomalies had been observed along the curves. This effect is clearly seen at geophone 5 and 12 of line 2 - model 1 (figure 8). A 2D view of these points shows a dip; characteristic of geological anomalies.The anomalies are attributed to discontinuities or presence of geological contacts such faults and fractures in the rock formation. The presence of varied rock materials within the same formation or system could give rise to recording such anomalies. Along line 3-spread 1, geological anomalies were recorded by the seismic refraction survey at stations 25, 50 and 100 meters at geophone 5, 9 and 20 respectively.
6. Conclusion and Recommendation
The site under study was duly subjected to seismic refraction investigation for purposes of revealing the sub-surface information and to ascertain whether or not the site is competent to host a nuclear waste disposal facility. The processed information indicates discontinuity in the rock-formation at certain points. These points have been mapped as the weak zones. These weak zones are found at stations 25 meters and 65 meters along line 2 and at stations 25 meters, 50 meters and 100 meters along line 3-spread 1.With the exception of these weak zones, the rest of the site passed the test of stability and are deemed ‘competent’/ stable.It is recommended that the radioactive disposal facility is situated away from any of the mapped weak zones. Environmental Impact Assessment is highly recommended.
ACKNOWLEDGEMENTS
Sincere gratitude to Prof. E.H.K. Akaho; the Director-General of the Ghana Atomic Energy Commission and to my colleagues at the National Radioactive Waste Management Centre, GAEC.
References
| [1] | Resolution Resources, Subsurface Imaging: , 15-12-2009 |
| [2] | Beck A.E., (1981), Physical Principles of Exploration Methods, MacMillan Press Ltd. |
| [3] | Muff, R. and Efa, E. (2006) Environmental and Engineering Geology for Urban Planning in Accra-Tema, Ghana Geological Survey Department Bulletin, 55. |
| [4] | Milsom, J., (2003), Field Geophysics, 3rd edition, J. Wiley & Sons Pub., New York |
| [5] | Kearey P., Brooks M., and Hill, I. (2010), Introduction to Geophysical Exploration, Third Edition, Blackwell Science Inc. |
| [6] | Nude, P.M., (2009), Petrology and Geochemistry of Nepheline Syenite and Related Carbonate-rich Rocks in the Pan-African Dahomeyide Orogen, Southeastern Ghana, Journal of African Earth Sciences. |
| [7] | Kearey, P., Klepeis, K.A., and Vine, F.J., Global Tectonics, Third Edition (2009), Wiley Blackwell. |
| [8] | Cordsen, A., Galbraith, M., and Peirce, J., Planning Land 3-D Seismic Surveys (2000), Society of Exploration. |
| [9] | Vermeer, G.J.O., 3-D Seismic Survey Design (2002), Society of Exploration Geophysicist. |
| [10] | Underwood, D., Near-surface Seismic Refraction Surveying Field Methods (2009), Geometrics Inc. |
| [11] | Sato, H., Fehler, M.C., and Maeda, T., Seismic Wave Propagation and Scattering in the Heterogeneous Earth, Second Edition (2012), Springer. |
| [12] | Moore, J.E., Field Hydrogeology, Second Edition (2011), CRC Press. |
| [13] | Milson, J.J., Eriksen, A., Field Geophysics, Fourth Edition (2011), J. Wiley & Sons. |
| [14] | Sarafinchin, M., Earth Engineering (2010), iUniverse.com |
| [15] | Gadallah, M.R., Fisher, R.L., Applied Seismology (2004), Pennwell Pub. |

 (1.0)If v2 is greater than v1, refraction will be towards the interface. If sin i equals
  the refracted ray will be parallel to the interface and some of its energy will return to the surface as a head wave that leaves the interface at the original angle of incidence.

 (2.0)This equation forms the basis of a simple method of refraction interpretation.Xc is always more than double the interface depth and is large if the depth is large or the difference in velocities is small. The cross over distance is the distance at which the first arrival times are direct signals[4]. It marks the point when the refracted wave overtakes and arrives before the direct wave. It is related to the refractor depth, h, (fig. 3) and the velocities of the overlying medium and the refractor v1 and v2 respectively. The term critical distance is used for the minimum distance at which refractions return to the surface[4]. When the velocity is higher in the underlying layer there is a particular angle of incidence known as the critical angle, IC, for which the angle of refraction is 90o. This gives rise to a critically refracted ray that travels along the interface at the higher velocity v2.

 (3.1)
(3.1)

 and
and  The travel time may be expressed as

 are the true velocities in the first and second media respectively.The intercept time, T i is defined as the time at which the back-extrapolated refracted arrival line cuts the time axis[4, 5]. Intercept times are conventionally obtained by drawing best-fit lines through the refracted arrival times but even a very good fit is no guarantee that the depth of the refractor does not change in the region near the shot point, from which no refractions are observed.


 Abstract
 Reference
 Full-Text PDF
 Full-Text HTML