-
Paper Information
- Next Paper
- Paper Submission
-
Journal Information
- About This Journal
- Editorial Board
- Current Issue
- Archive
- Author Guidelines
- Contact Us
Geosciences
p-ISSN: 2163-1697 e-ISSN: 2163-1719
2012; 2(1): 1-5
doi: 10.5923/j.geo.20120201.01
Studies on Site Specific Responses and its relationship with the Geological Formations in Kochi City of Kerala State, India
 Abstract
 Reference
 Full-Text PDF
 Full-Text HTML
H. N. Singh 1, Arvind Kumar 1, D. Shanker 2
1Department of Geophysics, Faculty of Science, Banaras Hindu University, Varanasi, 221005, India
2Department of Earthquake Engineering, Indian Institute of Technology Roorkee, Roorkee, 247667, Uttaranchal, India
Correspondence to: D. Shanker , Department of Earthquake Engineering, Indian Institute of Technology Roorkee, Roorkee, 247667, Uttaranchal, India.
| Email: |  |
Copyright © 2012 Scientific & Academic Publishing. All Rights Reserved.
The site response studies have been undertaken by measuring records of ambient noise vibrations in Kochi city of Kerala state, India with the objective of defining the site effects as this forms the most important input associated with the local geological conditions and constitute an important part of any seismic hazard assessment and microzonation map. The resonance frequency and the ground motion amplification thus estimated show very interesting features in their spatial variability and have specific range of resonance frequency associated with different geological formations from soft soils to compact rocky sites. The results suggest that the resonance frequency varies significantly within short distances in and around Kochi city. The detailed seismic microzonation map prepared for Kochi city contains five classes of resonance frequency (<1.1, 1.1-3.0, 3.1-5.0, 5.1-10.0 and >10 Hz) and three classes of site amplification (<5.1. 5.1-10.0, >10.0). The resonance frequency is spatially distributed in three NW-SE trending segments parallel to the coast which differ appreciably in their site response characteristics. The lowest resonance frequency values (≤ 1.0 Hz) coupled with generally high site amplification were observed in coastal and backwater areas covered with younger alluvial deposits, and high resonance frequency values (> 5 Hz) to charnockites and laterites in the hinterlands. It is demonstrated that site specific natural frequency can be used very successfully to delineate geological formations in a region provided closely spaced ambient noise data are available.
Keywords: Ambient Noise Vibrations, Ground Motion Amplification, Response Characteristics, Resonance Frequency
Cite this paper: H. N. Singh , Arvind Kumar , D. Shanker , "Studies on Site Specific Responses and its relationship with the Geological Formations in Kochi City of Kerala State, India", Geosciences, Vol. 2 No. 1, 2012, pp. 1-5. doi: 10.5923/j.geo.20120201.01.
Article Outline
1. Introduction
- It is generally accepted that chances of predicting location, time and magnitude of an impending earthquake is remote, the main emphasis is now shifting to predict the site specific seismic hazards. Hence, understanding of the site-specific behaviour is important for the prediction of seismic hazard due to local and/or distant earthquakes. The concept of seismic Microzonation is to delineate individual critical zones based on their potential for hazardous earthquake effects. The earthquake generated ground motion is very much dependent on local surficial site conditions. The site response involves understanding the effects of shallow near-surface sedimentary layers on the propagation of seismic waves. Under certain conditions, the character of upper one hundred meters or so of rocks and soils beneath any site has more conspicuous effect on the level of earthquake shaking than the magnitude of the earthquake itself. When seismic waves encounter a low-velocity near surface sedim-entary layer, three phenomena i.e. increase in amplitude, bending of wave path towards vertical, and the trapping of the waves in the near surface layer occur. These phenomena increase the shaking of the ground locally resulting in increased damage to the man made structures. In view of this, the damage pattern in any particular locality can be forecast with the help of site response data derived through various techniques. The three effects; amplification, resonance and attenuation all depend on the depths and the properties of the sediments (Gibson, 1990). The Nakamura method estimates experimentally the combined effects of these three parameters compared with bedrock motion. In the present work, the Kochi city of southwest Indian subcontinent has been selected for site response studies through measurement of ambient noise (microtremor) data and preparation for seismic microzonation map. The city is one among the largest harbour cities in the country and is the main commercial and industrial city of Kerala state with an area of about 100 km2 (Fig. 1). The city and its surroundings are situated mostly on loose sediments of alluvium, clay, loamy sands, silt, laterites etc. and have vast area of intermittent water bodies. Most of the waterlogged low-lying area has been reclaimed for various developmental activities such as residential, commercial and industrial. This is a fast growing city with high-density population where many tall buildings have come up during the past few years- the trend is on the increase, which exert tremendous pressure on the limited land resources. Under the circumstances, damage due to an earthquake (local and/or distant large earthquake) could be alarming since such land systems are generally susceptible for amplification of seismic waves. This map would be useful to take precautionary steps in future construction and developmental activities.
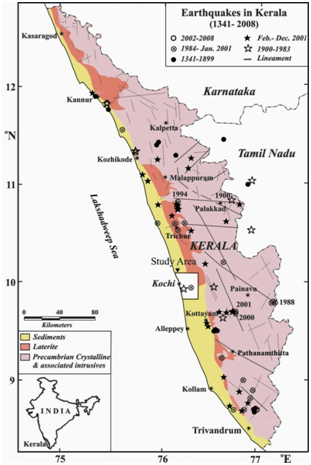 | Figure 1. Map of the Kerala state, southwest Peninsular India showing general geology, lineament patterns and seismic activity till 2008 and the study area in Kochi city in which ambient noise data were collected for estimation of site specific responses and for the preparation of seismic Microzonation map of the city |
2. Resonance Frequency and Ground Amplification in Low Velocity Unconsolidated Sediments
- Near surface soils modify the spectral response and transmission of energy waves released from a seismic rupture plane. These effects are usually unique to a specific site. Typically rock or stiff soil sites have greater short period response (i.e. greatest energy within the 0-0.4 second range), but experience more rapid decay and lower long period response (Fig. 2). Conversely soft soils may filter (attenuate) some short period response, resonate and therefore amplify excitation when the basement excitation is sympathetic with their own natural period, and have little effect on longer period response (King, 1996). S waves are most destructive in near field (10s of a km) from the hypocenter, whereas surface waves cause most of the damage from far field (> 100s of km) earthquakes. To assess local site effects, the following methods are generally used as response analysis of soil surface in earthquake damage assessment. (1) Multiple reflection theory of elastic response; (2) equivalent linear approach of non-linear response; and (3) other methods (e.g. Matsuoka and Midorikawa, 1994).
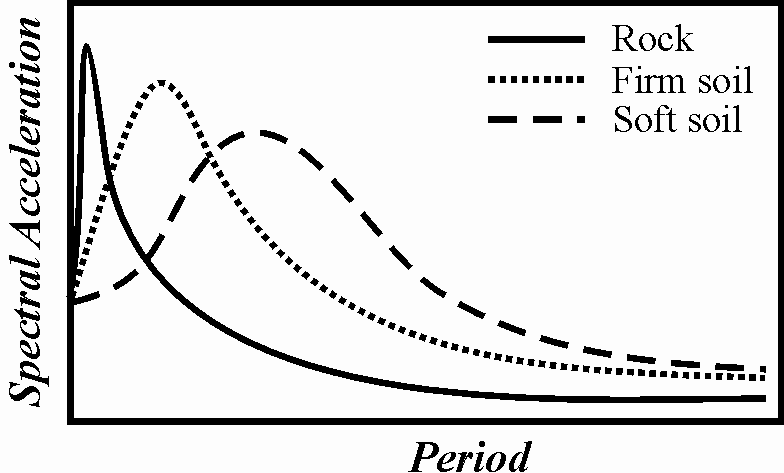 | Figure 2. Site influence on spectral response (King, 1996) |
3. Field Surveys and Instruments Used
- Ambient noise records in Kerala were obtained in selected sites by employing a CityShark II 3-component Seismic Recorder, a Lennartz LE-3Dlite tri-axial active geophone with 1 Hz natural frequency, and a handheld Garmin GPSMAP 76S (for station location). About 1000 sites were occupied in 7 months duration from February-August 2005 in Kerala state. In Kochi city (76.18o-76.43o E; 9.82o-10.08o N), 988 sites were occupied which are distributed in an area 28 km x 29 km. Finally, 924 ambient noise data were analyzed and estimated site specific response parameters for the preparation of seismic microzonation map for the city. The ambient noise records were obtained from varied geological setup such as beach sectors, islands, backwater zones, laterites and charnockite formations.
4. Estimation of Site Response Parameters
- H/V technique developed by Nakamura (1989) was used for estimating site response parameters for the preparation of seismic microzonation for Kochi city. The data processing and estimation of site response parameters were carried out using J-SESAME software (version 1.08) developed under European Project SESAME 2000-2004 (SESAME European project 2003, 2004) for the processing of microtremor data. Ground motion amplification (H/V) is computed by merging the horizontal (NS and EW) components with a geometric mean option (Fig. 3).
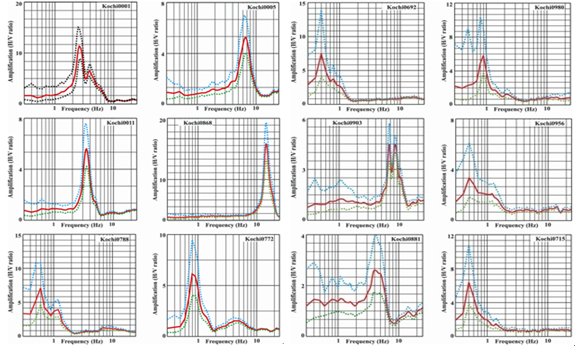 | Figure 3. Estimation of site response parameters (resonance frequency and ground amplification) using H/V spectral ratio for the merged horizontal components observed at 12 sites in the Kochi city. The peak at which maximum site amplification is observed in H/V curve is the first resonance frequency (Fo) pertaining to the sites |
5. Seismic Microzonation
- Seismic microzoning is the usual procedure to have the local effects taken into account for engineering design and land-use planning, and it is an effective tool for earthquake risk assessment and formulation of appropriate strategies for mitigation. Site response parameters (resonance frequency and ground amplification) estimated in the present work is used for the preparation of seismic microzonation map for the Kochi city. The details such as class intervals of resonance frequency and site amplification used for preparing microzonation map and the area of individual identified microzones are furnished in Table 1. Microzones I and III (Fig. 4) occupy the easternmost and westernmost part of the study area whereas Microzone II is sandwiched between them. These three microzones are distinct in their site response characteristics and are elongated in NW-SE direction parallel to the west coast of India.Microzone III is characterized by low resonance frequency (≤ 1.0 Hz), Microzone II with medium level of resonance frequency (1.1-5.0 Hz) and Microzone I has highest level of resonance frequency more than 5 Hz. Though the average level of site amplification (H/V) is more in Microzone III, there are certain scattered pockets of similar nature in Microzones I and II. Longest characteristic site periods more than 6.3 sec. for Microzones III, medium period 1.2-6.3 sec. for Microzone II and minimum of less than 1.2 sec. for Microzone I were estimated. This information suggests that buildings and structures in Microzone III have highest probability to achieve resonance as compared to Microzones II and I when the natural frequency of ground motion resulting due to an earthquake matches with that of the natural frequency of structures. This investigation indicates that the entire Microzone I and the adjoining portion of Microzone II are comparatively safer as compared to the remaining areas comprising of entire Microzone III and bordering areas of Microzone II.
6. Discussion and Conclusions
- The whole effort of collecting ambient noise data, in the present case, showed that the use of CityShark for microzoning saves a considerable amount of time and provides quick and reliable estimates of resonance frequency and site amplification. It is inferred that the resonance frequency estimated through closely spaced noise data are very useful to identify boundaries of different geological formations that play a vital role in amplifying ground motion. Hence, understanding of site-specific behaviour is important for the prediction of seismic hazard (Singh et al., 2004) due to local and/or distant earthquakes. The distribution pattern of resonance frequency and site amplification show that soft soils with thick sedimentary columns (tidal, fluvial and palaeo beach deposits) in and around the coastal belt and backwater zones are invariably associated with low resonance frequency and are likely to amplify ground motion greatly that may result in relatively more damage. On the other hand, the eastern portion of the study region covered with charnockite and laterite exhibit high resonance frequency and may not amplify ground motion much. In such areas, damage will be limited but strong amplification is anticipated in scattered sites having undulation in topography and in basement.Seismic Microzones I, II and III identified from the microzonation map have different site response characteristics in terms of resonance frequency and site amplification. Seismic Microzone I indicates high frequency sites (stable areas) in which generally low level site amplification occur but likely to generate high amplification of ground motion at limited sites; Seismic Microzone II is a medium frequency sites (moderately unstable) in which moderate to high amplification of ground motion likely to occur while Seismic Microzone III is a low frequency sites (unstable areas) and is likely to produce high to very high amplification of ground motion. The characteristic site period in Microzone III is estimated to be highest whereas it is comparatively low to very low in Microzones II and I, respectively.
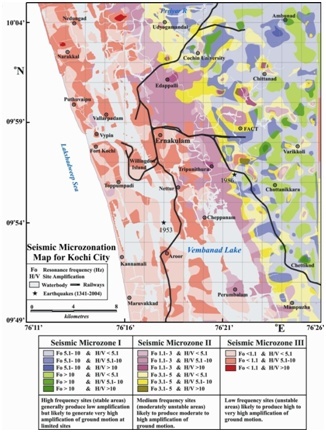 | Figure 4. Seismic microzonation map for Kochi city prepared using five classes of resonance frequency (Fo <1.1; 1.1-3.0; 3.1-5.0, 5.1-10.0 & >10.0 Hz) and three classes of site amplification (H/V <5.1; 5.1-10.0 & >10.0). Major portion of the study area (western portion) falls in Seismic Mocrozone II & III which are liable to deliver high level of ground amplification in an earthquake |
ACKNOWLEDGEMENTS
- The first two authors (HNS and AK) are thankful to the Head, Department of Geophysics, Banaras Hindu University, Varanasi and third author (DS) to the Head, Department of Earthquake Engineering, IIT Roorkee for providing necessary computational facilities and permission to publish this paper. The authors are also thankful to the Head, Geosciences Division, Centre for Earth Science Studies, Trivandrum for providing a major portion of the ambient noise data to undertake this work.
References
| [1] | Bard, P.Y. “Microtremor measurements: a tool for site effect estimation ?, State-of-the-art paper”, Second International Symposium on the Effects of Surface Geology on seismic motion, Yokohama, December 1-3, 1998, Irikura, Okada & Sasatani (eds.), Balkema, 1999, 3, 1251-1279, 1999 |
| [2] | Gamal, M.A. “Seismic hazard analysis of Egypt and seismic microzonation of the Greater Cario based on empirical and theoretical models”, PhD. Faculty of Acience, Geophysics Dept., Cario University Egypt, 2001 |
| [3] | Gibson, G. “An Introduction to seismology” in conference on the Newcastle Earthquake, Newcastle, 15-17 Feb. 1990, 1990 |
| [4] | Haskell, N. A. “Crustal reflection of plane SH waves”, J. Geophys. Res., 65, 4147-4150,1960 |
| [5] | King, A. “The fundamentals of an earthquake standard” in proceedings of a seminar held by the Australian Earthquake Engineering Society, Adelaid, S.A., 8-15, 1996 |
| [6] | Lermo, J., Rodriguez, M. and Singh, S.K. “Natural periods of sites in the valley of Mexico from microtremor measurements and strong motion data”, Earthquake Spectra, 4, 805-814, 1988 |
| [7] | Matsuoka, M., and Midorikawa, S. “The digital national land information and seismic microzoning”, 22nd symposium of earthquake ground motion, 23-34 (in Japanese with English abstract), 1994 |
| [8] | Midorikawa, S., Matsuoka, M., and Sakugawa, K. “Site Effects on Strong-Motion Records Observed during the 1987-Chiba-ken-toho-oki, Japan Earthquake”, Proc. Ninth Japan Earthq. Engnrg. Sympo., E085-E090, 1994 |
| [9] | Mukhopadhay, S., Pandey Y., Dharamraju, R., Chauhan, P.K.S, Singh P. and Dev, A., “Seismic Microzonation of Delhi for ground shaking site effects”, Current Science, 82 (7), 877-881,2002 |
| [10] | Mukhopadhyay, S. and Bormann, P. “Low cost seismic microzonation using microtremor data: an example from Delhi, India”, Jour. of Asian Earth Sciences, 24, 271-280, 2004 |
| [11] | Nakamura,Y. “A method for dynamic characteristic estimation of surface using microtremor on the ground surface”, Q. Rep. Railw. Tech. Res. Inst. (Tokyo), 30, 25-33, 1989 |
| [12] | Schnabel, P. B., Lysmer, J., and Seed, H. B., “SHAKE a computer program for earthquake response analysis of horizontally layered sites”, EERC, 72-12, 1972 |
| [13] | SESAME European project (2004): J-SESAME User Manual, Version 1.08 |
| [14] | Singh, J.P., “Lecture notes for "Seismic Loading: Code Versus Site Specific" presented at a "Portland Regional Seminar on Seismic Engineering Issues" in September, 1995, 1995 |
| [15] | Singh, H. N., Neelakandan, V. N. and Shravan Kumar, V., 2007: GIS based seismic microzonation of Kochi. Proc. Vol. of XXVII INCA Congress (Nov. 2007), p. 292-299 |
| [16] | Singh H.N., Mathai J., Neelakandan V.N., Shankar D. and Singh V.P. “A database on occurrence patterns of unusual geological incidents in Southwest Peninsular India and its implication on future seismic activity”, Acta Geod. Geoph. Hung., 40(1), pp. 69-88, 2004 |
| [17] | Sugito, M., Goda, G., and Masuda, T. “Frequency dependent equi-linearized technique for seismic response analysis of multi-layered ground”, Proceedings of JSCE, 493, 49-58, 1994 (in Japanese with English abstract) |