-
Paper Information
- Previous Paper
- Paper Submission
-
Journal Information
- About This Journal
- Editorial Board
- Current Issue
- Archive
- Author Guidelines
- Contact Us
Geosciences
p-ISSN: 2163-1697 e-ISSN: 2163-1719
2011; 1(1): 16-25
doi:10.5923/j.geo.20110101.02
Use of Hydrochemistry and Stable Isotopes as Tools for Groundwater Evolution and Contamination Investigations
Srinivasamoorthy Krishnaraj1, Vasanthavigar Murugesan2, Vijayaraghavan K2, Chidambaram Sabarathinam2, Anandhan Paluchamy2, Manivannan Ramachandran2
1Department of Earth Sciences, Pondicherry University, Puducherry, 605014, India
2Department of Earth Sciences, Annamalai University, Annamalainagar, Tamilnadu, 608002, India
Correspondence to: Srinivasamoorthy Krishnaraj, Department of Earth Sciences, Pondicherry University, Puducherry, 605014, India.
| Email: |  |
Copyright © 2012 Scientific & Academic Publishing. All Rights Reserved.
Hydrochemical and isotopic studies in groundwater was attempted in a basin to gain knowledge on geochemical evolution and water quality status. The results of the chemical analysis indicate the sources of ions into the groundwater are from dissolution and leaching from source rocks, cation exchange and anthropogenic activities. The saturation index calculated specify oversaturation of carbonate species and undersaturation of amorphous silica indicating groundwater chemical evolution controlled by water rock interactions. Water type alters from Ca-HCO3 to Na-Cl indicating groundwater chemistry controlled by rock-water interaction and anthropogenic activities. The plots of various ionic ratios point out groundwater chemistry affected by ion exchange process, silicate and carbonate weathering along with anthropogenic activities. The isotopes of δ2H versus δ18O signify ionic concentration increases along the groundwater flow direction along lower elevations. The water type’s classification designate 5 distinct groups ranging from low EC and highly depleted isotopes to very high EC with enriched stable isotopic composition indicating longer residence time of groundwater.
Keywords: Ionic Ratios, Stable Isotopes, Hydrogeochemistry, WATEQ4F, Thirumanimuttar
Cite this paper: Srinivasamoorthy Krishnaraj, Vasanthavigar Murugesan, Vijayaraghavan K, Chidambaram Sabarathinam, Anandhan Paluchamy, Manivannan Ramachandran, Use of Hydrochemistry and Stable Isotopes as Tools for Groundwater Evolution and Contamination Investigations, Geosciences, Vol. 1 No. 1, 2011, pp. 16-25. doi: 10.5923/j.geo.20110101.02.
Article Outline
1. Introduction
- Groundwater is a valuable resource in many areas, and it commonly plays a key role in the economic development. Recently, water demand has increased rapidly with the construction of energy, development of industry, agriculture, urbanization, improvements in living standards and eco-environment construction. The chemical composition of groundwater is controlled by many factors, including the composition of the precipitation, geological structure and mineralogy of the watersheds and aquifers and the geological processes within the aquifer. The interaction of all factors leads to various water types. In many areas, particularly arid and semi-arid zones, groundwater quality limits the supply of potable fresh water. To utilize and protect valuable water resources effectively and predict the change in groundwater environments, it is necessary to understand the hydrochemical characteristics of the groundwater and its evolution under natural water circulation processes (Lawrence et al., 2000; Edmunds and Ma, 2006. The study area Thirumanimuttar sub basin, a hard rock terrain receives major part of rainfall from northeast monsoon. The surface water sources are generally precarious to get their supply during monsoon seasons and in non monsoonal periods people have to largely depend on groundwater resources for their domestic, agricultural and industrial activities. Although aquifers in the study area are intensively exploited prior to the present study, little was known about the major hydrogeochemical process that controls the observed water chemistry. Similarly the origin of elevated concentrations of elements and the vulnerability of the aquifer to pollution were equally unclear. A growing population and increased agricultural and industrial activities in the area have resulted in deterioration of water resources. In the present study, a detailed investigation was carried out with the objective of identifying hydrochemical processes and their relation to groundwater quality Zongyu Chen et al., 2006; Franco Cucchi et al., 2007; Guangxin Zhang et al., 2007; Aji et al., 2008; Prasanna et al., 2009; Janza, M. 2010; Kebede et al., 2010; Latifa et al., 2011; Dickson et al., 2011 Ruiqiang et al., 2011.
2. Materials and Methods
- Study Site DescriptionThirumanimuttar basin lies between North Latitudes 10°58′ and 11°48′ East Longitudes 77°53′ and 78°21′ with a total drainage of about 2438 km2 (Fig. 1).
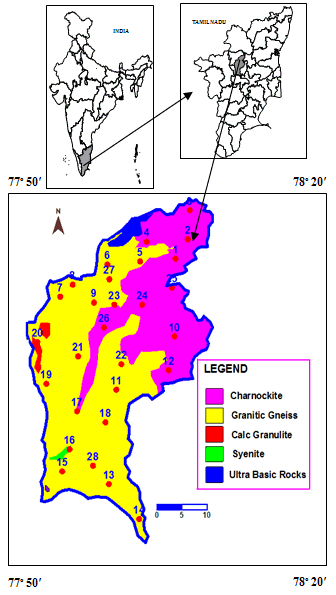 | Figure 1. Geology and sampling location map of the study area |
3. Results and Discussion
- StatisticsIn the groundwater samples pH value ranges from 6.4 to 8.0 with an average of 7.4. The increase in pH is explained by the consumption of dissolved CO2 gas by organisms and aquatic plants (Njitchoua et al., 1997) whereas the decrease of this parameter is primarily due to oxidation of organic matter and also due to human induced pollution (Table 1). Higher pH was noted in locations like 6, 13, 24 and 27 indicating pollution sources. Concentration of TDS, a measure of quality ranged from 488.3 to 3441.0 mg/l with an average of 1499.9 mg/l. According to TDS classification 84% of the samples belonged to brackish type (TDS > 1000 mg/l) and the remaining 14% represented fresh water (TDS < 1000 mg/l). The electrical conductivity values range from 763.0 to 5,376 µs/cm at 25oC, averaging 2336 µs/cm. Anomalous high value noted in location 27, is noticed near the channels carrying industrial discharge and urban sewage disposals and accumulation of leaching chemicals. Sodium is the most abundant cation in groundwater, it varies from 5.1 to 1061 mg/l with an average of 232.8 mg/l. Calcium varies in concentration ranging from 15.9 to 147.9 mg/l, with average of 77.3 mg/l. The sources of sodium and calcium in the groundwater are from the minerals like silicates, feldspars, pyroxenes and amphiboles identified in the rock types of the study area. High concentration of Na and Ca in the groundwater is attributed to cation exchange among minerals (Subramanian and Saxena, 1983). Magnesium concentration ranges from 22.0 to 170.2 mg/l with an average of 65.4 mg/l. The sources of magnesium are due to leaching of minerals like Dunite, Olivine, Augite, Biotite and Hornblende from the major litho units of the study area. Potassium ranges from 1.5 to 325.0 mg/l with an average of 34.3 mg/l. Due to the resistance of potassium bearing minerals (Orthoclase, Microcline and Biotite), Potassium is generally lower in groundwater, but abnormal concentrations in certain locations may be due to human intervention (Subbarao et al., 1999). The chloride in groundwater ranges from 79.7 to 1453.5 mg/l, with average value of 437.7 mg/l. Due to the absence of chloride bearing minerals in the study area anomalous high Cl might have been derived from anthropogenic sources (Srinivasamoorthy et al., 2008). The bicarbonate ion ranges from 183.0 to 854.2 mg/l with an average value of 403.3 mg/l. Due to the lack of carbonate rocks in the study area, the possible sources of bicarbonate include weathering from silicate minerals in addition to cations such as Ca, Mg and HCO3 along with presence of organic matter in the groundwater which is oxidized to produce carbon dioxide, which in turn promotes dissolution of minerals. Nitrate ion in the study area ranges from 17.5 to 527.0 mg/l with an average of 170.5 mg/l. Sulphate ion ranges from 1.0 to7.7 mg/l with an average of 4.11 mg/l. Fluoride ions ranges from 0.1 to 4.3 mg/l with an average of 1.7 mg/l. Concentrations of NO3 are the result of different pollution processes involving municipal wastewaters, fertilizers and the application of agricultural pesticides, among others. The highest NO3 concentration levels were found in areas where large amounts of N fertilizers (commonly urea, nitrate or ammonium compounds) are used due to intensive agricultural practices (Srinivasamoorthy et al., 2009). Sources of fluorides are from leaching of fluoride bearing minerals like apatite, hornblende and mica identified in the source rocks of the study area along with intensive irrigation, high rate of evapotranspiration and long residence time of waters in the aquifers (Wodeyar and Sinivasan, 1996; Subbarao, 2006). Silica in the groundwater ranges from 33.0 to 75.0mg/l with an average of 56.0 mg/l, higher concentration is mainly due to presence of silicate minerals from the litho units of the study area. The abundance of the major cations and anions in the groundwater are of the following order: Na>Ca>Mg>K and Cl>HCO3>NO3>SO4>F>PO4 respectively.Saturation IndicesMineral equilibrium calculations for groundwater are useful in predicting the thermodynamic control on the composition of groundwater and the approximate degree to which the groundwater has equilibrated with the various carbonate mineral phases such as Calcite, Dolomite, and Magnesite (Deutsch, 1997). By using the saturation index approach, it is possible to predict the reactive mineralogy of the subsurface from groundwater data without collecting the samples of the solid phase and analyzing the mineralogy (Deutsch, 1997). The saturation indices were determined using the hydrogeochemical equilibrium model, WATEQ4F for Windows (Ball and Nordstrom, 1991). The saturation index (SI) of a given mineral is defined as: SI = log10 (IAP/KSP) (Lloyd and Heathcode, 1985)
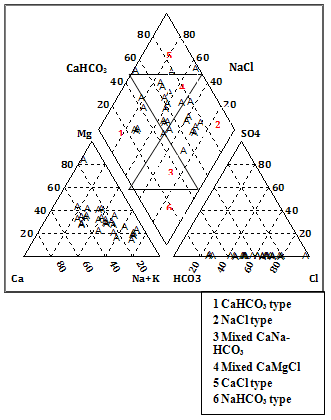 | Figure 2. Piper trilinear diagram for Facies classification |
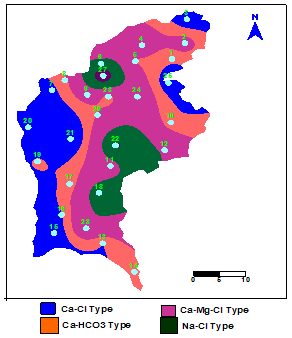 | Figure 3. Spatial distribution pattern of hydrochemical Facies |
 The HCO3 may also be derived from the dissolution of silicate minerals, Orthoclase, Plagioclase, Hornblende, Diopside, Hypersthene, Olivine and Biotite of country rocks of the area by the carbonic acid (Tesoriero et al., 2004). A general reaction for the weathering of silicate rocks with carbonic acid is as follows:(Cations) silicates + H2CO3 = H4SiO4+HCO3+cations +solid products (mostly clay minerals)Binary plots of (Ca + Mg) versus (HCO3 + SO4) (Fig.4) were examined to study the relative importance of ion exchange and different weathering processes. If Ca, Mg, SO4 and HCO3 are derived from a simple dissolution of Calcite, Dolomite and Gypsum, a 1:1 stoichiometry of (Ca+Mg) to (SO4+HCO3) should exist (McLean et al., 2000). When ion exchange takes place the points shift right due to excess Ca + Mg over SO4 + HCO3. If reverse ion exchange is the process, it will shift the points to the left due to a large excess of Ca+ Mg over SO4 + HCO3. The plot shows that 60% of the groundwater samples are clustered below the 1:1 line representing reverse exchange and 40% of the samples clustered above point toward ion exchange process indicating, portion of the HCO3 + SO4 must be balanced by Na and K by calcium and magnesium in clay material.
 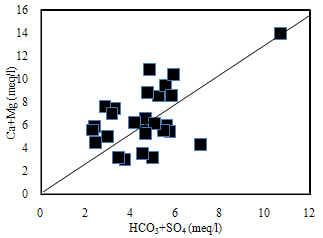 | Figure 4. The plot for (Ca + Mg) versus (HCO3 + SO4) |
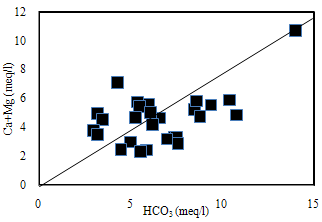 | Figure 5. The plot for (Ca+Mg) versus HCO3 |
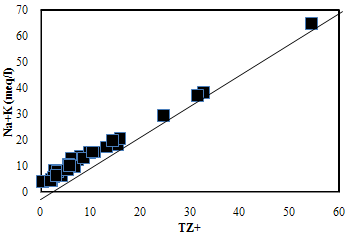 | Figure 6. The plot for Na+K versus TZ+ |
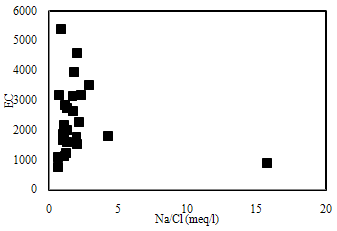 | Figure 7. The plot for Na/Cl versus EC |
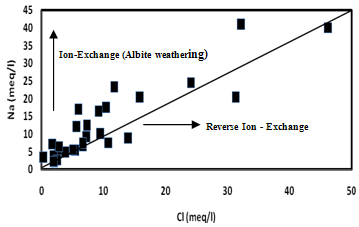 | Figure 8. The plot for Na versus Cl |
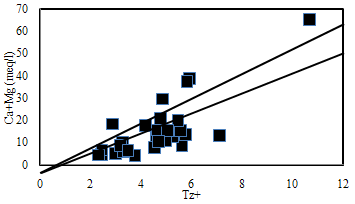 | Figure 9. The plot for (Ca+Mg) Versus TZ+. |
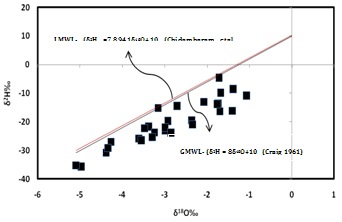 | Figure 10. Relationship between δ18O and δ2H values |
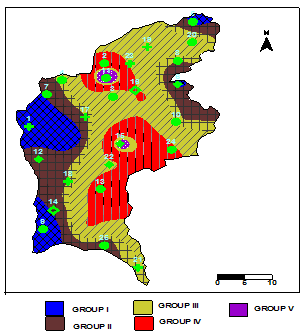 | Figure 11. Spatial pattern of observed water types |
|
4. Summary and Conclusions
- Hydrochemistry data from Thirumanimuttar basin has revealed groundwater is generally neutral to alkaline in nature. As per TDS classification 84% of the samples recorded higher TDS and the remaining 14% represented lower TDS. The abundance of the major cations and anions in the groundwater are of the following order: Cl>HCO3>NO3>SO4>Br>F>PO4 and Na>Ca>Mg>K. The sources of ions into the groundwater are from dissolution and leaching from source rocks, cation exchange and anthropogenic activities. The groundwater is generally over saturated with respect to major carbonate species namely calcite and dolomite and oversaturation was also noted for silicate species like quartz and undersaturation was noted for SiO2(a). The groundwater showed paths of hydrochemical evolution, from Ca– HCO3 type via Ca–Cl type to Na–Cl type; or from Ca– HCO3 type directly to Na–Cl type. This suggests that the groundwater hydrochemistry is controlled by water– rock interaction and anthropogenic pollution. Higher PCO2 was noted in groundwater due to decay of organic matter and root respiration in the soil zone along with loss of CO2 during groundwater flow. The plot of (Ca + Mg) versus (HCO3 + SO4) indicates 60% of groundwater represents reverse exchange and 40% indicates ion exchange process. The plot (Ca+Mg)/HCO3 indicate sources from silicate weathering. The plot for Na + K and total cations (TZ+) indicates that the majority of the samples point out weathering and alteration of quartz in silicate rocks. The plot for Na/Cl indicates ion exchange due to enrichment of Na than Cl. The δ2H versus δ18O diagram shows that the groundwater data plot to the right of the Global Meteoric Water Line and LMWL. The water types were categorized into 5 spatial Groups. Group 1 represents indicates recharge waters with low EC and highly depleted isotopes. Group 2 are the intermediate between recharge and discharge areas with intermediate EC and moderately depleted isotopes. Group 3 represents higher EC values and enriched isotope values. Group 4 is highly affected by pollution with very higher EC and more enriched isotopic composition. The Group 5 represents very high EC and highly enriched stable isotopic composition showing deep circulation and longer residence time.
ACKNOWLEDGEMENTS
- This work was supported by University Grants Commission, India Grant No.F.32-335/2006 (SR). The authors are grateful to Prof.Anindya Sarkar for isotope analysis at IIT, Kharakpur, India.
References
| [1] | Aji, K, Tang, C, Song, S, Kondoh,A, Sakura,Y, Yu, J and Kaneko, S, 2008.Characteristics of chemistry and stable isotopes in groundwater of Chaobai and Yongding River basin, North China Plain, Hydrological Process. 22, 63–72. DOI: 10.1002/hyp.6640 |
| [2] | APHA–AWWA–WPCF, 1995, Standard Methods For The Examination Of Water And Waste Water (19th ed.). New York, USA |
| [3] | C.A.J Appelo, D. Postma, Geochemistry, Groundwater And Pollution. Balkema, Rotterdam, 536, 1996 |
| [4] | C.A.J Appelo, D. Postma, Geochemistry, Groundwater And Pollution. 2nd edn. AA Balkema, Amsterdam, pp649, 2005 |
| [5] | Ball, J.W., Nordstrom, D.K., 1991. User's manual for WATEQ4F, with revised thermodynamic data base and test cases for calculating speciation of major, trace, and redox elements in natural waters: U.S. Geological Survey Open File Report 91183, 92 |
| [6] | Chidambaram, S., Prasanna, M.V., Ramanathan, A.L., Vasu, K., Hameed, S., Warrier, U.K., Manivannan, R., Srinivasamoorthy, K., Ramesh, R., (2009). Precipitation of 2006 southwest monsoon of Tamil Nadu. Curr. Sci. 96-9, 1224-1229 |
| [7] | Clark, I.D., Fritz, P., 1997. Environmental isotopes in hydrogeology. Lewis Publishers, Boca Raton |
| [8] | Craig, H., 1961. Isotopic variations in meteoric waters. Science 133, 1702–1703 |
| [9] | Criss, R.E., 1995. Stable isotope distribution: variations from temperature, organic and water-rock interactions. In: Ahrens TJ (ed) Global earth physics: a handbook of physical constants, AGU Reference Shelf 1 |
| [10] | Criss, R.E., 1999. Principles of stable isotope distribution. Oxford University Press, New York; 254 |
| [11] | Criss, R.E., Davisson, M.L., Kopp, J.W., 2001. Nonpoint sources in the lower Missouri river. Journal of American Water Works Association. 93-2, 112–122 |
| [12] | Datta, P.S., Bhattscharya, S.K., Tyagi, S.K., 1996. 18O studies on recharge of phreatic aquifers and groundwater flow-paths of mixing in the Delhi area. Journal of Hydrolology, 176,25–36 |
| [13] | Deutsch, W.J., 1997. Groundwater geochemistry: fundamentals and application to contamination. CRC, Boca Raton |
| [14] | Dickson Adomako, Abass Gibrilla, Tetteh T. Akiti, Richmond Fianko, Piotr Maloszewski, 2011. Hydrogeochemical Evolution and Groundwater Flow in the Densu River Basin, Ghana, Journal of Water Resource and Protection, 3, 548-561 |
| [15] | Drever, J.I., 1997. The geochemistry of natural waters (3rd ed.). New Jersey: Prentice Hall,436 |
| [16] | Edmunds, W.M., Ma, J.Z., Aeschbach-Hertig, W., Kipfer, R., Darbyshire, D.P.F., 2006. Groundwater recharge history and hydrogeochemical evolution in the Minqin Basin, North West China. Applied Geochemistry, 21, 2148–2170 |
| [17] | Franco Cucchi, Giuliana Franceschini and Luca Zini 2007. Hydrogeochemical investigations and groundwater provinces of the Friuli Venezia Giulia Plain aquifers, northeastern Italy, Environmental Geology, 55, 985–999. DOI 10.1007/s00254-007-1048-4 |
| [18] | Gale, I.N., Robins, N.S., 1989. The Sampling and Monitoring of Groundwater Quality. British Geological Survey. Hydrogeology Report, No. 89/37 |
| [19] | Giggenbach, W.F., 1990. Water and gas chemistry of Lake Nyos and its bearing on the eruptive process. J. Volc. Goethe. Res. 42, 337–362 |
| [20] | Guangxin Zhang,Wei Deng,1 Y. S. Yang and R. B. Salama, 2007. Evolution study of a regional groundwater system using hydrochemistry and stable isotopes in Songnen Plain, northeast China, Hydrological process. 21, 1055–1065 |
| [21] | IAEA a., 2007. Atlas of isotope hydrology. Africa–Vienna. ISBN 978- 92-0-1072707-8 ImesJL |
| [22] | IAEA b., 2007. Global network of isotopes in precipitation (GNIP) Database IAEA/WMO, Vienna, Austria, http://www.isohis. iaea.org. Cited 22 April 2008 |
| [23] | Jankowski, J., Acworth, R.I., 1997. Impact of debris-flow deposits on hydrogeochemical processes and the development of dryland salinity in the Yass River catchment, New South Wales, Australia. Journal of Hydrology. 5-4, 71–88 |
| [24] | Janza, M. 2010. Hydrological modelling in the karst area, Rižana spring catchment, Slovenia. Environmental Earth Science Journal 61, 909-920 |
| [25] | Kebede, S., Travi, Y., Stadler, S. 2010, Groundwaters of the Central Ethiopian Rift: diagnostic trends in trace elements, δ18O and major elements. Environmental Earth Science, 61, 1641-1655 |
| [26] | Kumar, M., Ramanathan, A.L., Rao, M.S., Kumar, B., 2006. Identification and evaluation of hydrogeochemical processes in the groundwater environment of Delhi, India. Environmental Geology. 50, 1025–1039. DOI:10.1007/s00254-006-0275-4 |
| [27] | Lawrence, A.R., Gooddy, D.C., Kanatharana, P., Meesilp, M., Ramnarong, V., 2000. Groundwater evolution beneath Hat Yai, a rapidly developing city in Thailand. Hydrology Journal, 8, 564–575 |
| [28] | Latifa Bouragba, Jacques Mudry J, Lhoussaine Bouchaou, Youssef Hsissou and Tarik Tagma, 2011. Characterization of groundwater in the Souss upstream basin: Hydrochemical and environmental isotopes approaches, African Journal of Environmental Science and Technology, 5(4), 307-315 |
| [29] | Lloyd, J.W., Heathcote, J.A., 1985. Natural inorganic hydrochemistry in relation to groundwater, an introduction. Clarendon Press, Oxford |
| [30] | Ma, J.Z., Ding, Z.Y., Edmunds, W.M., Gates, J.B., Huang, T.M., 2009. Limits to recharge of groundwater from Tibetan plateau to the Gobi desert, implications for water management in the mountain front. Journal of Hydrology 364 (1–2), 128–141 |
| [31] | Mackenzie, F.J., Garrells, R.H., 1965. Silicates: reactivity with water. Science Journal, 1505,57–58 |
| [32] | McLean, W., Jankowski, J., Lavitt, N., 2000. Groundwater quality and sustainability in an alluvial aquifer, Australia. In: Sililo O et al (eds) Groundwater, past achievements and future challenges. A Balkema, Rotterdam; 567–573 |
| [33] | Meybeck, M., 1987. Global chemical weathering of surficial rocks estimated from river dissolved loads. American Journal of Science, 287, 401–428 |
| [34] | Mohan Viswanathan Prasanna, Chidambaram, S., Shahul Hameed, A., Srinivasamoorthy, K., 2009. Study of evaluation of groundwater in Gadilam basin using hydrogeochemical and isotope data, Environmental Monitoring and Assessment, DOI 10.1007/s10661-009-1092-5 |
| [35] | Njitchoua, R., Dever, L., Fontes, J.C.H., Naah, E., 1997. Geochemistry, origin and recharge mechanisms of groundwaters from the Garoua Sandstone aquifer, northern Cameroon. Journal of Hydrology, 190, 123– 140 |
| [36] | Rajmohan, N., Elango, L., 2004. Identification and evolution of hydrogeochemical processes in the groundwater environment in an area of the Palar and Cheyyar River Basins, Southern India. Environmental Geology. 46, 47–61 |
| [37] | Rajmohan, N., Al-Futaisi, A., Al-Touqi, S. 2009. Geochemical process regulating groundwater quality in a coastal region with complex contamination sources: Barka, Sultanate of Oman. Environmental Earth Science, DOI 10.1007/s12665-009-0037-1 |
| [38] | Ruiqiang Yuan, Xianfang Song, Yinghua Zhang, Dongmei Han, Shiqin Wang, Changyuan Tang, 2011.Using major ions and stable isotopes to characterize recharge regime of a fault-influenced aquifer in Beiyishui River Watershed, North China Plain, Journal of Hydrology, 405, 512–521 |
| [39] | Srinivasamoorthy, K., Chidambaram, S., Prasanna, M.V., Vasanthavigar, M., John peter, A., and Anandhan, P., 2008. Identification of major sources controlling groundwater chemistry from a hard rock terrain- A case study from Mettur taluk, Salem district, Tamilnadu, India. Journal of Earth System Science. 117(1), 49-58 |
| [40] | Srinivasamoorthy, K., Nanthakumar, C., Vasanthavigar, M., Vijayaraghavan, K., Rajivgandhi, R., Chidambaram, S., Anandhan, P., Manivannan, R., Vasudevan, S., 2009. Groundwater quality assessment from a hard rock terrain, Salem district of Tamilnadu, India, Arabian Journal of Geosciences, DOI 10.1007/s12517-009-0076-7 |
| [41] | Srinivasamoorthy, K.., Vasanthavigar, M., Vijayaraghavan, K., Sarathidasan, R., Gopinath, S., 2011. Hydrochemistry of groundwater in a coastal region of Cuddalore district, Tamilnadu, India: implication for quality assessment, Arabian Journal of Geosciences, DOI: 10.1007/s12517-011-0351-2 |
| [42] | Stallard, R.F., Edmond, J.M., 1983. Geochemistry of Amazon, the influence of geology and weathering environment on the dissolved load. Journal of Geophysical Research. 88, 9671–9688 |
| [43] | Subba Rao, N., 2006. Seasonal variation of groundwater quality in a part of Guntur district, Andhra Pradesh, India. Environmental Geology. 49, 413–429 |
| [44] | Subbarao, N., Srinivasa Rao, G.,Venkateswara Rao, S., Madhusudhana Reddy, P., John Devadas, D., 1999. Environmental control of groundwater quality in a tribal region of Andhra Pradesh, India. Journal of Geological Society of India. 71(4), 299–304 |
| [45] | Subramanian, V., Saxena, K.., 1983. Hydrogeochemistry of groundwater in the Delhi region of India, relation of water quality and quantity. In: Proceedings of the Hamberg symposium IAHS publication no. 146 , 307–316 |
| [46] | Tesoriero, A.J., Spruill, T.B., Eimers, J.L., 2004. Geochemistry of shallow ground water in coastal plain environments in the south-eastern United States: Implications for aquifer susceptibility. Applied Geochemistry. 19, 1471–1482 |
| [47] | Vasanthavigar, M., Srinivasamoorthy, K., Vijayaraghavan, K.. Rajivganthi, R.; Chidambaram, S., Anandhan, P., Manivannan, R., Vasudevan, S., 2010. Application of water quality index for groundwater quality assessment: Thirumanimuttar sub-basin, Tamilnadu, India, Environmental Monitoring and Assessment. DOI: 10.1007/s10661-009-1302-1 |
| [48] | Vengosh, A., Keren, R., 1996. Chemical modifications of groundwater contaminated by recharge of treated sewage effluent. Journal of Contaminant Hydrology. 23, 347– 360 |
| [49] | Wayland, K.G., Long, D.T., Hyndman, D.W., Pijanowski, B.C., Woodhams, S.M., Haack Sh, K. 2003. Identifying relationships between base flow geochemistry and land use with synoptic sampling and R-Mode factor analysis. Journal of Environmental Quality. 32, 180–190 |
| [50] | Wodeyar, B.K., Sinivasan., K., 1996. Occurrence of Fluoride in the groundwaters and its impact in Peddavankahalla basin, Bellary district, Karnataka – a preliminary study. Current Science. 70-1, 71-74 |
| [51] | Zhang, J., Huang, W.W., Letolle, R., Jusserand, C., 1995. Major element chemistry of the Huanghe (Yellow River), China—weathering processes and chemical fluxes. Journal of Hydrology. 168, 173–203 |
| [52] | Zhu, G.F. , Li Z.Z , Su Y.H, Ma J.Z, Zhang, Y.Y, 2007. Hydrogeochemical and isotope evidence of groundwater evolution and recharge in Minqin Basin, Northwest China, Journal of Hydrology, 333. 239– 251 |
| [53] | Zongyu Chen, Zhenlong Nie, Guanghui Zhang, Li Wan and Jianmei Shen, 2006. Environmental isotopic study on the recharge and residence time of groundwater in the Heihe River Basin, northwestern China, Hydrogeology Journal,14,1635–1651 |
 Abstract
 Reference
 Full-Text PDF
 Full-text HTML