E. C. Merem1, Y. Twumasi2, J. Wesley1, M. Alsarari1, S. Fageir1, M. Crisler1, C. Romorno1, D. Olagbegi1, A. Hines3, G. S. Ochai4, E. Nwagboso5, S. Leggett6, D. Foster1, V. Purry1, J. Washington1
1Department of Urban and Regional Planning, Jackson State University, Jackson, MS, USA
2Department of Urban Forestry and Natural Resources, Southern University, LA, USA
3Department of Public Policy and Administration, Jackson State University, MS, USA
4African Development Bank, AfDB, Avenue Joseph Anoma, Abidjan, Ivory Coast
5Department of Political Science, Jackson State University, Jackson, MS, USA
6Department of Behavioral and Environmental Health, Jackson State University, Jackson, MS, USA
Correspondence to: E. C. Merem, Department of Urban and Regional Planning, Jackson State University, Jackson, MS, USA.
| Email: |  |
Copyright © 2019 The Author(s). Published by Scientific & Academic Publishing.
This work is licensed under the Creative Commons Attribution International License (CC BY).
http://creativecommons.org/licenses/by/4.0/

Abstract
In the last several years, the degradation of natural areas has been occurring at an alarming proportion. Open spaces that provide habitats to different life forms are being degraded because of improper management practices, contamination, and the desire to sustain societal needs for housing, transportation etc. In the process, habitat loss stands as one of the most significant threats to biodiversity and a major environmental problem facing society. In the literature, the loss, degradation and alteration of habitats are the primary factors responsible for the global disappearance of rare species of wild animals and plants. While some may assume that habitat destruction and loss of biodiversity are problems of species rich developing nations, it has become a serious problem in the United States (US). In the state of Mississippi, most of the bottomland hardwood forests and significant portions of thousands of acres of wetlands and streams have been degraded because of sedimentation and agricultural runoff fueled by intense farming activities. Notwithstanding previous mitigation measures, there has not been a substantial effort to examine these issues alongside current initiatives in habitat conservation in Mississippi. To fill that void, the paper examines the issues in wildlife habitat conservation as well as current initiatives with emphasis on the trends and factors using mixscale methods built on integrated Geographic Information Systems (GIS) and descriptive statistics. On the one hand, the temporal profile from the results point to changes in the form of gains and declines in the Conservation Reserve Program (CRP) land areas with the Central and Northeast region outpacing the Southwest zones of the state coupled with degradation. On the other, GIS mapping of change, not only showed the concentration of vast natural areas dispersed statewide, but pinpointed clusters of habitats slated for restoration and mitigation. With changes attributed to unsustainable land use practices, policy lapses, limited education and poor monitoring, community efforts remain in high gear among stakeholders to ensure habitat protection. Accordingly, the paper proffered solutions based on the need for conservation, adherence to best management practices, education and support for local participation.
Keywords:
Wildland management, Degradation, Restoration, GIS, Factors, Efforts
Cite this paper: E. C. Merem, Y. Twumasi, J. Wesley, M. Alsarari, S. Fageir, M. Crisler, C. Romorno, D. Olagbegi, A. Hines, G. S. Ochai, E. Nwagboso, S. Leggett, D. Foster, V. Purry, J. Washington, Assessing Issues in Wildland Habitat Management in the State of Mississippi, Frontiers in Science, Vol. 9 No. 1, 2019, pp. 5-19. doi: 10.5923/j.fs.20190901.02.
1. Introduction
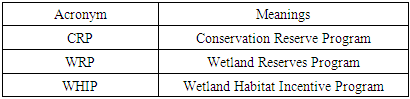
In the last several years, the degradation of natural areas has been occurring at an alarming proportion [1], and in the process, humans have drastically transformed landscapes to meet our needs from housing, transportation, food to other uses [2]. The current rate of global extinction for plants and animals, attributed to anthropogenic events [3-5], surpasses several times the normal levels since the beginning of human existence [6, 7]. For that, critical habitats essential to the preservation of different life forms are being converted to competing land uses fraught with poor management practices regularly [8]. Recent studies show a link between loss of habitats and global disappearance of rare species of flora and fauna [9-11]. With the increasing pressures on the environment, decision makers have turned to different conservation strategies to protect global ecosystems [12-14]. Since site conservation is among the most effective means to reduce global biodiversity loss [5], it is critical to identify places where unique biodiversity must be conserved immediately like Mississippi [15-19]. Given the limited resources to do so, common strategy involves turning at risk sites into protected areas [1, 11, 20-23].With a commonly held belief that habitat’ destruction and loss of biodiversity are problems of species rich developing nations, it is now becoming a serious problem confronting the United States, given an estimated loss of 2.2 million acres of land to development each year [24, 25]. At the same time, more than half the nation’s wetlands have been filled since the American revolution [26-31]. Considering that, habitat loss stands as one of the most significant threats to biodiversity and a major environmental problem facing society [32-34]. The restorations of former riparian habitats on both public and private lands occurred in the lower Mississippi Valley with over 25,000 hectares of national wildlife refuges reforested. Although various land-use practices (WRP, CRP, WHIP) and others have been implemented since 1992 under existing frameworks. The Wetland Reserves Program (WRP) stands out as the major initiative for the afforestation of forested wetlands within the lower Mississippi valley. These conservation programs quickened the afforestation of 180,000–220,000 hectares of bottomland hardwood in the zone [35]. This scheme created new forests essential for CO2 sequestration.Aside from these services [36], in the state of Mississippi most of the bottomland hardwood forests and thousands of acres of wetlands and streams in the Delta region have been degraded because of sedimentation and agricultural runoff fuelled by intense farming activities [37]. Also, the remnants of bottom land hardwoods and wetlands in the Delta, the Black Prairies and upland hardwoods in the Eastern portion of the state and the long leaf pine ecosystem in the Southern part are now habitats of special concern [37]. Along the Mississippi Gulfport region, coastal resources such as pine savannahs, pitcher plant bugs, coastal dunes, and marshes as well as aquatic habitats mostly rivers, lakes and streams located in Hancock, Harrison, and Jackson counties have come under intense threats by human activities [38]. Seeing that the most significant threat to biodiversity now involves the fragmentation of animal and plant habitats [5, 39, 40]. Ensuring the preservation of these diverse species and their services now requires the restoration of natural habitats [41-45]. To achieve that, several plans like the Mississippi conservation strategy aimed at protecting many species and large areas of land are now in place at the regional level to guide towards sustainable wildlife land management [46, 47].With the implications for biodiversity, there is now an urgent need in research to examine these issues in order to furnish managers the vital tools for habitat and species recovery. Thus, wildlife habitat can be an integral part of all working landscapes through careful management by landowners, industry and others within and outside of protected areas [48-50]. Under existing policies, habitat protection is still being hindered in the US and Mississippi. Added to that, there has not been any major efforts to assess these issues and the mitigation initiatives in Mississippi. With such a void in research, this paper examines the issues in wildland habitat management in the state. This project has four objectives. The first objective provides an update to the literature. The second aim is to usher in essential tools for decision making in habitat management, while the third objective is to analyze issues associated with wildlife habitat degradation. The fourth objective is to examine ways of identifying wildlife habitat indicators that are essential for conservation and policymaking. The paper is divided in five parts. The first and second sections covers the introduction and methodology. The third section presents the results, the factors responsible for the problems and efforts, while section four highlights the discussions and recommendations. Section five contains the closure of the research.
2. Method and Materials
The study area of Mississippi shown in Figure 1 is largely a rural state located in the South East zone of the United States. With an estimated population of 2.99 million inhabitants and 82 counties. Forest land (19.8 Million acres) covers 65% of the entire area of the state [51-53]. Besides, the Mississippi area presents a unique opportunity for the study of wildlife habitat management due to its diverse soil types, vegetation and the concentration of different species. Given its vast array of species richness, the state has two main land regions, the Mississippi Alluvial Plain and the East Gulf Coastal Plain. 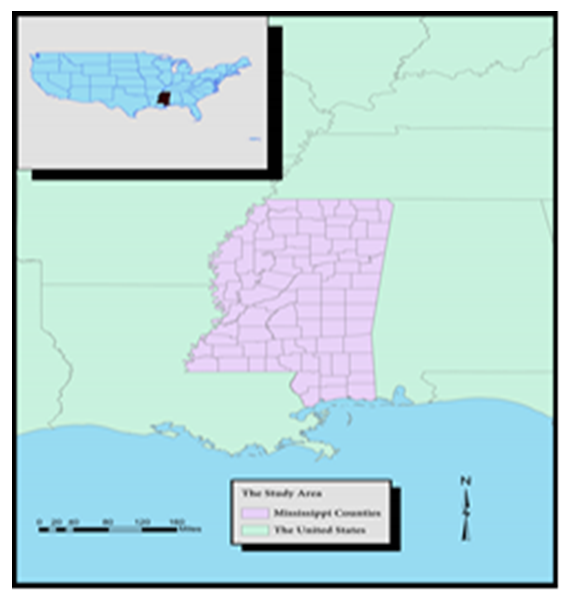 | Figure 1. The Study Area, Mississippi |
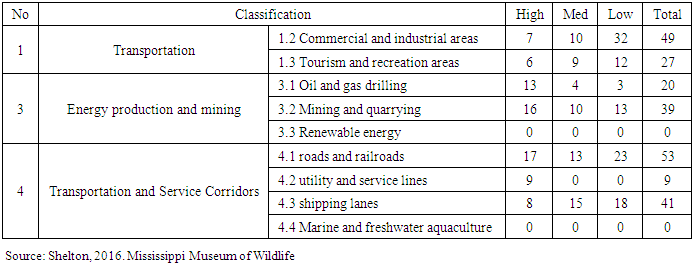
The Mississippi Valley Alluvial plain known as the Delta extends through the entire western edge of the state. It consists of fertile lowlands that forms part of the 35,000 square mile Alluvial Plain of the Mississippi River. This landscape stretches on to other ecological systems made up of the Yazoo, Tallahatchie and Coldwater rivers [54, 55]. With the Alluvial Plain’s bottomland hardwood forests and prairie in the high grounds, the rivers in this region are habitats for over 206 native fish species [38]. The Eastern Gulf Coastal Plain ecoregion, which spans across the southernmost part of Mississippi and nearly half a dozen states, contains mild landscape and sandy soils with wetlands and bayous rich in biodiversity. The coastal plain with its extensive network over the state East of the Delta and categorized by prairies and low lands, remains under threat. While the study area stands as one of the most intensively farmed regions in the United States with several million acreages of cotton, rice, soya beans, corn, and catfish grown annually. It is now estimated that 80% of the region’s bottom wood wetland forest have been converted partly by large drainage and flood control projects. The impact presents a whole range of problems in wildlife habitat protection in the region. In addition to abundant wildlife, such as white-tailed deer, mourning dove, and the invasive feral pig, the state also harbors quite a few unique and imperilled species. Additionally, Mississippi’s rich habitats, from its coastal marshes to interior pine-dominated terrain, supports over 900 vertebrate species, and numerous invertebrate species. This comes with sanctuaries to over 24 million migrant songbirds and 5 million waterfowl, and 200 rookeries of wading birds and seabirds [56]. Seeing the level of threats to biodiversity in the state, about 297 species from wood stork to Louisiana black bear are now designated as “in greatest conservation need,” or SGCN [38, 46, 47]. Lesser-known animals in need of conservation include many species of bat, freshwater crayfish and others found in the Tombigbee drainage of the Upper East Gulf Coastal Plain [46, 47]. Although threats to the distinct areas within Mississippi vary, but human development for agriculture, forestry or resource extraction, transportation and others have impacted the landscape. Realizing that landowners should be part of the solution, the issue is compounded by population surge and growth pressures on sensitive natural habitats along the major ecozones (Table 1). These threats could be properly tracked by assessing the issues in wildland management using a mix scale approach [54, 55, 57].Table 1. Development Threats Ranked for Each Sub-Habitat Type
 |
| |
|
2.1. Method Used
The paper uses a mix scale approach involving descriptive statistics and secondary data connected to GIS to analyze the growing challenges of wildlife habitat conservation among counties, and regions in the South East state of Mississippi in the United States. The spatial information for the research was obtained from various sources including the University of Maryland Online Data services, National Oceanic and Aeronautical Administration (NOAA), the United States Geological Survey (USGS) and The Mississippi Automated Resources Information System (MARIS 2003). The others include the United States Environmental Protection Agency (US EPA), the Mississippi Department of Environmental quality (MDEQ), the government of Mississippi, Mississippi State University (MSU), the Department of Wildlife and Fisheries, the Environmental Working Group (EWG) Conservation Data Base, the National Fish and Wildlife Foundation (NFWF) and Mississippi Wildlife Federation. In addition to that, Ducks Unlimited, Delta Wild Life Inc, the United States Department of Agriculture (USDA), the US Department of Interior and the National Wildlife Refuges also provided other information needed in the research. On the one hand, the archives of the National Research Council (NRC), the United States Conservation Reserve Program (CRP), The American Forest Foundation and Natural Resources Conservation Services (NRCS) provided some of the secondary information needed in the enquiry especially the time series data. On the other, notable insights pertinent to the study were gleaned from the Mississippi Department of Fisheries, Wildlife and Parks (MFWP), the United States Department of Fish and Wild life Service, the Lower Mississippi Valley Joint Venture, the Nature Conservancy, Nature Conservancy Mississippi, Environmental Law Institute and the South East Aquatic Resources Partnership (SARP) were instrumental as well. The additional data needs pertaining to agricultural statistics, wetland acreage information, habitat areas and incentive program came from the various entities including the United States Department of Agriculture (USDA) Farm Service Agency (FSA) and the Environmental Working Group (EWG). Since the regional and federal geographic identifier codes of the state, the counties and the regions were used to geo-code the info contained in the data sets. This information was processed and analyzed with basic descriptive statistics, and GIS with attention to the temporal-spatial trends at the county, state and regional levels in the Deep South of Mississippi. The relevant procedures consist of two stages listed below.
2.2. Stage 1: Identification of Variables, Data Gathering and Study Design
The initial step in this research involved the identification of variables required to analyse the extent of wild habitat conservation issues, and initiatives and ventures and changes at the state, county and regional levels from 1996 to 2016. The variables consist of socio-economic and environmental information of development threats, bottomland timber established on wetland, wetland restoration, wildlife enhancement grass, and permanent wildlife habitat, non-easement. The others consist of wildlife food plot, habitat for upland birds, permanent wildlife habitat, shallow water areas for wildlife, CRP acreage state wide, CRP acreage for regions, conservation reserve program for Mississippi and wildlife habitat incentives programs payments. Added to that are the spending for farm ranch and land management, number of contracts, restoration projects, some selected restoration, acres impacted, habitat type, project name and natural resource damage cost. These variables as mentioned earlier were derived from secondary sources made up of government documents, newsletters and other papers from NGOs. This process was followed by the design of data matrices for socio-economic and land use (environmental) variables covering the census periods from 1996, 1998, 2004, 2006, 2009, 2014, 2015 and 2016. The design of spatial data for the GIS analysis required the delineation of county boundary lines within the study area as well. Given that the official boundary lines within the state, its regions and counties remained the same, a common geographic identifier code was assigned to each of the area units for analytical coherency.
2.3. Stage 2: Data Analysis and GIS Mapping
In the second stage, descriptive statistics and spatial analysis were employed to transform the original socio-economic and ecological data into relative measures (percentages, ratios and rates). This process generated the parameters for establishing the extent of habitat conservation initiatives, development threats, bottomland timber established on wetland, wetland restoration, wildlife enhancement–grass, permanent wildlife habitat, non-easement, and other efforts crucial in the protection and rehabilitation of natural areas and the trends across the regions, the state and the counties through measurement and comparisons overtime. The spatial temporal unit of analysis consists of counties, the state, regions, the boundary and locations where wildlife food plot, habitat for upland birds, permanent wildlife habitat, shallow water areas for wildlife, CRP acreage state-wide and CRP acreage activities for the units flourished. This approach allows the detection of change, while the graphics highlight the actual frequency and averages, impacted areas and the time series, wildlife habitat incentives programs payments, number of contracts, some selected restoration and the size of acres impacted, habitat type, project name as well as natural resource damage costs equivalents. The remaining steps involves spatial analysis and output (maps-tables-text) covering the study period, using Arc GIS 10.4 and SPSS 20.1. With spatial units of analysis delineated as the counties (Figure 1), the study area map indicates boundary limits of the units and their geographic locations. The outputs for each county were not only mapped and compared across time, but the geographic data for the units contained in the boundaries, also includes ecological data of land cover files and paper and digital maps from 1996-2016. This process helped show the spatial evolution and location of various mitigation sites and restoration programs across Mississippi and the trends in land conservation target areas. The other components of the GIS mapping encompass a display of ensuing coastal environmental priority areas and stream habitats rehabilitation geared at quickening the recovery of wildlands from unsustainable use in the study area.
3. The Results
This section of the paper presents the results of the data and environmental analysis of wildland habitat change in the study area. There is an initial emphasis on the temporal outline of the wildland areas under restoration and description of the management of CRP land. This is followed by the regional and monetary aspects of the exercise across Mississippi. The others consist of identification of factors behind the changing structure of wildlands in the areas as well as GIS mappings and the community initiatives towards recovery.
3.1. Distribution of Wild Areas Slated for Restoration 1998-2014
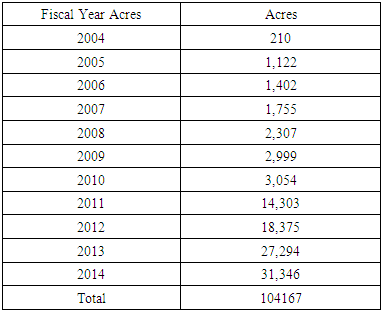
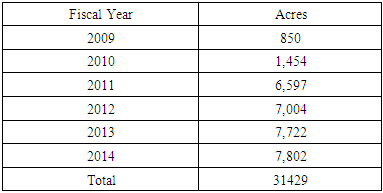
Aside from the low land areas of 204 acres during the fiscal year 2004, the distribution range indicates that the CRP aimed at bottom land timber established on wetland reached a total of 104,167 acres. While this covered an average of 94,369 acres all through a ten-year span of 2004 to 2014. By the following years, the amount of land area dedicated to bottom land timber designed for marshes in 2005-2006 and 2007 opened in the very low thousands of acres (1,122, 1,402 to 1,751). By 2008 through 2011, the areas set aside for bottomland forests in wetlands rose gradually from 2,307, 2,999 to 3,054 acres. As the years went by in 2011-2014, bottom land forest marshes showed additional increases of 14,303, 8,375 acres and 27,294 to 31,346 acres (Table 2). Even at that, the wetland restoration activities tied to the CRP fluctuated remarkably through the years as well. In the case of other notable initiatives throughout Mississippi to ensure wetland rehabilitation in 1998 to 2014, out of the total of 169,150 acres and the average value of 9,950 acres in place, the wetland restoration size in 1998 to 1999 for Mississippi moved from 703 to 2,624 acres. The trend continued at 7,909 to 9,024 acres by 2001 to 2002. With time in the state, wetlands recovery size stabilized at over 80,000 acres between 2002 to 2004, but only to jump again (10,374 to 10,802 acres, 11,509 and 12,996 acres) in 2005 through 2008. The wetland restoration coverage as the tabular distribution indicates, reached its highest level of over 13,000 acres between 2009 through 2012 until it dropped gradually from 2013 to 2014. Considering the identical levels (13,085 to 13,091 acres) in restored areas during 2011 and 2012. The rehabilitated parts (13,939 to 13,733 acres) in that period outpaced the other periods, while in 2013-2014 Mississippi restored close to over 12,000 acres of wetland respectively under the CRP program as required (Figure 2). Aside from the fact that, the wild life enhancement areas for grass in the state stood at 31,429 acres overall from 2009 to 2014. The wild life enhanced surroundings not only rose over time, but they covered sizable areas beginning with 850, 1,454 to 6,597 acres from 2009 to 2011 fiscal years. In the ensuing periods (2012, 2013, 2014), the amount of land set aside for grass enhancement rose significantly from 7,000, to 7,221 and 7,802 acres respectively (Table 3).Table 2. CRP Acreage in Mississippi for Practice: Bottomland Timber Established on Wetland
 |
| |
|
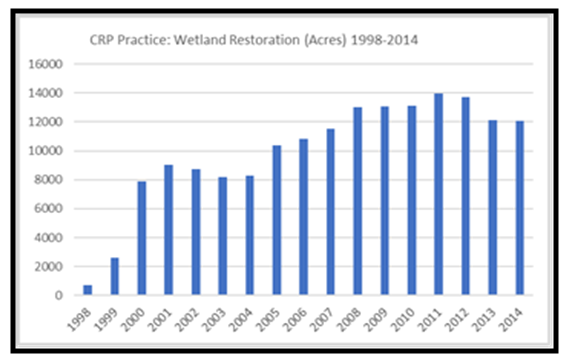 | Figure 2. CRP Practice: Wetland Restoration Acres in Mississippi 1998-2014 |
Table 3. CRP Practice: State Acres for Wildlife Enhancement
 |
| |
|
3.1.1. Wildlife Habitats under the CRP Management
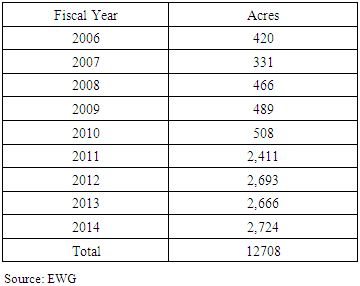
In the study area where the CRP permanent wildlife habitat, non-easement area of 47324 acres averaged about 2490 acres. The available permanent wild areas fluctuated extremely from barley 2 acres to 1395 and 1,769 acres in the first years (1996 through 1998). Beginning in the periods 2000 to 2004, the acres of land allotted to permanent wild life habitat exceeded the 2000 acre category. In the ensuing years of 2005 to 2010, the same pattern holds again for Mississippi with much of the permanent wild life habitat, non-easement area estimated at over 2000 acres. By 2011 through 2014, the space devoted to wild areas rose significantly from 5,336 acres to 4,076 acres respectively. With time, both 2011 and 2012 emerged as the periods Mississippi earmarked more land areas to non-easement in wildlife habitat protection [58]. Given the significance of nourishment as a necessity for biodiversity recovery, the size of areas devoted to wildlife food production in Mississippi at a total of 76,635 acres between 1996 through 2014 reached an average of 2,490 acres in the entire periods. Further look on the temporal profile for the state, points to over 2,000 to 3,000-acre plus (2,648-2,576 to 3,248, 3,398, to 3,887 acres) land areas reserved for wildlife food plots in the state in the periods 1996, 1997, 1998, 1999 and 2000. As the years went by, between 2001 through 2011, wildlife food plot exceeded 4,000 acres with the highest concentration of largest food plot areas (4,896, 4,892 to 4,927 acres) much more evident around the years 2001, 2002, 2003 and beyond. Notwithstanding the food plot areas of 4,448-4,468 acres set aside for wildlife between 2004 through 2005 in Mississippi, the periods 2005 to 2010 did standout noticeably with half a dozen large food plots estimated at 4,468 to 4790 acres compared to the 2012, 2013, and 2014 when the land area stood at 3,517, 3,149, and 2,957 acres (Figure 3). Regarding habitat for upland birds, Mississippi averaged 1,412 acres out of a total of 12,708 acres all through 2006 to 2014. Of these land areas, note that habitat for upland birds in the low and mid hundreds seemed fully spread out across the fiscal years 2006 to 2010. From the information, the sanctuary for upland birds started at 420 to 331 acres from 2006 to 2007, by 2008 through 2009 and 2010, the habitat size rose further from 466, 489 to 508 acres. In the remaining years (2011 to 2014) birds’ habitats along the upland portions of the state surged remarkably by 2,411 to 2,693 acres and 2,666 to 2,724 acres.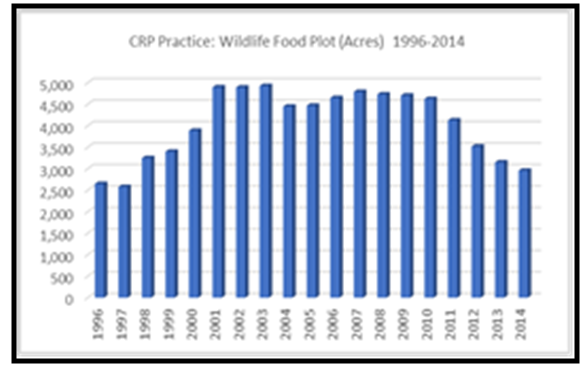 | Figure 3. CRP Practice; Food Plot Areas 1996-2014, Source, EWG |
Table 4. CRP Practice: Habitat for Upland Birds
 |
| |
|
Additionally, the CRP’s practice devoted to permanent wildlife habitat for Mississippi during 1996-2014, shows an overall area of 115,997 acres covered by the program at an average of 6,105 acres. Based on the info gleaned from table, the habitat areas started at a remarkably high level of 18,404 to 15,425 acres in 1996 and 1997. While those early periods represent the largest levels, the wildlife land areas fluctuated continuously throughout the successive years by 6,664 to 5,705 acres between 1998 to 1999. The trends continued further during 2001 and 2004 by 6,294 to 6,044 acres followed by visible declines of 5,630 and 5,582 acres in 2005 to 2006. In the other years (2008-2011), the skid in permanent wild life habitat went unabated by 6,529, 6,441, 6,121 to 1,196 acres coupled with drastic drops of 851 to 871 acres between 2013 through 2014. In the other words, between 2011 through 2014, permanent wild life habitat dropped from 1,196 to 1,164 and 851 to 817 acres (Figure 4). In the context of shallow water areas for wild life in the study area, at an average of 895 acres and a total of 17,008 acres, the table shows an initial increase of 1,318, 1,190, and 1,209 acres between 1999 to 1998. However, by 1999 to 2005, a downward slide emerged beginning with 924-910 acres and 910 to 970 acres in 2004 through 2005. With time came a slight surge in the 1,000 plus categories as shown by the acreages (1,101, 1,158 to 1,005 acres) set aside for shallow water areas in Mississippi between 2006 to 2008. Furthermore, in the periods 2009 through 2014, the area of the state’s shallow water habitats fluctuated again (by 988 to 802 acres, 771, 656 and 573 to 606 acres) respectively. In the last years (2008, 2009 and 2010) based on the table, the study area had more shallow water habitats compared to the later years (Figure 5).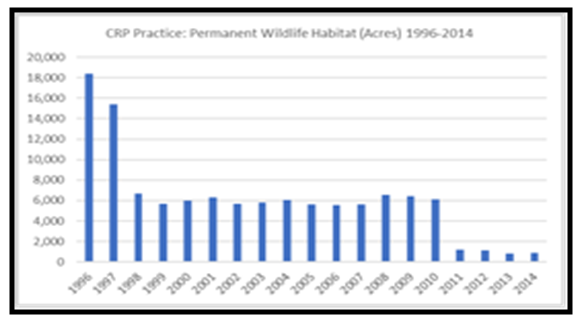 | Figure 4. CRP Practice: Permanent Wildlife Habitats 1996-2014 |
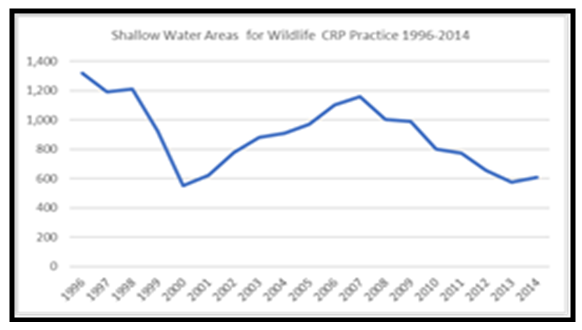 | Figure 5. Shallow Water Areas for Wildlife under CRP Practice 1996-2014 |
3.1.2. The Regional and State Trends In the CRP and the Financial Aspects
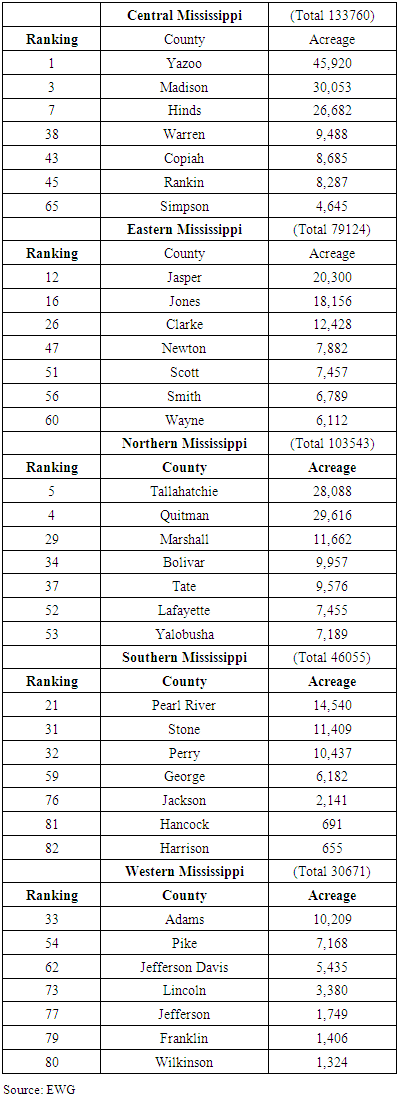
Among the top 10 counties involved in the distribution of CRP in Mississippi, note that of the total of 299,327acres enrolled, Yazoo, Panola and Madison held the top three spots with largest acreages estimated at 45,920, 42,844 and 30,053. The next group of four counties most notably Quitman, Tallahatchie, Chickasaw and Hinds contained relatively identical sizes of land (29,616, 28,088, 27,052-26,682 acres) earmarked for the CRP in 2014. The remaining three counties Noxubee, Holmes and Pontotoc ranked 7,8,9 also posted appreciable sizes of land (23,741, 22,836 to 22,495 acres) devoted to the CRP [58]. At the regional level, both Northern and Central Mississippi areas not only emerged as the two leading places in CRP in the state with enrolled land areas of 133,760 to 103,543 acres, but Eastern Mississippi also devoted 79,124 acres in CRP in the fiscal year 2014. Elsewhere, both the Southern and Western zones of Mississippi finished behind the leading counties with a total of 46,055 to 30,671 acres in the same category of the CRP program (Table 5).Table 5. CRP Acreage for Mississippi Regions 2014
 |
| |
|
Regarding what transpired state-wide all these years, the overall CRP for Mississippi involves sizable land area of 17,501,252 acres at an average of 921,119 acres between 1996-2014. From the table, the size of land in the CRP program from 1996-2003 vacillated between 800,000 plus acres to over 700,000 acres respectively. For that, in the first four years, Mississippi saw its CRP land areas move from 831,837-800,845 acres to 780,664-759,414 acres all through 1996 to 1999. In fiscal years 2000-2001 to 2002-2003, the size of land devoted to the CRP program for Mississippi fluctuated further again by 791,432 to 852,361 acres and 867,584 to 889,362 acres. Between 2004 to 2006, the CRP area jumped to the 900,000-acre levels (928,563 to 942,064, 954,367) respectively than in the previous years. Although during the fiscal years 2007 through 2012, the CRP program land area exceeded the 1-million-acre mark with notable fluctuations starting from 1,076,837-1,015,023 acres to 1,048,973-1,044,405 acres in 2007 to 2008 and by 2009 through 2010. The highest levels in CRP acreages (1,025,467-1,002,149) continued further in 2011-2012 only to drop in 2013 and 2014 to 955,924-933,981 acres (Figure 6). When it comes to wild life habitat incentives programs payments, Mississippi paid out a total of $8,928,175 on transactions executed through 2,786 contracts from 2004 through 2015. With the rising spending levels ($27,561 to $178,000 and $253,403-$362,088) in the first four years (2004-2007). The amount of CRP money doled out in Mississippi rose further ($411,005-$767,923) in 2008 to 2009. In the subsequent periods, the spending on farm ranch, and land management reached all-time highs ($1,066,924-$1,973,078 and 1,613,647,1,056,774 to $1,032,103) from 2010 through 2014, but only to fall to $185,669 in 2015 [58].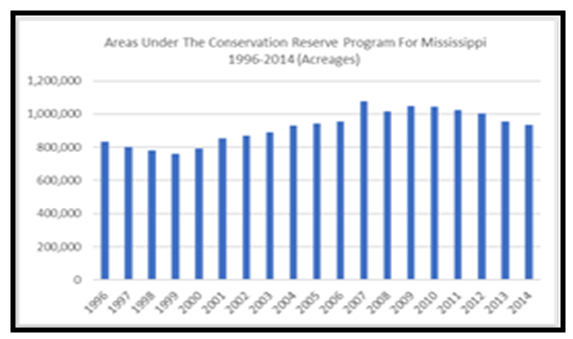 | Figure 6. CRP For Mississippi 1996-2014 Acreages. Source, EWG |
3.2. GIS Mapping and Spatial Analysis
The GIS analysis consists of spatial profile of areas targeted for habitat recovery and conservation programing involving streams and coastal locations under different categories. The analysis also centers on visual presentation of the geographic patterns in the distribution of priority sites under focus as well as marshes and the others in the study area over time.Bearing in mind the extent of actual degradation of habitats in Mississippi’s different counties and regions in 2017. There exist ongoing mitigation measures directed at several wildlife stream habitats. Beginning from the upper central or middle zone and the lower Southern region. The projects under consideration as displayed under the map legends are characterized by green and blue colors denoting approved and pending respectively. The three watersheds as habitats for several ecological services in the Northeast (Cold-water river, Black Mountain Creek and Buthatchie River 2) share common classification identity tied to pending projects. Elsewhere near to the lower edge, comes another group of watersheds identified as Buckatuna Creek and Bayou Pierre phase 2 under the pending column. Moving further up and below in green color emerges a trio of approved mitigation sites in green concentrated at Buthatchie River 1-3 with two of that tied to MDOT. The remaining areas approved for mitigation are in Central Mississippi and the Southern region where MDOT Pearl River Basin, Pearl River Valley, Bayou Pierre phase 1 and Wolf River stood out as the leading sites. Interestingly, the spatial distribution of the mitigation tasks set aside across the watersheds does mirror a regional pattern in the state of Mississippi, where ecosystem and habitat rehabilitation are ongoing. This means that there is a regional balance in terms of challenges, together with the habitat mitigations measures in place in the state (Figure 7).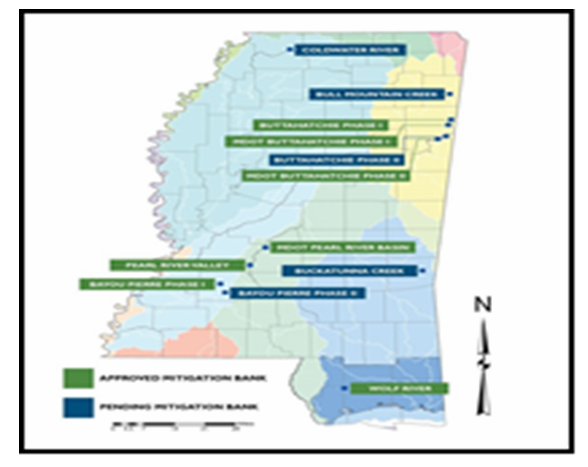 | Figure 7. Sites of Habitat Mitigation Banks 2017 |
Seeing the scope of their ecological services, coastal streams and habitats in the study area are now integral part of conservation schemes currently in place in the zone. Given that these coastal streams provide refuge and ecological linkages. Being on the lower side of the state, the Mississippi Gulf coast consists of essential network of habitats and transit points for many neo tropical migratory birds. Additionally, migratory creatures of importance in Mississippi coastal rivers and marine waters encompasses those listed under state and federal endangered species guidelines. With 9 to 8 rivers and several natural streams that drain the Mississippi coast. The ecological richness has generally been underestimated and damaged. In cities, where few of the small sites have seen severe change for drainage design. Watershed restoration on the three major coastal counties of Hancock, Harrison and Jackson are of vital importance. Though the counties of Hancock and Jackson each account for 2 stream habitat locations slated for rehabilitation under an action plan. Harrison county in the middle of the three Mississippi coastal counties contains 5 river systems (Turkey Creek, Coffee Creek, Bear Posti Bayuo,Briackyard Bayou, and Oyster Bayou). The four other river streams marked for the restoration under the plan (Wait Bayou, Bagouga, Rhodes Bayou and Bayuo choiste) stretches through the remaining counties of Hancock and Harrison (Figure 8). 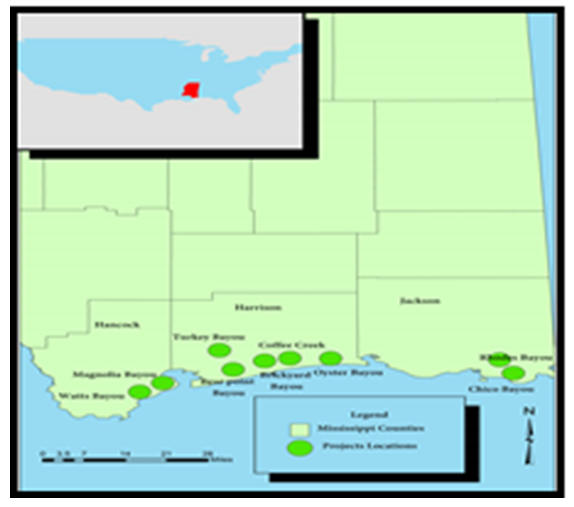 | Figure 8. Stream Habitat Restoration Areas on the Coast |
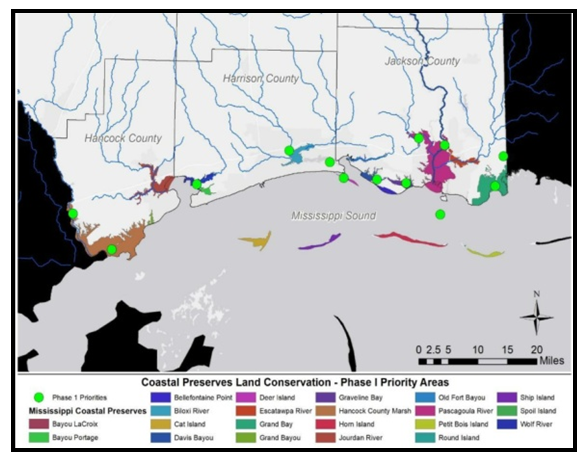
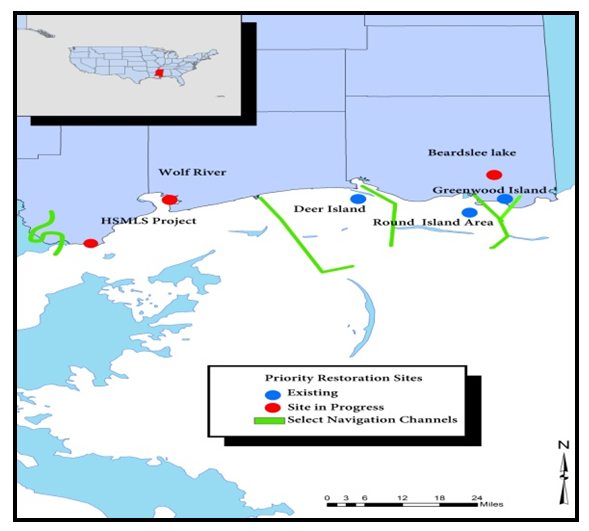
Amongst the land endpoint targets scheduled for conservation in Mississippi’s coastal zone, the three priorities most notably the core of over 500, marsh buffer and protected areas are spread out in different localities under the respective colors of green, blue and light brown. Although the core land conservation priorities in green showed deep concentration in areas adjacent to the protected area corridors around the Northeast corner of the map in Bluff creek above Pascagoula. With time, the initiatives shifted to minor clusters of habitats areas near Biloxi under a network of water bodies bordering Taxomerchi creek on the Southwest axis. From there on re-emerges a vast tapestry of robust land conservation >500 category stretched fully above Gulfport and Bay St Louis within the Northwest and Southwest not far from Pearl River and Hancock. Just as the protected area corridors showed notable presence along the East Central areas and parts of the coast and onto the high seas. The marsh buffer endpoint target areas denoted in blue appeared more on the lower South side of the coast as well (Figure 9). Of the 13 coastal preserves land conservation initiatives, based on the phase 1 priority areas earmarked for the three counties, the 8 initiatives in Jackson county surpassed the others where the priority targets ranged from 3 to 2 for Harrison and Hancock (Figure 10). In the other segments of priority restoration sites marked for action, the existing sites consists of the three areas in Dear land, Road Blend, and Greenwood blend in blue. Closely followed are the sites deemed in progress in Barbie Lake, Wolf River and the HSMLS project alongside the navigational channels spread across the lower side of the coast (Figure 11). Having said that, the ideas behind these efforts also centers on creation, protection, and the facilitation of marsh mitigation. From the information, most of the areas in the coastal counties mirror sites deemed worthy of protection and restoration. They are either in existence or in progress together with select navigational channels that affect the stability of coastal marshes in Mississippi’s Southern region (Figure 11).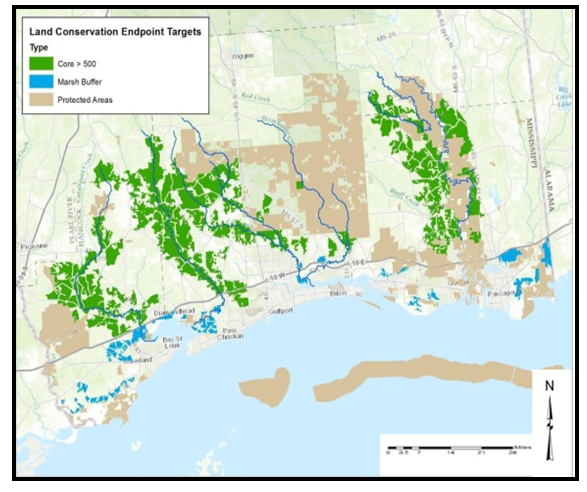 | Figure 9. Land Conservation Target Areas |
 | Figure 10. Coastal land Priority Phase 1 Area |
 | Figure 11. Priority Restoration Sites |
For the purposes of maintaining environmental quality in the coastal zone enriched with the most fragile biodiversity habitats. Opportunity exists for continual recovery and watershed restoration of degraded habitats. Knowing fully well, the level of marsh habitat losses and the need for restoration in the state. The marsh areas listed on the coastal zone from Harrison, Jackson and Hancock along the coastal South often deemed the epicenters of degradation in the past years, are now being targeted for recovery efforts aimed at getting them to their pre-land use forms. The urgency of such intervention remains essential in a state where 10,000 areas of marsh in land have varnished in the past six decades (Figure 12). Other selected areas slated for restoration encompasses multiple localities in 8 different locations that extends to up North, to the Mississippi Delta and the Eastern portion of the state. The highlights of the restoration initiatives show that they are in Bilenux, Quitham and Lafayette in the North as well as Yazoo in the Central Mississippi region. Nearby counties in Eastern Mississippi on the category in the maps extends to the towns of Okeitbha and whoiyha (Figure 13). 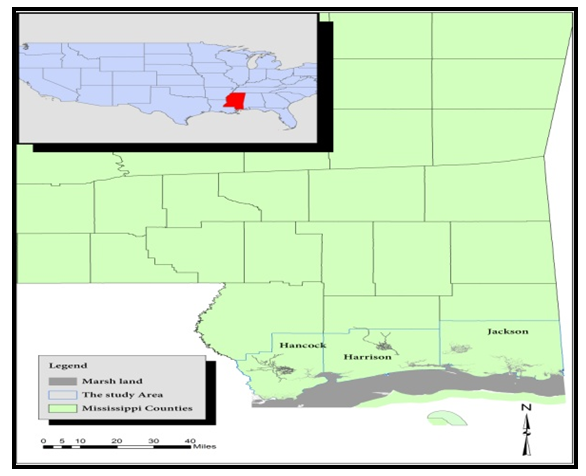 | Figure 12. Marsh Restoration Sites on Coastal Counties |
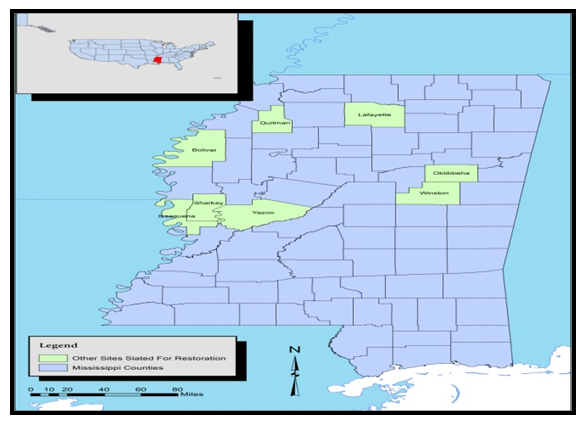 | Figure 13. Other Sites Slated For Restoration |
3.3. Factors Associated with Wildland Habitat Change
This section of the paper presents the factors responsible for the problems. These factors are discussed under three major themes tagged land use practices, policy and socioeconomic changes and the lack of environmental education for the public and monitoring.
3.3.1. Unsustainable Land use Practices and Population
The loss of natural habitats arises from land use practices, such as the expansion of agricultural land areas through unsustainable farm practices involving draining and filling of sensitive wetlands and the logging of forests. This continues to degrade the basic forest soils sustaining the vegetation that offer life support and refuge to a variety of biological species. These problems seem further compounded by habitat fragmentation attributed to the impacts of urban development and highway design for transportation infrastructure near sensitive natural areas. While these practices not only place wildlife habitats in increasing jeopardy, they also threaten biodiversity conservation [54, 55]. Worsening the matter further is that between 2000 to 2010 Mississippi’s population increased by almost 5%. The increase is expected to continue, with a projected population level of over 3 million people by 2030. Such an increase in population will accelerate the demand for housing and other services with even far more pressure on Mississippi’s natural areas. The gravity of the threat posed by both urban/suburban and industrial development stretches to over half the 106 sub-habitat types listed in the state [46, 47].
3.3.2. Policy Lapses and Socio-economic Changes
In the first place, most people only find a need to enforce endangered species act whenever threatened species’ numbers drop to perilously low levels. In that way, the reactive nature and the highly contentious issues and costs involved along with the long wait until the population of endangered species reaches the brink of extinction, reduces chances for successful recovery. Historically, local planning and policies devoted little attention to habitat conservation, and in the process conservation and wildlife agencies have not always used land use planning process effectively for habitat protection. Thus, the opportunity to protect biodiversity through habitat conservation has often been missed. Accordingly, many local planners remain unaware of conservation plans. These has resulted in the lack of integration of policies related to overall economic development goals of local areas into long-term plans to sustain ecological systems during the proposed developments. Furthermore, the socio-economic changes emanating from continuous declines of rural population like aging and the deterioration of rural services and the scramble for infrastructure to meet emerging needs constitutes major concerns in rural communities that affect habitat conservation. Because most natural areas in need of protection are located within the vicinity of rural areas, the success of conservation policies is hampered by the socio-economic changes affecting the countryside [55].
3.3.3. Negation of Education, Research and Monitoring
In several communities within the study area, conservation initiatives are plagued by a general lack of environmental education and awareness among the population on the environmental services rendered by nature. The problem hinders the initiation of conservation programs in some areas. The situation has been worsened in recent years by inadequate communication and dissemination of information campaign on those pressing environmental issues facing stakeholders. There is also the problem of inadequate knowledge of specific regional problems confronting local communities by federal officials who administer federally funded conservation programs. Considering the pace of habitat loss in some areas, there has not been enough effort to assess policy measures through research and monitoring initiatives aimed at improving habitat recovery programs at diverse scales, hence the escalation of the problems.
3.4. Community Based Efforts
From the nature of wildland habitat changes and the threats of degradation amidst the risk exposures facing biodiversity in the study area and the forces propelling them. Several community initiatives have been in the works to ensure recovery in the surrounding ecosystems in Mississippi. For more on the initiatives of various entities involved in instituting the rehabilitation measures, see Appendix 1.
4. Discussion
The assessment of wildland management issues in Mississippi involved the applications of mix scale tools of descriptive statistics and GIS at the state and regional levels. It highlighted the status and nature of changes in various habitat indicators between 1996 through 2014. From the analysis, the degradation of natural areas through habitat loss constitutes a major threat to wild lands, biodiversity protection and a key ecological problem facing the study area. Besides providing ecological services vital to flora and fauna, Mississippi boasts of huge concentration of wildlife species and essential natural habitats vital in wildlife habitat conservation.From the known impacts and stress inflicted on natural habitats, the state still saw notable variations in acreages among the different wildlife habitats (restored areas, food plots and others) during the early years from 2006-2014 and the later periods of 1996 through 2014. The frequency has been growing throughout the years through a mix of gains and declines in wild land areas dedicated to restoration, wild life food plots, bird habitats as well as CRP permanent habitats and wildlife water areas. Considering the regional trends in 2014, the Central, Northern and Eastern Mississippi zones had higher CRP acreage values than the Southern and Western parts of the state. This is attributed to many socio-economic and physical factors in the state.Seeing the proficiency of GIS mappings in showing clusters of areas with vast natural habitats and categories of watershed mitigation and marshlands slated for restoration on the coastal zone of the state. The model was quite instrumental in highlighting assigned restoration indices, and state-wide county areas selected for rehabilitation. In that way, it identified areas affected by wildland degradation and the spatial dispersion of stressors and recovery across the state. Consequently, the study proffered solutions ranging from the need for conservation plans, the adoption of Best Management Practices and effective policy to education and local partnerships to mitigate the risks posed to natural habitats. See Appendix 2 for details of the recommendations.
5. Conclusions
This research assessed issues in wildland habitat management in Mississippi with several interesting outcomes listed as follows. a) abundant wildland and some under conservation; b) restoration of habitats on the rise; c) declining areas evident; d) changes linked to many factors; e) mix scale approach quite efficient.Delineating the immense swaths of land areas, covering habitats restoration as shown in this enquiry remains an important upgrade from prior studies. Besides, Mississippi’s millions of acres in wild land across regions and counties also serve as habitats for biodiversity and as a carbon sink for greenhouse gases. Considering such immensity, in the past years, the state’s vast assets in natural areas continue to assume an essential role in the larger ecosystem and economy. Given the enormity of wildlife habitat assets that span the area, the state saw identical gains (700,000 plus to over a million acres) in the CRP land areas in multiple periods from 1999-2007 at a rate of 29.45%. From the temporal display of state-wide CRP land area’ physical inventory. The areas in Mississippi listed at 1 million plus (1,015,023-1,048,973) acres rose by 3.34% between 2008 to 2009. More so, along these lines, the regional dimension of the state’s natural habitat assets echoes also, the vast richness in the CRP enrolled areas estimated at close to 300,000 acres. These potentials as indicated in the research remains a major boost to the CRP wild land initiatives and planning among the ecozones, regions and counties where ecosystem services and habitat sustainability depend on continual enrolment and inventorying. Considering the size of wild land areas enrolled under the CRP in Mississippi and the frequency of the increments and distribution so far. Information on all these as presented herein, reiterates the importance of periodic highlights of the CRP wild land assets state-wide.Looking at the trends in the state over the years, habitat rehabilitation has seen an upswing in the areas of wetland, wild life food plot, and bottomland timber established on wetland over time. Highlighting the enormous capacities in these natural habitat assets in the study area as established in this enquiry has some upsides. Building on that, the study furnished an index of the state’s large areas of critical habitats essential to the functional capacity of the ecosystem set aside for recovery. In view of the large volumes in acreages among the bio-indicators, the study area maintained a steady level of increases in bottomland timber in wetlands beginning from 2004 through 2014 at an average of over 90,000 acres. In the other periods, the study area saw additional increments in size of areas set aside for bottom land timber for wetlands all through 2005 to 2007. By 2008 to 2011, the land acreages reserved for bottomland forests in wetlands not only grew notably over time, in 2011-2014, the size of bottom land forest marshes also rose substantially. Aside from notable fluctuations in the size of wetland habitat areas under restoration in some periods, Mississippi showed visible consistency in the rehabilitation of marshes spanning from 1998 to 2011. These surge in natural habitat areas via restoration as indicated herein, represents key boast to land owners, biodiversity protection and resource dependent areas reliant on wild land recovery.Amid the numerous fascinating inferences which emerged from this research, the study area saw visible changes in forest acreage in the various habitat types in the form of declines. For that, the analysis demonstrates that there were some notable losses in wildlife habitats in Mississippi. Building on the assessments and the existing info despite some gains that might be linked to restoration initiatives of land owners through the CRP. It is apparent that the size of natural habitat acreages has been tumbling in Mississippi. While the results show that the habitat disappearance may have been a key concern amidst lost acreages over the years, there are traces of declines in the acreages of natural habitat types and their total land area in the state. Of great relevance in the changes in habitat types and their land size in Mississippi over the years, are the deficits in the acreages of permanent wild life habitat, shallow water areas and habitats under the CRP. With the benefits of natural habitats in the state, detecting the changes in the form of declines, therefore ushers in a major step forward for tracing the scale of deficits through improved schemes. Principally, policy makers are now furnished opportunities to gauge the implications by noting the impacts on the ecology with firm strategies across the regions.In accordance with the objectives of the research and the outcomes, the documentation of numerous factors shaping varying trends in wildland habitats use received ample consideration. In that case, most of the things that transpired in the use, conservation, and declines in natural areas in the past years in Mississippi, did not occur in isolation. They are linked to factors situated in the larger nature – human interface occurring in society. In tracing the socio-economic and physical and environmental variables especially the threats of fire outbreaks, land use practices, and population change and lack of environmental education for the public, as well as the encroachment of urbanization and unsustainable farming activities onto fragile natural areas rich in biodiversity. The findings remain a vital contribution to knowledge, underscoring the risks of habitat loss from the draining of wetlands and the logging of forests. The capacity to divulge these elements exemplifies how the experiences of state and regions, and local units can advance awareness towards biodiversity protection. Evaluating relationships between declines and changes in wild land and factors behind them is a manifestation of the timeliness of the enquiry in spotting the parameters of change.The actual use of GIS and descriptive statistics under a mix-scale model in this enquiry shows that the study generated an efficient method tailored to the analysis of wild land habitat trends, emergent changes and the potentials. The development and application of these techniques in the enquiry did display the viability of the method at the state, county and regional level. The use of these procedures along with the results emanating from it, thus, contributes to our knowledge of wild land analysis and the relevance of biodiversity and natural habitat protection. These tools are not only the rudiments for containing habitat change, but they remain the pathways to future use. While the paper highlighted the descriptive statistics portion in underscoring the portraits of change (gains or declines) and the viability of wild land use and habitat conservation activities in Mississippi. GIS was contributory in visualizing the scope of spatial diffusion concerning habitat mitigation, conservation target areas and restoration priorities. With the capacity of GIS in tracking wildland distribution patterns, restoration and mitigation. Highlighting the dispersions is central to managing them efficiently. The proper use of GIS in such manner remains vital in pinpointing areas impacted in wild lands with valuable options for managers and policy makers.The implication of the results as shown herein raises numerous queries for future research and policy that must be responded to and they consist of: what form will variations in wild land areas assume in the foreseeable future? What elements will shape the impending change? What role will institutions play in the restoration of degraded habitats? What patterns will characterize spatial concentration of wild land use? What levels of change will be witnessed over time? Bearing in mind their importance, managers must deal with how to generate answers to these questions in future by refocussing the attention on the conservation of wildlands.
Appendix - 1
3.5. Efforts and Initiatives (Contd.) 3.5.1. Habitat Protection Program Different community-based organizations in the state such as Delta Wildlife and Wildlife Mississippi have been quite active in habitat protection projects. In the case of Delta Wildlife, the organization showed remarkable commitment in nesting programs through the provision of nesting structures for several species such as birds, wood ducks, butterflies and bats. Under the program, each structure is designed to house specific species in accordance with stated guidelines. This was followed with a wildlife seed-planting program that provides members with sudan, milo corn, sunflowers and millet for diverse wildlife species. Wildlife Mississippi also provided similar services by offering low cost seedlings to 13 landowners. This initiative which resulted in the growing of 590 acres of food plots that benefited diversity of wildlife in 2001, was reenacted at Yazoo Mississippi by Lever Board through the active involvement of local citizens [55].3.5.2. Habitat Land Management/Reintroduction of Endangered Species into HabitatsIn the East central region of the state, the Okatibbee Wildlife Management Area (WMA) along with the Mississippi Department of Wildlife, Fisheries and Parks manages sizable acres of land to boast biodiversity. In the past, these entities devoted about 6,883 acres surrounding the Okatibbee Lake to wildlife management for a variety of species and for recreational and operational purposes. Following this approach, some portions of the WMA lands in 1990 were set aside for habitat loss mitigation to compensate for wildlife losses resulting from the construction of the Tennessee Tombigbee Waterway in Mississippi and Alabama. The ensuing land management and beaver activity created vast expanse of open marshland habitat. This not only served the reintroduction of threatened wildlife species, but it quickened the reintroduction of American alligators and bald eagles during the 1970s and the 1990s in the region [55].3.5.3. Partnerships in Wetlands Restoration ProjectOver the years, Ducks Unlimited (DU) an Environmental Non-Governmental Organization has also been quite active in partnership ventures in wetland restoration with government agencies across the state of Mississippi. In 1991, DU in partnership with US Fish and Wild Life Service restored over 200 acres of forested wetland habitats on the Panther Swamp Natural Wildlife Refuge. This effort resulted in the installation of water control structures and the renovation of internal levees in Yazoo city. The restored forested wetland has the capacity to retain water during the fall and spring months. In another program in the year 2000, DU collaborated with US Forest Service in a restoration project along Sharkey County. While the project restored 500 acres of flooded cypress and adjacent bottomland hardwoods on the Delta National Forest through the installation of levees, it provided water source for the area and foraging habitats for migratory and wintering waterfowl and other wildlife species in the respective counties. Since much of the Wildlife Mississippi’ wetland restoration efforts which support significant populations of fish and other aquatic creatures occur along rivers and streams. Riparian forest corridors in the area, provide crucial wildlife habitats and help optimize water quality [55].3.5.4. Educational EffortsIn accordance with the commitment to mitigate the challenges in the state, the Delta Wildlife Inc. has been initiating educational outreach programs on variety of topics involving presentations and classroom instructions for civic groups and hunting clubs. This agency also offers three certified hunters education classes for hunting license buyers as mandated by the State of Mississippi. The other wildlife agency in the state, the Wildlife Mississippi with focus on technical assistance and education has been in the forefront of educational initiatives directed at citizens and private landowners in the areas of conservation, fish and wildlife management. Although, these programs concentrated on meeting the needs of urban population, however they have been quite useful to landowners interested in implementing conservation practices on their land.3.5.5. The Design of Statewide SWAPRealizing the spate of problems impeding habitat conservation, MSWAP serves as a major milestone in conservation planning in the US. Being a collaborative effort to design a preservation blueprint for all wildlife species in their jurisdiction. Each state including Mississippi worked with partners and experts to identify species of greatest conservation need (SGCN) by describing their habitats, and key threats. As part of the document, they recommended conservation actions necessary to prevent more species from becoming threatened, to spur recovery and to keep common species. With a main goal to offer guidance towards effectual and lasting conservation of biodiversity, congress asked each state to focus on SGCN and deal with emerging wildlife concerns. For that, in the last years, Mississippi’s first SWAP provided a road map which earmarked more than $7.5 million in federal SWG aid. This was later matched by $5 million from other sources for more scholarship and assessment effort dedicated to SGCN and the direct implementation of conservation activities recognized in the previous plan. [46, 47].
Appendix - 2
4.1. Recommendations (Contd)4.1.2. Continue Work on Wildlife Conservation PlansIn Mississippi where the threat to wildlife habitat reached enormous proportion, habitat conservation plans to protect specie’s habitat were designed and preserve certain species over an extended area operate without covering an entire region. These plans can be strengthened with regular gathering of info on biodiversity by involving conservation agencies and neighboring states. For these reasons, it is recommended that state authorities continue working on the statewide wildlife habitat conservation plans by seeking the inputs of biology experts on the status of wildlife species of concern and the condition of their habitats with action plans.4.1.3. Best Management Conservation Practices (BMPs) and Ecologically Sound Land Use Policy The current problems facing wildlife habitat management is often compounded by the prevailing land use practices involving the activities of landowners. Although this may be attributed to ineffective policy, the loss of natural habitats such as forest habitats arises from land use practices, such as the expansion of agricultural areas and logging of forests. In some areas, state and local planners remain unaware of conservation plans and how to integrate them within local land use plans. The adoption of best management practices among land users under an ecologically sensitive land use policy is one way of achieving habitat preservation. Observance of BMPs can result in the design of growth corridors in sync with the principles of habitat protection.4.1.4. Strengthen Educational ProgramsConsidering that the pathway to wildlife habitat restoration requires the provision of adequate environmental education in the state, several associations such as Delta Wildlife and Wildlife Mississippi have offered educational instructions and technical assistance directed at civic groups, hunters, citizens and private landowners about conservation of fish and wildlife. While the current educational outreach programs are commendable, focusing on hunting lessons for those who have licenses and land owners is not the only solution. Organizers should target youths given their great potentials as future natural resource managers. This should be supplemented with annual wildlife conservation exposition in schools and field trips sustained by the latest advances in GIS and remote sensing in order to familiarize youths with the mapping of biodiversity corridors alongside outdoor activities and land use ethics.4.1.5. Support Local Involvement and PartnershipsThe gravity of widespread habitat loss in Mississippi is taking a heavy toll on communities. Most localities have difficulties in dealing with the issue. Under these settings, solutions will require continued involvement of local communities nearer to the problem. To be effective, comprehensive habitat conservation plans should be designed at the community level to boast local involvement. Considering how the success stories in wildlife habitat management in the state of Mississippi drew heavily from local involvement and series of partnerships involving different community entities. The paper recommends local involvement and partnerships among agencies in the state as they work towards the protection and rehabilitation of sensitive natural habitats.
Acronyms
References
| [1] | Lower Mississippi Valley Joint Venture Office. (2007). Restoration Management, and Monitoring of Forest Resources in the Mississippi Alluvial Valley. Vicksburg, MS: LMVJV Forest Resource Conservation Working Group. 1-69. |
| [2] | Ehrlich, P.R. (1988). The Loss of Diversity: Causes and consequences. Washington, DC: National Academy Press. 21-27. |
| [3] | Master, L.L. (2000). Vanishing Assets: Conservation Status of US Species. Oxford, UK: Oxford University Press. 93-118. |
| [4] | Wilson, E.O. (1992). The Diversity of Life. Cambridge, MA: Belknap Press. |
| [5] | Wilcove, D.S. (1998). Quantifying Threats to Imperiled Species In the United States. BioScience. 48: 607-615. |
| [6] | Pimm, S.L. (1995). The Future of Biodiversity. Science. 269: 347-350. |
| [7] | Eken, G. (2004 December). Key Biodiversity Areas as Site Conservation Targets. BioScience, 54:2:1110–1118. |
| [8] | Bruner, A.G. (2001). Effectiveness of Parks In Protecting Tropical Biodiversity. Science. 291: 125-128. |
| [9] | Groves, C. (2002 June). Planning For Biodiversity Conservation: Putting Conservation Science Into Practice: A Seven-Step Framework. BioScience. 52:6:499-512. |
| [10] | Olson, (DM). (1998). The Global 200: A Representation Approach to Conserving The Earth's Most Biologically Valuable Ecoregions. Conservation Biology. 12: 502-515. |
| [11] | Myers, N. (2000). Biodiversity Hotspots For Conservation Priorities. Nature. 403: 853-858. |
| [12] | Abell, R.A. (2000). Freshwater Ecoregions of North America: A Conservation Assessment. Washington, D.C: Island Press. |
| [13] | Master, L.L. (1998). Rivers of Life: Critical Watersheds for Protecting Freshwater Biodiversity. Arlington, VA: The Nature Conservancy. |
| [14] | Secretariat of the Convention on Biological Diversity. (2000). Sustaining Life on Earth: How the Convention on Biological Diversity Promotes Nature and Human Well-Being. Québec, Canada: Secretariat of the Convention on BioDiversity. |
| [15] | Redford, K.H. (1999). Conservation of Biodiversity In a World of Use. Conservation Biology. 13: 1246-1256. |
| [16] | Noss, R.F. (1990). Indicators for Monitoring Biodiversity: A Hierarchical Approach. Conservation Biology. 4: 355-364. |
| [17] | Merem, E C. (2011). The Applications of GIS In The Analysis of The Impacts of Human Activities on South Texas Watersheds. International Journal of Environmental Research and Public Health. 8:6:2418-2446. |
| [18] | Merem, E.C. (2011). Using Geospatial Information Systems In Analyzing Urbanization Impacts on Stream Southern Habitats in Mississippi Coastal Ecosystem. Journal of Environmental Science and Engineering. 5:12: 1624-1641. |
| [19] | Merem, E.C. (2011). Geospatial Information Analysis of Land Uses Impacts In Southern Alabama. Journal of Environmental Monitoring and Restoration. 7: 1-25. |
| [20] | Ehrlich, P.R. (1992). Population Biology of Checkerspot Butterflies and The Preservation of Global Biodiversity. Oikos. 63:6-12. |
| [21] | Olson, D.M. (2001). Terrestrial Ecoregions of The World: A New Map of Life on Earth. BioScience. 51: 933-938. |
| [22] | IUCN The World Conservation Union. (1993)). Parks for Life: Report of the IVth World Congress on National Parks and Protected Areas. Gland, Switzerland: IUCN. |
| [23] | Stattersfield, A.J. (1998). Endemic Bird Areas of the World: Priorities for Biodiversity Conservation. Cambridge, UK: Birdlife International. |
| [24] | Natural Resources Conservation Service (2007). Development of Non-Federal Rural Land. Retrieved May 5th 2018 From https://www.nrcs.usda.gov/wps/portal/nrcs/detail/national/soils/?cid=stelprdb1083197. |
| [25] | US Department of Agriculture. (2015). Summary Report: 2012 National Resources Inventory. Washington, DC: Natural Resources Conservation Service. |
| [26] | Dahl, T.E. (2000). Status and Trends of Wetlands In The Conterminous United States 1986 to 1997. Washington, D.C: US. Department of the Interior, Fish and Wildlife Service. 82. |
| [27] | Dahl, T.E. Wetlands Losses in the United States: 1780’s to 1980’s. Washington, DC: US. Department of the Interior and Northern Prairie Wildlife Research Center. |
| [28] | Dahl, T.E. (2013). Status and Trends of Wetlands in The Coastal Watersheds of the Conterminous United States 2004 to 2009. US. Washington, DC: Department of the Interior, Fish and Wildlife Service. |
| [29] | U.S. Commission on Ocean Policy. (2004 July). An Ocean Blueprint for the 21st Century. Final Report. Washington, DC: Commission on Ocean Policy. 170-178. |
| [30] | U.S. Department of the Interior, U.S. Fish and Wildlife Service and U.S. Environmental Protection Agency. Southeast Wetlands: Status and Trends, Mid-1970s to Mid-1980s. Washington, DC, 1994. |
| [31] | Fretwell, J.D. (1996). National Water Summary on Wetland Resources. Washington, DC: USGS, Water-Supply Paper 2425. |
| [32] | Merem, E.C. (2018a). Assessing The Menace of Illegal Wild Life Trade In the Sub Saharan African Region. Advances in Life Sciences. 8:1:1-23. |
| [33] | Merem, E.C. (2018b). Analyzing Emerging Environmental Issues in Major Areas: The Case of Lagos in South West Nigeria. Architecture Research. 8:1:1-19. |
| [34] | Merem, E.C. (2017a). Assessing Ecosystem Liabilities of Oil and Gas Activities in Southern Nigeria. Public Health Research. 7:1. |
| [35] | Geological Survey (USGS). (2010 December). Forecasting the Effects of Land-Use and Climate Change on Wildlife Communities and Habitats in the Lower Mississippi Valley. Kearneysville, WV: USGS Leetown Science Center. |
| [36] | Barbier, E.B. (2011). The Value of Estuarine and Coastal Ecosystem Services. Ecological Monographs. 81:2:169-193. |
| [37] | Mississippi Fish and Wildlife Foundation (MSFWF). (2018). Habitat Conservation Overview. Stonville, MS: MSFWF. |
| [38] | Elliott, G. (2017). Surprisingly Diverse Mississippi. Falmouth: ME. Mississippi Land Conservation Assistance Network. |
| [39] | Wilcove. D.S. (2000a). The Geography of Vulnerability: Incorporating Species Geography and Human Development Patterns Into Conservation Planning. Biological Conservation 96: 169-175. |
| [40] | Wilcove, D.S. (2000b). Leading threats to US Biodiversity: What's Threatening Imperiled Species? Oxford, UK: Oxford University Press. |
| [41] | Kondolf, G.M. (1995). Five Elements For Effective Evaluation of Stream Restoration. Restoration Ecology 3:2:133-136. |
| [42] | Sheilds, D. (2003 June). Ten Years After: Stream Habitat Restoration Project In Retrospect. Proceedings of World Water and Environmental Resources Congress. Philadelphia, Pennsylvania. June 2003. |
| [43] | Shields, F.D. (1995a). Experiment In Stream Restoration. Journal of Hydraulic Engineering. 121:6: 494-502. |
| [44] | Shields, F.D. (1995b). Incised Stream Physical Habitat Restoration With Stone Weirs Regulated Rivers: Research and Management. 10:181-198. |
| [45] | Shields, F.D. (1998). Rehabilitation of Aquatic Habitats In Warmwater Streams Damaged By Channel Incision in Mississippi. Hydrobiologia. 382:63-86. |
| [46] | Shelton, K. (2016). Mississippi State Wildlife Action Plan 2015 –2025. Jackson, MS: Mississippi Department of Wildlife, Fisheries. |
| [47] | Mississippi Museum of Natural Science. (2015). Mississippi State Wildlife Action Plan. Jackson, MS: Mississippi Museum of Natural Science. |
| [48] | Merem, E.C. (2018c). Analyzing Changing Trends In Forest Land Areas of Mississippi. International Journal of Agriculture and Forestry. 8:1: 1-15. |
| [49] | Merem, E.C. (2017b). Assessing The Ecological Effects of Mining in West Africa: The Case of Nigeria. International Journal of Mining Engineering and Mineral Processing. 6:1: 1-19. |
| [50] | Merem, E.C. (2014). The Analysis of Coal Mining Impact on West Virginia’s environment. British Journal of Applied Science and Technology. 4:8:1171-1197. |
| [51] | Mississippi Forestry Commission. (2017). Protection Management Information Annual Report. Jackson, MS: State Forester’s Office. 1-13. |
| [52] | Mississippi Forest Association (MFA). (2003). Mississippi Forestry Facts: Promoting Sustainable Forestry In The Magnolia State. Jackson, MS: MFA. |
| [53] | Mississippi Society of American Foresters. (2000). MSAF Position Statement On Regeneration Harvesting and Forest Health On Mississippi National Forest. Jackson, MS: MSAF. |
| [54] | Merem, E.C. (2005). Issues In Wildlife Habitat Conservation: The current Initiatives In the South East, The Case of Mississippi. Journal of the Alabama Academy of Science. 76:2: 123. |
| [55] | Merem, E.C. (2004). Analysis of Trends on Forested Land Areas: The Case of Mississippi. Journal of the Alabama Academy of Science. 75:2:82. |
| [56] | Mississippi Land Conservation Assistance Network MSLCAN (2017). Wildlife Resources In State Wide Region. Falmouth, ME: Mississippi Land Conservation Assistance Network. |
| [57] | Merem, E.C. (2012). Tropical Landscape Change and The Role of Agroforestry In Southern Nigeria. British Journal of the Environment and Climate Change. 2:3:285-319. |
| [58] | Environmental Working Group (EWG). (2018). Conservation Data Base Know Your Environment Protect Your Environment. Washington, DC: EWG. |

 Abstract
 Reference
 Full-Text PDF
 Full-text HTML