E. C. Merem1, J. Wesley1, P. Isokpehi1, E. Nwagboso2, S. Fageir1, S. Nichols1, M. Crisler1, M. Shenge1, C. Romorno1, G. Hirse1
1Department of Urban and Regional Planning, Jackson State University, Jackson MS, USA
2Department of Political Science, Jackson State University, Jackson MS, USA
Correspondence to: E. C. Merem, Department of Urban and Regional Planning, Jackson State University, Jackson MS, USA.
| Email: |  |
Copyright © 2016 Scientific & Academic Publishing. All Rights Reserved.
This work is licensed under the Creative Commons Attribution International License (CC BY).
http://creativecommons.org/licenses/by/4.0/

Abstract
This paper focuses on the growing threats of mercury exposure in the African American community. Emphasis is on the issues, factors, impacts and efforts to contain the menace. In terms of methods, the study uses a mix scale approach of descriptive statistics and Geographic Information Systems (GIS) to analyze the problems spatially. The temporal analysis of the study not only revealed the widespread emission of large quantity of mercury pollutants from electric utility sources in the study area between 1993 to 2011, but there exists spatial concentration of emission sources among the states most notably, Texas, Alabama, Georgia, Louisiana and others at the expense of African American communities in the vicinities. Aside from some initiatives to address the issue based on the efforts of various entities made up of federal and state agencies as well as the private sector, the paper offered several recommendations ranging from the need for education in affected communities, the strengthening of current policies, mandatory enforcement of polluter pay principle against mercury emission sources and the continued GIS mapping of mercury hazards to stem the threats in the African American community.
Keywords:
Mercury, Exposure, African American community, GIS, Pollution, Emission, Factors, Efforts
Cite this paper: E. C. Merem, J. Wesley, P. Isokpehi, E. Nwagboso, S. Fageir, S. Nichols, M. Crisler, M. Shenge, C. Romorno, G. Hirse, The Growing Issue of Mercury Exposure and the Threats in the African American Community, Frontiers in Science, Vol. 6 No. 1, 2016, pp. 1-16. doi: 10.5923/j.fs.20160601.01.
1. Introduction
The exposure to toxic mercury continues to be a growing health hazard at an alarming pace in many places [1]. Being a persistent bio-accumulative and toxic pollutant, when discharged into the atmosphere mercury dissolves in water laid sediments and it can be guzzled by fish and moved up the food chain to humans. In that setting, mercury contamination represents a major public health and environmental problem. Notwithstanding efforts by federal and state governments as well as private sector initiatives to minimize mercury discharge into the environment, its level in fish continues to exceed permissible thresholds [2-4]. On a general level and based on current research, mercury exposure can occur in the environment as well as in occupational and domestic settings. As part of the issue, mercury poisoning involves the condition prompted by exposure at an elevated dosage which could accelerate fatal health effects on communities [5-8]. While the exposure to mercury tends to manifest through several ways including dental amalgam fillings and the consumption of sea food laced with it, the hazards of mercury exposure can happen in and outside of built environments. As a result, most individuals are chiefly exposed to methyl mercury, an organic compound when they eat fish tainted with methyl mercury. Accordingly, some of the factors shaping the health effects from mercury poisoning hinges on the biochemical form, dose, age of the person, the period, route and medical state of the individual at risk. Added to that, power plants account for half of all mercury emissions in the US of which aging coal fired plants are responsible for 99% of most discharges. At the same time, nearly 40 percent of coal fired plants lack innovative pollution tracking devices [2, 9, 10, 11].Just as the exposure to mercury poisoning transcends all geographic boundaries and people of all ages and races as well as gender groups. The inherent hazards associated with it continue to linger in the African American community particularly from fish intake and other numerous sources. In these communities vulnerability of children particularly to mercury toxicity and the resultant impairment of newly developing central nervous system remains a concern [12, 13]. Additionally, elevated doses and other sources of toxic mercury have been associated with children in the African American community in some areas and especially among black women more than other consumers at levels surpassing the normal thresholds [14]. Accordingly, it has been shown that fish as a significant source of animal proteins and other nutrients, can also carry a high percentage of mercury generally from incinerators, coal-burning power plants and other manufacturing sites adjacent to water resources [2, 9]. Furthermore, mercury contamination in fish across the United States remains so prevalent that health departments in 44 states issued fish consumption advisories in the past. Amongst these, 11 states have released consumption advisories for every inland water body for at least one fish species; 6 states have consumption advisories for canned tuna, and 8 others have state wide marine advisories for king mackerel. Studies in the south east region, have not only showed high traces of mercury in rain, lakes and waterways in Mississippi but the state has not done enough to limit the presence of the neurotoxin in the food chain in a place with significant Black population. Elsewhere the average mercury concentration found in some 12 states exceeded US environmental protection agency’s level [2].In terms of African American dimension, close to thirty three percent of all mercury contamination in the country emanates from sites with threatening impacts on nearby Black communities. Given that African Americans are more likely to reside near toxic industrial sites and consume more fish than Caucasians, they are more vulnerable to elevated forms of mercury exposure in the study area in Fig 1. At the same time, Blacks still face the risks of mercury pollution from power plants through the ingestion of contaminants and the air borne discharge of the metal into the built and natural ecosystem [2, 9, 15]. The increasing threats are manifested with mercury fish consumption advisories on adjoining rivers, mercury exposure among Black women and the inter-linkages between the activities of some of the worst mercury polluters in the country and the resultant emissions [15]. This is compounded by weak policies and a number of economic and social–cultural elements [2]. The impacts of continual exposure of mercury in the African American community can result in the risks of learning disabilities among children and other respiratory problems. All in all, mercury poses serious risks to humans consuming seafood because of its tendency to bio-accumulate and trigger adverse health effects. Notwithstanding the gravity of the problems, very little has been done to analyze the issue in the context of Black communities. Having said that, African Americans are more likely to suffer health effects from air pollution through mercury and part of the reason has much to do with their dwelling places and land use planning. Because African Americans are more likely to live near power plants and waste sites, their proximity to these sites increases the likelihood of exposure and health risks among them hence the issue [12, 16]. More work on the impacts of mercury can be gleaned from other sources in the literature as well [17-21]. This paper focuses on the growing threats of mercury exposure in the African American community. Emphasis is on the issues, factors, impacts and initiatives to contain the menace. The study has four objectives with the first being to analyze the issues in mercury exposure. The second objective assesses the risks posed to the African American community of the Mid-Atlantic and the South East region while the third objective stresses the factors responsible for mercury hazards in the areas. The fourth and last objective focuses on the mitigation efforts by institutions and the design of a decision support tool for policy makers. The paper is divided into four sections. The first part is focused on the introduction while section two describes the methods and materials of the research. Section three presents the results from the data and environmental analysis along with the factors and efforts. Section four discusses the findings while section five provides a closure to the study.
2. Methods and Materials
2.1. The Study Area
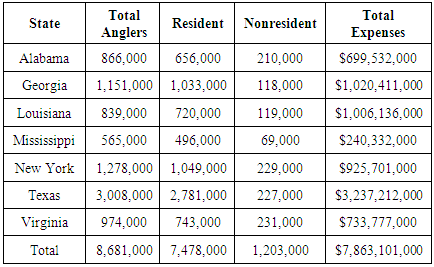
The study area (Fig 1) stretches through 546,134.19 miles of both coastal and inland environment across 7 states in the North east and the southern region of the US. Being an area endowed with rich coastal waters and natural heritage where fishing is quite common. The area boosts of many anglers spending billions of dollars for fishing (Table 1).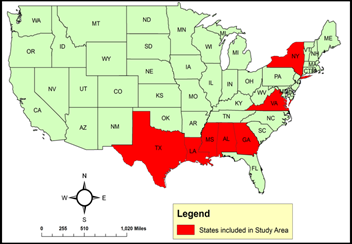 | Figure 1. The Study Area |
Table 1. Number of Anglers and Total Expenditures for Fishing by State (2006)
 |
| |
|
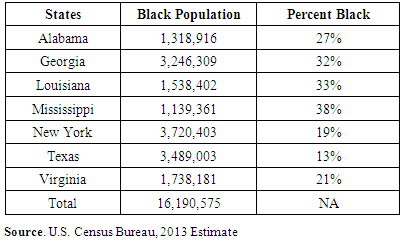
Accordingly, in 1996 1.8 million African Americans nationwide spent over $800 million dollars in fishing and the purchase of related equipment and accessories [22]. With a population of 16,190,575 in 2013 as shown in Table 2, the percent of Blacks in the 7 states remains sizable and above the national average [23]. In the study area, several Black communities remain at the epicenters of most atmospheric hazards given their proximity to these sites and contradictions in land use planning in which mercury sources are zoned within the vicinity of Black communities. While this is compounded by the presence of risk factors like power plants and other predictors, mercury pollution continues to threaten African Americans in their communities (Figure 1.2-1.3).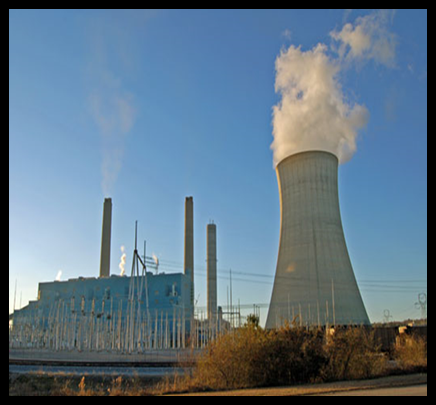 | Figure 1.2. Mercury Emission from Power Sources |
 | Figure 1.3. Images of Power Plant Emission Source |
Table 2. The African American Population
 |
| |
|
2.2. Methods Used
The paper uses a mix scale approach involving descriptive statistics and primary data connected to GIS. The spatial information for the research was obtained from the United States Environmental Protection Agency (EPA), The United States Geological Surveys (USGS), The United States Department of Interior, as well as state agencies like The Mississippi Department of Environmental Quality (MDEQ), the Georgia Department of Environment and the Louisiana Department of environmental Quality. Others include organizations such as the National Wildlife Foundation and the Environmental Integrity Project (EIP) and other environmental Non-governmental Organizations. All in all, the mercury emission information and the rankings for some of the states came from the US EPA, the Environmental integrity Project, the Louisiana Department of Environmental Quality, the United States Geological Survey USGS for the periods of 2002 to 2013 while the National Wildlife Foundation provided the state wide fish mercury advisories, the information on anglers and the population along with the economic and environmental benefits data. Accordingly, Federal geographic identifier codes of the states were used to geo-code the information contained in the data sets. This information was analysed with basic descriptive statistics, and GIS, with particular attention to the temporal-spatial trends at the state and regional level. The relevant procedures consist of two stages.
2.3. Stage 1: Identification of Variables, Data Gathering and Study Design
The first step involves the identification of variables needed to assess mercury threats among blacks in the seven states of the south and the north east. The variables consist of population, air borne mercury level, air borne concentration, toxic mercury flared, mercury fish advisories, mercury induced impairment, ranking of pollutants, level of pollutants, emission rates, mileages of impaired water bodies and polluting plants. The others include emission, top polluters, emission inventories, future emission, the number of anglers, expenditures, mercury concentration and onsite releases. Additionally, access to databases that are available within Federal and state archives in the study area and other agencies quickened the search process (See Tables 1-4). The process continued with the design of data matrices for socio-economic and environmental variables covering the periods from 1993, 1997, 2001, 2002, 2004, 2006, 2011 and 2014. The design of spatial data for the GIS analysis required the delineation of state boundary lines. With boundary lines unchanged, a common geographic identifier code was assigned to each of the units to ensure analytical coherency.
2.4. Stage 2: Step 2: Data Analysis and GIS Mapping
In the second stage, descriptive statistics and spatial analysis were employed to transform the original socio-economic and environmneantal data into relative measures (percentages/ratios) as well as maps. This process generated the parameters for guaging the extent of activities and the trends associated with mercury emission exposure. This was facilitated by measurements and comparisons of the trends over time. While this approach allows for disaplying the trends, the tables highlight frequency, the volume of emission, the sources and the environmental resource at risk.The remaining steps involve spatial analysis and output (maps-tables-text) covering the study period, using ARCVIEW 11. The spatial units of analysis consist of states, region and the boundary and locations where utility power companies known for mercury emmision are active. The geographic data for the states which covered their boundaries also includes ecological data of land cover files and paper and digital maps from 2012 -2013. The outputs of the spatial data were mapped and compared to see the dispersion of the trends, the threats and the socio-economic factors fuelling mercury hazzard.
3. Results
This section of the paper presents the results from the data and environmental analysis of mercury exposure among African Americans in the study area. There is an opening focus on the analysis of atmospheric mercury hazards, mercury contamination threats through surface water environments and miscellaneous mercury assessment for Mississippi and Louisiana and sea food exposure to mercury among black women. This is followed by a spatial analysis based on GIS mapping of the dispersion of the trends over the years as well as identification of factors responsible for the problems, the efforts and findings and conclusions of the research.
3.1. The Analysis of Atmospheric Mercury Hazards (Environmental Analysis)
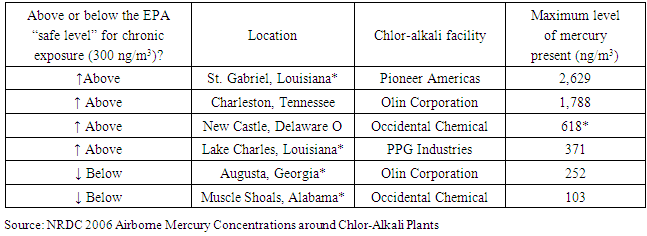
Of the high levels of airborne mercury concentrations around Chlor – Alkali plants, note the high presence of mercury in 2 of four cities in 4 states of the study area in the fiscal year 2006. Of these states, the Pioneer Americas plants in St. Gabriel Louisiana emitted 2,629 ng/m3 of mercury which outpaced all the states in the list. This was followed by the PPG industries located in the Lake Charles area of Louisiana with mercury emission level estimated at 371 ng/m3. Within the same south east region, Olin Corporation and Occidental chemical in Augusta Georgia and Muscle shoals in Alabama were responsible for 252 to 103 ng/m3 judged below the EPA safe level of 300 ng/m3 for critical exposure. Going by the lethal nature of flared pollutants such as mercury (Table 3), these concentration levels still pose a threat to the wellbeing of adjoining Black communities in the respective states therein cited considering the fact that African Americans account for 64 to 47% of the population of the St Gabriel and Lake Charles areas in Louisiana and about 54.7% in Augusta, GA and 15.6% in Muscle shoals, Alabama. Regardless of the numbers, the risks from mercury exposure in these places remains troubling considering the proximity of African Americans to the location of these plants. Additionally, African Americans bear greater exposure to the risks given their frequency of fish consumption and the fact that they are often at the epicentres of these hazards particularly atmospheric emissions sources such as Chlor – Alkali plants as herein noted [24].Table 3. Levels of Airborne Mercury Concentration around Chlor-Alkali Plants
 |
| |
|
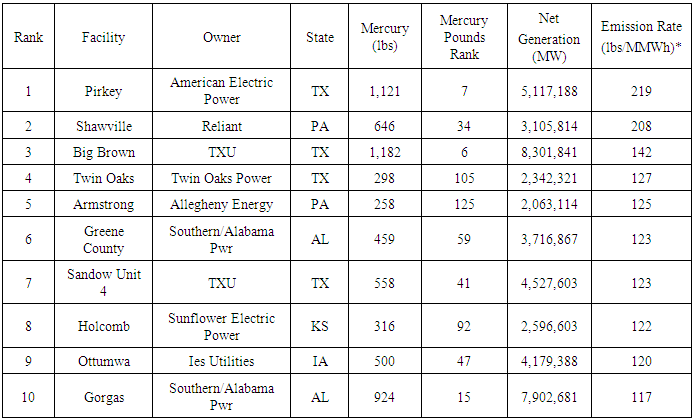
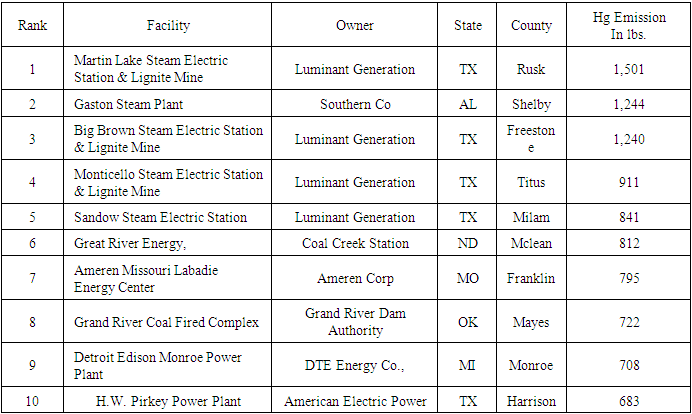
Additionally, the growing incidence of onsite releases of mercury from electric utilities in the 2007 period as table 4 shows involves emissions to the air coupled with discharges to the surrounding waters. The seven states in question from Alabama, Georgia, Louisiana, Mississippi, New York, Texas and Virginia accounted for a total of 33,500 Lbs made up of onsite or other releases in the area (Table 4). The classification of releases from electric entities shows three states (Alabama, Georgia and Texas) with high level of mercury disposal (Table 4). Of great importance is the presence of the top 50 dirtiest power plants, coupled with top 50 polluting power plants for mercury and America’s top ten power plants for mercury pollution in 2011 in the area (Tables 5, 6, 7). What stands out from the tables dated 2004-2011 is the predominance of power plants within Texas and Alabama as major sites and sources of mercury emission in the region. This is often detrimental to African communities resident in these areas. Despite the 5,117,188 - 8,301,841 mw in electricity generated by such power utilities as the American Electric Power in Pirkey and Big Brown TXU power plant in Texas and the 3,716,867 - 7,902,681 from Southern/Alabama Pwr. The toxic doses emanating from fugitive emissions out of these dirtiest power facilities estimated at 1,121 to 1,182 and 459- 924 pounds in both Alabama and Texas are quite hazardous in terms of exposure to those within its vicinity including African Americans (Table 5).Table 4. Onsite Releases of Hg Compounds by Electric Utilities by State 2007
 |
| |
|
Table 5. Top 50 Dirtiest Power Plants: Hg Emission Rate-lbs Hg/million MWh, 2004
 |
| |
|
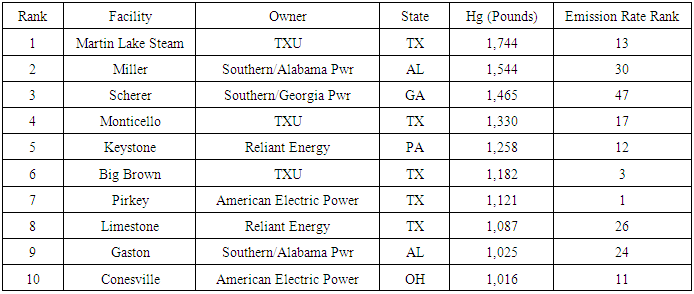
In terms of the top 50 polluting power plants for mercury exposure in 2004 in the country, note the presence of Martin Lake steam and the Monticello facilities in Texas both operated by TXU. The closer look on the table further shows that while these facilities accounted for 1,744-1,544 pounds they still maintained a national ranking of 13 and 17 respectively. In the other states of the south east, note also the emission trends involving major polluting plants in Alabama and Georgia with notable Black populations. In the case of Alabama, the Miller and Gaston facilities under Southern/Alabama Pwr discharged between 1,544 to 1,025 pounds of mercury with nationally ranked levels in mercury emission ahead of others at 24-30 spots on the list. Other notable sources in the study area on the list worthy of note consist of Scherer under the Southern/Georgia Pwr. Being responsible for 1,465 pounds in mercury emission, it came as no surprise to see the Scherer facility listed at number 47 in national ranking (Table 6). Even in the fiscal year 2011, the emission trends among the top 10 facilities for mercury pollution remained unchanged to the detriment of the Black community (Table 7).Table 6. Top 50 Polluting Power Plants for Mercury (Hg) By Pounds Hg (2004)
 |
| |
|
Table 7. America’s Top Ten Power Plants for Mercury Pollution In 2011
 |
| |
|
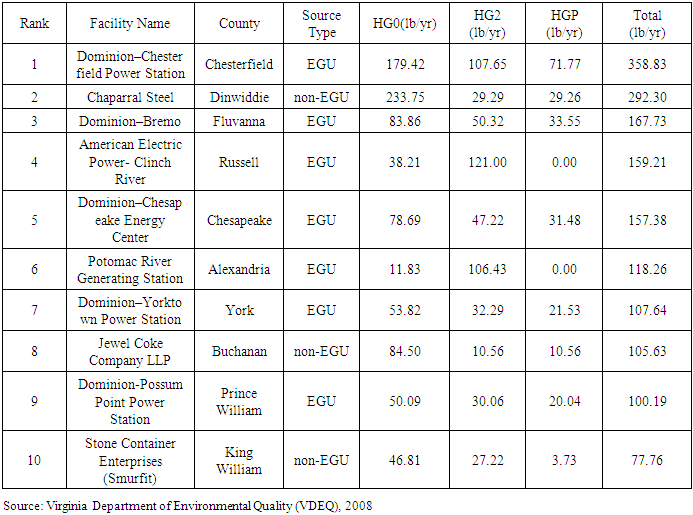
To further buttress the threats of mercury exposure consider the trends in Virginia during the 2008 period. Surely, the state of Virginia also had a high concentration of mercury emitting facilities that threaten Black communities as well. Among the individual states, Virginia and its 10 counties stood out in many ways as an area with notable instances of point source mercury emission estimated at 1664.03 lbs by facility among electricity generating units (EGU) in the 2002 period. From the data on the state of Virginia, see that Dominion chesterfield and Chaparral Steel in both chesterfield and Dinwiddie emitted the highest totals of 358.83 to 292.30 lbs of mercury compared to three other closest facilities (Dominion–Bremo, American Electric Power- Clinch River, and Dominion–Chesapeake Energy Center) at Fluvanna, Russell, and Chesapeake counties. These facilities as the table indicates totalled about 167.73, 159.21 to 157.38 lbs of mercury emissions per year. The other group of facilities with emission in the lower hundreds consists of four facilities in Alexandria, York, and Buchanan and Prince William counties. The emission totals for the four facilities in the respective counties totalled 118.26, 107.64, 105.63, to 100.19 lbs while the stone container enterprise at King William ranked number 10 emitted 77.76 lbs (Table 8). The projected emission budget totals for the area remains significant at 1331.86, 1016.06, 600.5to 414.56 lbs for the different periods (2002, 2014, 2015-2017 and 2008). While these are still sizable enough to impact any given ecosystem including watersheds in the state where many African Americans reside, one need not forget that the exposure faced by Black mothers and unborn children to mercury threats in the Northern part of the state emanates from electricity utility sources in the area [25].Table 8. Point Source Hg Emissions Inventory —Ranked by Facility Total Emissions
 |
| |
|
3.2. Mercury Contamination of Surface Water Environments
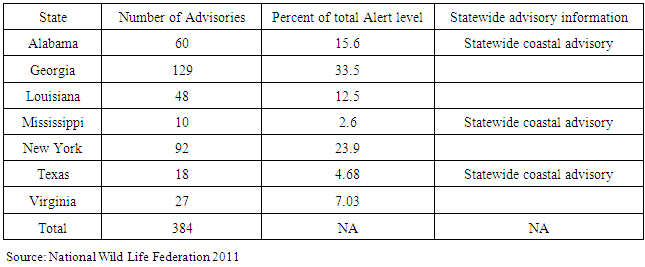
The risks to African Americans and various communities is evident with the growing frequency of mercury pollution, the volume of emission, the manifestation of the trends in both the built and natural environment and the resultant advisories. It not only reflects early warnings to which the dangers of accumulated hazards of mercury could have on people, but it affords opportunities to limit contacts and exposure with contaminated areas especially lakes and rivers where individuals undertake fishing and other recreational activities. As an integral part of mercury impact containment, mercury advisories within the states under analysis have been applied in critical situations to raise the alert levels of the risks posed to the public including African Americas. Based on the information on the table, they have been in effect in the last several years in both coastal and inland water areas. Realizing the fact that mercury exposure within communities threatens the health and wellbeing of people of all ages, in the 2011 period, the seven states in the study area issued a total of 384 mercury fish consumption advisories. In that period Alabama, Georgia, Louisiana and New York had more advisories than the others. The number of advisories for those initial four states consists of 60, 129, 48 to 92 while Mississippi, Texas, and Virginia all raised their mercury fish consumption alert levels for about 10, 18 to 27 times [22]. Given the impacts of mercury exposure along coastal and inland areas of the different states, Georgia and New York accounted for more than half of the total percentage points of (33.5 and 23.9) advisories issued. Seeing the individual state advisories evident in Mississippi, Louisiana and Texas does raise major concerns in these places considering their Black populations and the risks which recurrent mercury pollution pose to African Americans out there (Table 9).Table 9. Mercury Fish Consumption Advisories by State 2011
 |
| |
|
3.3. Miscellaneous Assessment on Louisiana and Mississippi
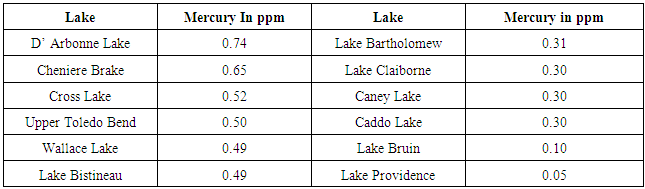
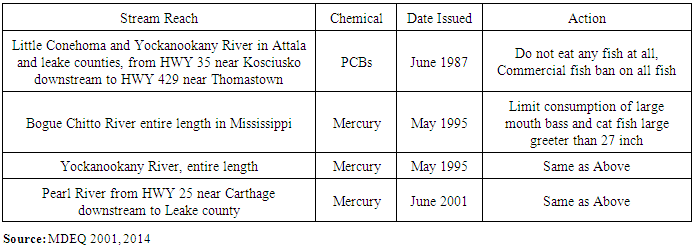
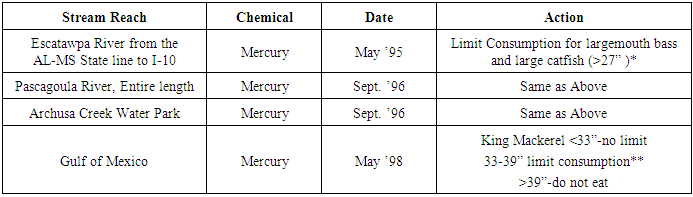
Considering the risks posed by mercury contaminated waters and the level of air borne mercury threats to communities where African Americans reside. The extent and nature of mercury levels in Benthic fishing environments of two neighbouring Gulf states of the study area with significant African American population between 1993 through 2001 offers further compelling insights on the risks. In the case of Louisiana, consider the information on the left and right columns depicting average mercury concentration in the lakes in parts per million in Northern Louisiana for 1993. The lakes on the left column of the table from D’Arbonne Lake to Lake Bistineau had an average of 0.74 to 0.49 mercury ppm while those listed on the right from Lake Bartholomew to Lake Providence averaged 0.31 to 0.05 ppm in Largemouth bass fillet [26] (Table 10). Another indication of the threats of mercury in places in the study area with Black population comes with fish consumption advisories issued for Pearl River and the Pascagoula River in Mississippi between 1995-2001. While the listed streams cover multiple rivers in the state, note that mercury remained the dominant chemical of risk to the areas during the 1995-2001 periods. Based on the respective dates and the required actions over the mercury alerts in place on the two rivers, the risks to the public were dully spelt out with frantic calls to users of the river systems to minimize the consumption of any fish. This involved the observance of commercial fish prohibition and limiting consumption of largemouth bass and large catfish in line with the proscribed dimensions. Considering the widespread level of impairments in the respective river systems covering total miles of 1,095 and below, the Pearl River basin had about 120 miles of its water ways laced with mercury during the periods of assessment. This again raises the risk levels for Blacks in these places [4]. See Tables 11 and 12 for more information on the role of mercury in these impairments.Table 10. Average Concentration of Hg ppm in Largemouth bass fillet From 12 North Louisiana Lakes in 1993
 |
| |
|
Table 11. Pearl River Basin Fish Consumption Advisories 1987-2001
 |
| |
|
Table 12. Pascagoula River Basin Fish Tissue Advisories and Commercial Fishing Bans June 2001
 |
| |
|
3.4. Sea Food Dietary Exposure and the Dangers to Black Women
Maternal mercury exposure among Black women in the New York area and Northern Virginia remains sizable. An assessment of prospective study of pregnant women at the university hospital of Brooklyn’s prenatal clinic was conducted in New York to investigate the association between maternal exposure to several pollutants and the risks of adverse birth outcomes. In the case of New York, the frequency of fish consumption during pregnancy was not only high but it was found that some participants were consuming fish high in mercury such as tuna, and shark. There was also a significant positive correlation between maternal urinary mercury (hg) and cord blood and sea food consumption in the Lower James River along the south east community in Newport News Virginia. With focus on ingestion rates (IR) meal and exposure frequency, the study assessed seafood consumption for women of child bearing age (16-49) in a low income African American community along the coastal area. It showed the risks of elevated levels of ingested mercury from fish among Black women in a state already known for growing levels of mercury emission from power plants located in numerous counties [15].
3.5. Spatial Analysis of Mercury Exposure
The spatial mapping of the pollution trends shows fish consumption mercury advisories displayed in red, green and blue colours. While the red indicates state-wide advisories and green colours showing mercury warnings, blue represents coastal bulletins highlighting dangers along areas adjacent to shorelines across the country and the study area. From the spatial distribution on the map, the areas under warnings seemed spread across the North East states of New York, Virginia, to Georgia, Louisiana, Mississippi, and Texas in the south with known sources of mercury pollution (Figure 2). With the exception of Virginia classified under the state wide fish consumption mercury advisory, all the states in question areas ended up with the issuance of mercury bulletins from New York to Texas. Additionally, the spatial distribution of the areas under some kind of coastal advisory point to a visible presence and clusters in coastal Virginia in the Mid-Atlantic and the lower portions of the map in seaside areas of Georgia, Alabama, Mississippi and Louisiana.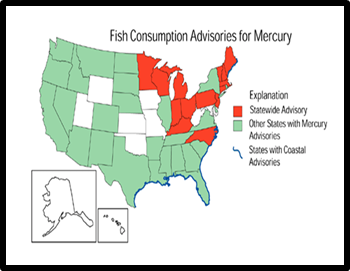 | Figure 2. Fish Consumption Advisory. Source: USGS, 2000 |
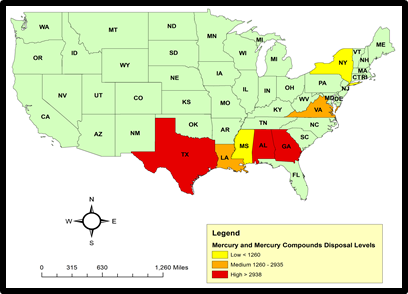
Interestingly the spatial distribution of air borne mercury concentration of Alkali involving several companies shows the solid presence on the lower side of the map in the cities of St Gabriel, Lake Charles, Muscle Shoals and the Augusta area in the states of Louisiana, Alabama and Georgia. Of all these areas, Pioneer Americas in St Gabriel Louisiana with 2,629 ng/m3 outpaced Olin cooperation of Augusta Georgia, PPG industries and occidental chemical whose levels of air borne mercury around Alklor plants were between 371-252 and 103 ng/m3. Of great importance is that mercury levels emitted from Alklor plants operating in Louisiana exceeded normal levels when compared to other areas in the map (Figure 3). The dispersion of onsite emission of mercury from electric utilities in 2007 as represented in the legends is distinguished under three categories of low, medium and high in triple colors of yellow, green, orange and red. The high levels of > 2938 in red color seemed spread across in three states most notably Texas, Alabama and Georgia. The medium forms of emission (1260-2835) in the orange color showed more prominence in Louisiana and Virginia while the lowest levels in yellow in the under 1260 category held firm in the states of Mississippi and New York. Overall these onsite releases seemed as characterized by the different levels more in the lower south than the mid and upper Atlantic portions of the study area (Figure 4).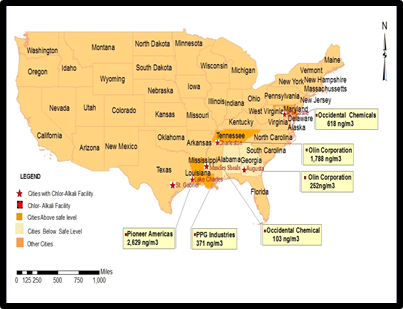 | Figure 3. Airborne Mercury Concentrations around Chlor-Alkali Plants |
 | Figure 4. Onsite Emission of Mercury by Electric Power 2007 |
In the context of the study area regarding top 50 dirtiest plants by emission rate in 2004, note that among the states in the area, Texas and Alabama were more prominent in that category. From the map, Texas not only emerged with more quantities in emissions, it also had significant emission rates as shown with the activities of companies such as Big Brown, Pirkey, Sandow Unit 4 and Twin Oaks. In the same category, the activities of Gorgos and Green County owned by southern Alabama Power Company in Alabama resulted in considerable emissions as the map shows. Of all the companies listed on the map, both Big Brown and Pirkey emerged higher in rankings at 6 and 7 respectively than the others as the highest sources of mercury pollution (Figure 5).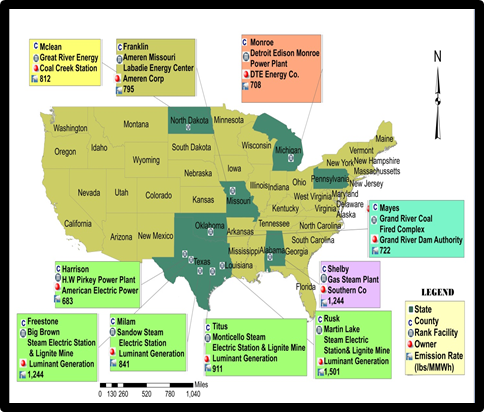 | Figure 5. Top 50 Dirtiest Power Plants by Emission Rates, 2004 |
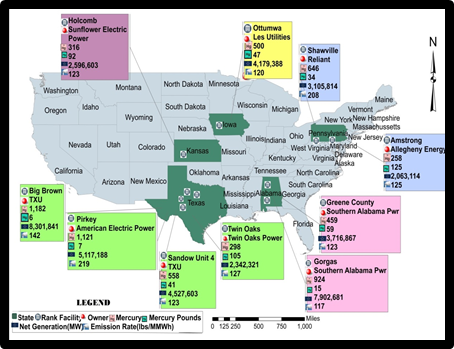
Figure 6 highlighting the top 50 polluting plants by pounds or weight of emitted pollutants shows the activities of these emitting facilities were visible in the states of Texas, Alabama, and Georgia. Of these states as shown in the map, Texas accounted for five of the emission sources while Alabama had two and Georgia finished with one. From the distribution patterns and the overall total of these plants, many of them were in Texas while Alabama and Georgia followed up in every category. While the leading emission facilities in the study area made up of Big Brown, Martin Lake Stream, Pirkey, Limestone and Monticiello were visible again in Texas, four of these companies listed herein posted highest emission rate rankings of 1, 3, 13 and 17 as the information on the map indicates (Figure 6). The same can be said of the information on the maps highlighting top 10 plants for mercury pollution in 2011. Once again, going by the indicators Texas contained majority of the facilities as well as the volumes emitted and the top rankings attributed to the plants. In terms of the spatial dimensions, see the presence of emission sources mostly electric utility companies owned by Luminant and American Electric visibly spread across multiplicity of counties in the state of Texas. With the county locations of mercury emission sources comprised of such places as Harrison, Freestone, Milam, Titus and Rusk in Texas. The Gaston stream plant at Shelby county Alabama emerged exclusively under the classification as the only source of Hg emission with nothing on the other states (Figure 7). While more information on the top 10 emission sources and volume discharged from the number of facilities can be gleaned further in Figure 8. The spatial concentration of mercury sources quickens the exposure of Blacks in the study area to the neuro-toxin hence the danger.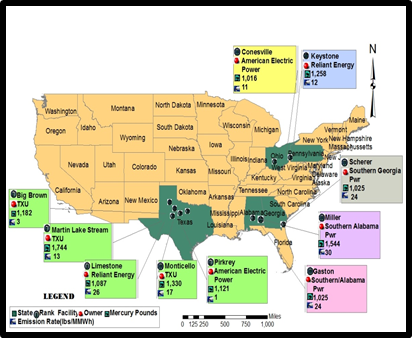 | Figure 6. Top 50 Polluting Plants for Mercury by Pounds, 2004 |
 | Figure 7. America’s Top Ten Power Plants for Mercury Pollution, 2011 |
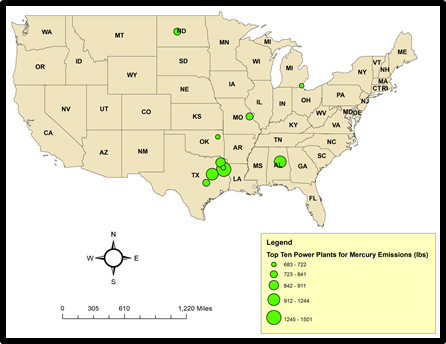 | Figure 8. Top Ten Power Plants for Mercury Pollution, 2011 |
3.6. Factors and Efforts
The factors fuelling the frequent exposure of African Americans to mercury are not farfetched. They consist of socio-economic elements of land use regulations, politics and weak policy, economic variables and socio-cultural leanings in the country and the local areas where people of colour reside. While these elements are presented one after the other bellow, see the appendix for more on the efforts of different entities to mitigate the problems. Settlement patterns and bad land use regulations have much to do with where blacks live. As a result, African Americans are far more likely to live near power plants, waste sites and the epicentres of environmental hazards. Because settlement patterns near these sites are often dictated by local zoning ordinances, it increases the likelihood of exposure and health risks under a setting in which majority of African Americans live in areas where the air quality falls below EPA standards. Under such poor regulatory standards, African Americans who make up 13% of the US population remain disproportionately represented in areas with poor air quality that are often associated with mercury exposure. As at the fiscal year 2002, 71% of Blacks live in counties that violate federal air pollution standards compared to 58% of white population when it comes to exposure. With most African Americans living near a power plant, 68% of them live within 30 miles of a power plant – the distance upon which the extreme impact levels of smoke stack cloud tends to set in and accumulate in human body[9]. On the policy and political side of it, during the enactment of the initial Clean Air Act in 1970, the electric utility and power sector convinced Congress not to mandate stern pollution regulations on ageing power plants because they would soon be phased out by a much more novel infrastructure. Notwithstanding these false assumptions by the sector, much of the country’s ageing and murkiest power plants remain in operation. Even though pollution abatement technologies that effectively lessen emissions are broadly accessible, and currently in operation by numerous companies at their facilities, some are not only in violation of prescribed standards, but they do endanger air quality in communities at the margin where African Americans reside. With mercury pollution abatement now attainable, EPA seems to have lessened stringent power-plant mercury guidelines. In fact during the 2005 fiscal year, rather than demanding power plant mercury reductions, the EPA under the then Bush administration, sought for a watered down cap-and-trade measure which left power plants with the option of mercury pollution reduction or the choice of emission trading scheme which required polluters to buy emission credits from plants elsewhere[2, 27]. In an age where coal fired power plants are major sources of income and employments as well as catalysts driving the economy, they remain the principal industrial sources of mercury contamination. Aside from their economic benefits, they are generating more than thirty percent of all mercury pollution in the United States. This is even worse at the state level in Texas where they accounted for 70 percent of emissions in 2006 (Figure 9). With all the threats, the issue is not solely about the breathing of an atmospheric neuro-toxin like mercury, but rather the risks of eating contaminated fish in communities at risk especially those in the areas inhabited by African Americans.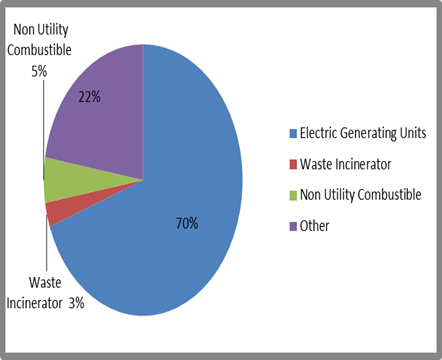 | Figure 9. Mercury Emitters in Texas, 2006 |
Seeing that much of the airborne mercury from coal powered plants ultimately end up in water bodies where it is converted to methyl mercury followed by accumulation in fish tissue, the risk levels for consumers increase. In other words, as bigger fish eats smaller ones, mercury contamination rises in the bigger fish under a process called bioaccumulation. With the sources of contamination being the power utility industry and the very engines driving the economy, there is no doubt the ingestion of mercury tainted fish in this manner is an important environmental justice issue. From every nook and corner of the country to the south east region and the study area, the pattern remains unchanged. African Americans would likely consume much of what they catch in waters contaminated by sources driving the economy, and oblivious of the health warnings than Caucasians [9].The socio cultural leaning of African Americans as ardent fishermen is also linked to mercury exposure in the Black community. In fact in 1996, there were 1.8 million licensed anglers in the community who spent over $813 million dollars on fishing trips and equipment [22]. While one third of African Americans are active anglers, they often eat fish more frequently than whites. Unfortunately exposure to mercury is directly related to the amount and type of fish consumed, so all of these factors add up to higher mercury exposure and consequently greater risks of health side effects. The possible lifestyle explanation for high rate of seafood consumption may be due to the promotion of seafood as healthy alternative to meat products high in fat such as pork or beef [9]. Culturally it was suggested that before the trans-Atlantic slave trade, many African Americans were part of coastal communities along the west coast of Africa where a culture of fishing and sea food consumption already existed and was brought with them in the new world. In addition, during slavery many African Americans joined indigenous communities, where a culture of fishing and sea food consumption thrived. Additionally, during periods of slavery and Jim Crow, fishing offered free food and places of solicitousness and harmony from the inhumane acts and laws of the time. More so, the high rate of purchased sea food may be because of easy access and the convenience for a single mother than actually fishing. These elements to some degree shaped the exposure of African Americans to mercury hazards as can be seen from the trends in the Pascagoula river area of Mississippi where many African Americans reside (Figure 10).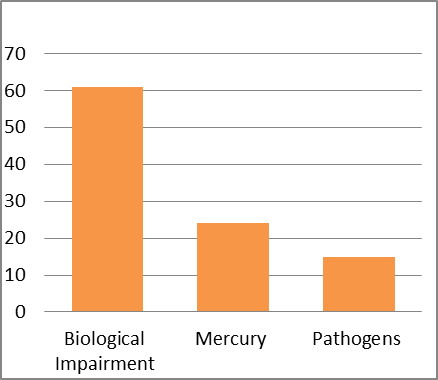 | Figure 10. Impairment Causes Pascagoula River in Percentages, 2004 |
4. Discussion
Considering the focus on the growing threats of mercury exposure [29] in the African American community, the paper did emphasize the issues, factors, impacts and initiatives to contain the menace. Building on methods of a mix scale approach connected to descriptive statistics and GIS to analyse the problems. The study revealed the occurrence of mercury threats among African Americans with serious health effect as a result of numerous factors. Aside from several initiatives to address the issue, the paper offered recommendations ranging from the need for health education and the strengthening of current policies to stem the tide of mercury threats in the Black community. Seeing that nearly thirty three per cent of all mercury contamination in the country come from power utility sites with disturbing impacts on nearby Black communities, African Americans are then more likely to reside near toxic industrial sites and consume more fish than Caucasians from mercury tainted waters. They are also more vulnerable to elevated forms of mercury exposure which continues to be flared into the atmosphere. The impacts of continual exposure of mercury in the African American community can result also in the risks of sudden Infant Death Syndrome, learning disabilities among children and other respiratory problems. All in all, mercury poses a risk to African American mothers consuming seafood because of the tendency of mercury to bio-accumulate in fish tissues and trigger adverse health effects. Notwithstanding the gravity of the problems, very little has been done to analyse the issue. As mentioned earlier, the problems did not emerge in a vacuum. They are linked to socio-cultural elements, economic factors, policy defects and the infiltration of politics and the obsession with economic benefits at the expense of the wellbeing of communities of colour. Furthermore, one of the most revealing things from the growing pace of mercury pollution stems from the existence of elevated levels of airborne mercury concentrations around Chlor – Alkali plants during the 2006 period. In line with concerns on the eventual risks posed to predominately minority communities, the breakdown of emission distribution by states puts Pioneer Americas plants in St Gabriel Louisiana and PPG industries located in the Lake Charles area of Louisiana ahead of all the states on the list. The closest sources in the same south east region with emission levels within the EPA safe threshold consists of Olin Corporation and occidental chemical in Augusta Georgia and Muscle Shoals in Alabama. Notwithstanding such classifications, their presence in built environments inhabited by African Americans remains a danger to the health of citizens in those communities. Their plights are further compounded when one finds that Black populations make up 64 to 47% of such areas in Louisiana followed by about 54.7% in Augusta Georgia and 15.6% in Muscle Shoals area of Alabama. The disparities in the ratio should not stop one from seeing the hazards of mercury exposure in these areas as real. It is calamitous for any community to be at the receiving end considering the health implications.With that comes the problem flared gases pose to the atmosphere in the study area. In the periods of 1993 through 1997, some of the plants in the area most notably in the two states of Louisiana and Georgia were active sources of atmospheric mercury. Just as the overall emissions tallies for PPG in Louisiana stood at 150,076 tons, it outpaced the 100,447 tons for Olin in Augusta and the 48,425 from Pioneer in St Gabriel. Seeing the distribution patterns, there is no doubt these operations in study area were major contributors of mercury flaring in a setting in which African Americans are forced to bear the brunt of accumulated ecological liabilities that come with it. The fact that Black communities barely catch a break from the discomfort, the rising frequency of onsite releases of mercury from electric utilities in 2007 consists of emissions into the air and the surrounding head waters in places with sizable Black populations in several states. The states in question from Alabama, Georgia, Louisiana, Mississippi, New York, Texas to Virginia accounted for a total of 33,500 lbs made up of onsite releases. The classification of releases from electric entities shows three states (Alabama, Georgia and Texas) with high level of mercury disposal. Two others Louisiana and Virginia had medium emission levels while Mississippi and New York posted lower discharges of emissions of mercury at levels big enough to impact African Americans. The GIS mapping of the threats points to concentration of mercury sources in various areas at the expense of African American communities in the vicinities. Accordingly, GIS technique as used here provides a decision support mechanism for planners in analysing the indices and mercury induced stressors from various sources in the area. In doing so, this capability showed the extent and form of mercury hazards to which African Americans are continuously exposed to in the study area.
5. Conclusions
This study focused on an analysis of mercury exposure on African Americans along the south east and mid-Atlantic region of the county with some noteworthy outcomes: a) Mercury exposure seems clearly evident; b) mix-scale methods quite reliable in showing the threats; c) exposure to the hazards accentuated by different elements; d) the study pinpointed emerging risks in the area; e) the analysis ushered in an index for tracking mercury threats. Essentially, the threats of mercury exposure to African Americans in the study area starting from the mid-Atlantic to the South East region remains obvious and should not be overlooked considering the level of emissions and the impacts on the ecosystem, the variety of sources, the communities at risk, the spatial concentration of the hazards, the efforts and the factors fuelling the recurrent discharge of mercury. The exposure to mercury was not only evident, but the results reveal the occurrence of the threats in areas with African Americans as a result of numerous factors [2]. These were manifested by 35,500 lbs. of onsite toxic mercury emissions from power utilities in 2002, coupled with elevated levels of airborne concentrations and high emissions in 3 states with black populations (Alabama, Texas, Georgia). This is compounded by the presence of the top 50 dirtiest and top 10 power plants for mercury pollution and spatial dispersion of the threats. The risks of exposure in the study area is so pervasive that about 384 mercury fish consumption advisories were issued in 2011 (Tables 3-6, Figs 2-5). With the growing incidence of maternal mercury exposure in New York and South east Virginia, Blacks bear greater brunt given their rate of fish intake and presence at the epicentres of the risks due to socio-economic and policy factors. Considering these risks, it is clear that the concentration of emission sources in that manner coupled with their levels of discharge does more harm than good to the affected communities. With the vulnerability to unwanted exposure to mercury quite prevalent in the vicinity of Black communities as has been the case over the years, it came as no surprise that the area experienced hundreds of mercury fish consumption advisories that were in effect due to looming dangers to the adjoining marine ecosystem. Considering its relevance and based on the analysis, mix-scale remained helpful in showing the threats of mercury. In that regard, spatial technique of GIS as a mix-scale tool was quite instrumental with some promise in visualizing the nature of threats and the patterns of dispersion in mercury exposure and the sources. Without such a temporal-spatial framework, decision makers run the risk of prescribing mitigation and abatement strategies using faulty blueprints at the expense of effective mercury abatement measures at the source in affected states. Realizing the risks to African Americans, the analytical use of GIS maps in discerning the distribution patterns and levels of emissions of mercury in various states remains timely. Dissecting the dispersion of mercury sources in the form of 50 dirtiest polluting plants, fish mercury consumption advisory, top 50 polluting power plants and mercury distribution by region for abatement purposes is indispensible in safeguarding communities threatened by recurrent mercury emission. With the pace and gravity of emissions inherent in the area, the timely applications of GIS mappings in that setting is not only vital in pinpointing areas with larger concentration of emitting plants and quantity dispersed across states, but it provides beneficial uses pertinent to county managers in weighing mercury stressors impacting fishing habitats and the built environment. Accordingly, GIS technique as used here provides a decision support mechanism for planners in analysing the indices and mercury induced stressors from various sources in the area. In doing so, this capability vividly highlighted the extent and form of threats to which communities are exposed to in the study area. The display of spatial information, including dimensions associated with mercury plants, fish advisory, location of dirtiest and top plants emitting mercury is especially vital due to its potential as a means of communication. For instance, maps are essential in conveying to policy makers and regulators about the level and nature of emissions. Considering the nature of exposure to the hazards, they did not seem to have emerged in a vacuum. As the study indicates, they were accentuated by different elements. Just as presented in the results, efforts were made to determine the factors associated with the threats posed by mercury exposure in communities of colour. In pinpointing the growing dangers of mercury concentration and the trends among a variety of sources as manifested in fish advisories, and the activities of power plants. The findings not only reflect a timely piece of work but a major step in indicating the dangers of pollution threats in areas adjacent to the head waters of the respective states. Knowing the risks of spatial dispersal of such stressors would benefit regulators in the crafting and monitoring of quality standards for the head waters and the built environment. In the absence of such benefits, regulators will face uphill battles in mitigating ecosystem strain on affected communities. Considering that various elements (from zoning to policy and politics) associated with the mercury exposure was not factored previously. The role of these factors in fuelling the mounting dangers as shown by fish advisory and emission concentration merits prompt attention from government entities charged with the task of safeguarding the environment using the index developed herein. In light of this, this study not only finds a practical use, but the measurement of various dimensions of mercury exposure in the study area that had not been detected before could emerge as a priority for managers. The ability of this project to unveil elements behind the exposure in the region shows the assessment can serve as a viable tool for promoting mitigation measures needed in crafting mercury containment policy. The analysis of links between mercury exposure or factors known to fuel emission and the way it impacts communities of colour is an indication of the promise of this study in helping identify predictors of emission dangers.In seeing the factors associated with mercury emission and the threats to the surrounding ecology as indicated in the analysis, the paper therefore did create a road map for tracking and pinpointing these elements as conduits for strengthening response mechanisms. To a great extent, managers will have enormous chance to appraise the characteristic of the risks across time by assessing their impacts with regular preparedness. Being a step forward toward mitigation and protection, the documentation of these factors, strengthens the attentiveness of policy makers in tracking the state of and the role of limiting elements in impeding mercury pollution abatement. This would allow states and communities design the right measures for minimizing the effects of any risks. In that way, the study injects an ecological protection and risk assessment dimension which is crucial in identifying mercury risks and keeping vulnerable communities and the fragile ecosystem protected from the menace of mercury exposure across the various states. The fact that the risks attributed to these factors come with impacts capable of disrupting any region’s environment makes the assessment herein an alternative way for tracking the risks of mercury exposure in the different areas. At the same time, the project offers decision makers an improved understanding and awareness of these risks and should not be underestimated.Designing an index for tracking mercury emissions at the mix scale based on a snapshot of the various levels from different sources as presented here is an improvement to the previous efforts when this study was initiated. With the dangerous levels of mercury in fishing habitats, the atmosphere and the threats to communities of colour and the discharge levels of some of the dirtiest sources. It is obvious that based on the trends, there is a growing pace of emission with large quantity discharged into water environments and those ingested based on the mercury index that managers are unaware of. If the regulators had an adequate monitoring mechanism during these years, they would have been able to track the threats of fish advisories and the discharge levels with effective control of mercury emissions. This is attributable to the absence of an index for gauging dangerous levels of mercury and the threats to African Americans. By showing such indices for the purposes of aiding monitoring, and directing the location of polluting industries to suitable areas, the study did fill a void in a relevant area. This will allow for a quick appraisal in the display of mercury emission trends and concentration levels in communities at risk. In critical situations, such an approach affords regulators and the industry a framework for adopting abatement technologies necessary in containing the risks of mercury exposure in Black communities. As a conduit for effective risk appraisal, the findings as shown herein serves the needs of planners in weighing the significance of emerging thresholds and patterns and their effects on the health of local communities. Guiding decision makers through such a framework improves the ability to track practices that may counter set targets for cutting down threatening emission levels to the benefit of vulnerable communities. Seeing the vulnerability of Black community to environmental stressors like recurrent mercury exposure, the risks from the activities of power utility facilities central to the economy along with the efforts towards containment and other findings of this research. Decision makers and regulators and the power utility entities implicated in the region would have ample work to do as they strive towards the minimization of mercury exposure among communities of colour and the surrounding ecology in the years ahead. To arrive at the anticipated solutions, a set of essential questions would need to be directed to the respective actors from the Black community, the emission sources, policy makers and the regulators. What would the Black community do to strengthen awareness about the risks posed by mercury exposure through their socio cultural practices? Will emission levels of the industry exceed current scales in the foreseeable future? How will the power utility sector address the liabilities emanating from the industry? Will future regulations be able to meet the mounting challenges posed by recurrent hazards? How will spatial patterns of the risks be manifested next time around? Seeing the framing of these questions, there is a great opportunity through all these for researchers and decision makers to redirect the strategy needed in containing mercury exposure with robust policy that emphasize proactive mitigation built on command and control mechanism. There is also a need for polluter pay principle, education of affected communities about the risks and the support for continuous mapping of the hazards. This would go a long way in safeguarding these communities and the adjoining environments from liabilities emanating from the power utility sector in the years ahead.
Appendix
3.5. Efforts
Many organizations both private and public have been quite active in mitigating the hazards posed by mercury emissions to most communities in the country where African Americans reside. With a focus on prevention, awareness, recovery and abatement, education and regulatory compliance, the efforts by these actors center on investment in abetment technology and reductions in mercury emission. Others include the raising of awareness on the threats, increasing the level of alerts in the event of emission discharges in high risk areas or places often used by the public.
3.5.1. Gaston Power Plants Investing in Mercury Pollution Abatement Technologies
With many Alabama Power plants working to decrease mercury emissions considerably using effective pollution abatement technologies, the Gaston plant continues to be a major player in that regards. Given the growing dangers posed by mercury emissions on the surrounding communities as well as the health concerns, the company has undertaken mitigation projects worth about $400 million at the Gaston plant. While this was intended to decrease emissions, additional $650 million focused on infrastructure enhancements are also in progress at the Gaston plant. After the completion, the expectation is that mercury emissions from the plant will have been contained by 90 percent from its previous rates. In the process, the company has decreased mercury emissions by over 40 percent in the last 8 years [2, 27].
3.5.2. Voluntary Reduction of Mercury Emission
Luminant Power Corporation has been working more than most companies in the country to willingly reduce mercury emissions from its coal-fueled power plants. The company’s decision in voluntarily setting up activated carbon injection systems on many of its coal-fueled power plant units shows a commitment to enhancing air quality and the environment with a step ahead of state or federal mandates. Installing such kind of equipment accelerated the reduction of the company’s mercury emissions by over 20 percent since 2005, notwithstanding the adding of new 2,200 MW of coal-fueled components. In keeping with Luminant’s emphasis on mitigation and regular investments in mercury emission abatement techniques, the company did set aside about $300 million to upgrade emission control equipment in various areas of operation. At the same time, close to $80 million was devoted to the Martin Lake Power Plant with a view to lessening the discharge of mercury and SO2. Furthermore, Luminant had also been actively engaged in pioneering research and development initiatives aimed at delivering various mercury control technologies and monitoring devices at a number of its power plants. To that effect, for almost a decade Luminant partnered with the US Department of Energy, US Environmental Protection Agency, the University of Texas at Austin, Electric Power Research Institute and other research institutions on more than 40 projects evaluating different technologies to control mercury emission [27].
3.5.3. Environmental NGOs Actively Raising Awareness about the Dangers of Mercury
The ongoing efforts towards the containment of mercury emissions in communities at the margin are not confined to the private sector solely. Concerned environmental NGOs are taking up that task as part of their policy mandate by raising awareness on the dangers posed by mercury emission. To that effect, a new report released by the National Wildlife Federation shows dangerous levels of mercury in rain, lakes and waterways in Mississippi. Given the predicament of the people and implications on the ecosystem, the organization noted the state is not doing enough to avert the flow of mercury into the food chain. While the mean level of mercury concentration found in all 12 states studied were higher than the environmental protection agency’s maximum safe level, the EPA only considers mercury levels below 3.5 nanograms per litre in lakes to be safe for fish consumption. However, in the case of Mississippi, 97.3% of the rain samples surpassed that threshold. With fish eating advisory directed at seven rivers by the state, three of these lakes are along the Gulf coast. From the study, the most groups in danger consist of youngsters and the unborn that are vulnerable to neuro developmental deficiencies due to the threats of mercury. The study noted further that mercury blood levels of 1in 12 women of childbearing age across the country exceed EPA’s safe limits for safeguarding the fetus.
3.5.4. State and Federal Entities Alerting Communities about the Risks of Mercury Exposure
The impacts of Mercury hazards has never been a respecter of different jurisdictions be they federal or state. In the context of these jurisdictions nationwide, coal-fired power plants emitted 138,259 pounds of mercury in 2009. At the same year, power plants in Texas alone emitted 16,350 pounds of mercury pollutants more than any other state. Additionally, power plants in the Top 10 worst-polluting states, including Texas, accounted for 56 percent of all mercury emissions from power plants. Realizing these problems, it came as no surprise that both the US EPA and Texas Department of Health Services have been very active over the years in raising the alarm over the threat levels of impending mercury contamination. The fact that many US waters are closed to fishing because of mercury contamination, the US EPA wasted no time in finding out that the several waterways (of Angelina River/Sam Rayburn Reservoir, Black Cypress Bayou, Caddo Lake, and Lake Daingerfield) in the state were laced with large concentrations of the neuro-toxin. In as much as twelve mercury fish consumption advisories were issued for Texas water bodies since the state began issuing such advisories in 1988. Accordingly, the Texas Department of State Health Services considers the issuance of fish-specific mercury advisories necessary if testing finds mercury presence at or higher than 0.7 mg/kg. With nine of the alerts directed at freshwater lakes covering a total of 363,000 acres of surface water, or approximately one in five lake acres in the state. The balance of advisories covered one 40-mile river segment, one 17-mile estuary, and one advisory for the entire Texas Gulf Coast. Of the lake acres covered by advisories, over half were in Toledo Bend and another third in Sam Rayburn Reservoir [28].
References
| [1] | United Nations Environment Programme (UNEP). (2013). Global Mercury Assessment Sources, Emissions, Releases and Environmental Transport. UNEP Chemicals Branch, Geneva, Switzerland. 1-31. |
| [2] | Merem, E C. (2015). Mercury Exposure In The African American Community. Proceedings of The 23rd Joint Conference of the National Association of African American Scholars (NAAS), Baton Rouge: Louisiana, February 2015. |
| [3] | Katner, A. (2010 November). An Evaluation of Mercury Levels In Louisiana Fish, Trends and Public Health. Science of the Total Environment. 408. 23: 1.5707-5714. |
| [4] | Mississippi Department of Environmental quality State (MDEQ). (2012). Mississippi Water Quality Assessment 2012 Section 305 b Report. Jackson, MS: Office of Pollution Control. |
| [5] | Florida Department of Health. (2014). Mercury Poisoning. Tallahassee, FL: ATSDR Mercury. |
| [6] | Environment Georgia. (2011). Georgia’s Biggest Polluters. Decatur, GA Environment Georgia Research and Policy Center. 1-21. |
| [7] | United States Geological Survey (USGS). (2000). Mercury In the Environment. Factsheet 146-00, Washington, D.C: US Department of Interior. |
| [8] | United States Environmental Protection Agency (US EPA). (2014). Health Effects Mercury. Retrieved 21st November From http://www.epa.gov/mercury/effects.htm. 1-3. |
| [9] | Keating, M. (2002 October). Air Injustice: African Americans and Power Pollution. Atlanta, GA: Georgia Coalition For the Peoples Agenda. 1-15. |
| [10] | Environmental Integrity Project (EIP). (2006). Dirty Kilowatts: America’s Most Polluting Power Plants. Washington, D.C: EIP, 1-19. |
| [11] | Environmental Integrity Project (EIP). (2012). Net Loss: Comparing the Cost of Pollution Vs. The Value of Electricity From 51 Coal Fired Plants. Washington, D.C: EIP, 1-24. |
| [12] | Buchannan, L. (2004). Mercury Exposure In Children: a Review. Toxicology and Applied Pharmacology. 198: 209-230. |
| [13] | Grandjean, P. (1997). Cognitive Deficit in 7- Year Old Children With Prenatal Exposure to Methylmercury. Neurotoxicology and Teratology. 19: 16 417-428. |
| [14] | Basore, C. (2014). Maternal Mercury Exposure, Season of Conception and adverse Outcomes in an Urban Immigrant Community in Brooklyn, New York, USA. International Journal of Environmental Research and Public Health. 11 8414-8442. |
| [15] | Hollman, E. (2010). A Community Assessment of Sea Food Consumption Along The Lower James River Virginia USA; Potential Sources of Dietary Mercury Exposure. Environmental Research. 110:213-219. |
| [16] | Ozuah, P. (2003). Mercury Exposure in an Urban Pediatric Population. Ambulatory Pediatric s. 3:1: 24-26. |
| [17] | Wentz, D. (2014). Mercury in the Nations Streams –Levels , Trends, and the Implications. Reston, VA US GS Circular 1395. |
| [18] | Johnson, C. (1999 May). Elemental Mercury Use in Religious and Ethic Practices in Latin American and Caribbean communities in New York City. Population and Environment. 20:5: 443-453. |
| [19] | Riley, D. (2001 August). Assessing Elemental Mercury Vapor Exposure from Cultural and Religious Practices. Environmental Health Perspectives. 109: 8: 779-784. |
| [20] | New Hampshire Department of Environmental Services (2003). Environmental Fact Sheet Mercury: Sources, Transport, Deposition and Impacts. Concord, NH: New Hampshire Department of Environmental Services. |
| [21] | Gibb, H. (2014). Mercury Exposure and Health Impacts Among Individuals in the Artisanal and Small Scale Gold Mining Community: A Comprehensive Review. Environ mental health perspective. 122:7:667-672. |
| [22] | Bowes, C. (2014). Mercury Pollution From Coal Fired Plants A Dangerous Thing To People and Wild life. Washington, D.C: National Wildlife Foundation. |
| [23] | United States Bureau of Census. (2013). Census Quick Facts. Washington, D.C: US Bureau of Census. |
| [24] | Natural Resource Defense Council (NRDC) (2006 April). Issue Paper Lost and Found Missing Mercury From Chemical Plants Pollutes Air and Water. Washington, D.C: NRDC. |
| [25] | Virginia Department of Environmental Quality (VDEQ). (2008 February 13). VDEQ Mercury Study: Mercury Deposition Modeling: For The Virginia Mercury Study Final Report: Richmond, VA: VDEQ. |
| [26] | Louisiana Department of Environmental Quality (LDEQ). (2016). Average Concentration of Mercury ppm in Largemouth bass fillet Samples from 12 Northern Louisiana Lakes. Retrieved 4th February From http://www.deq.louisina.gov/portal/Programs/Mercury/initiative/summary of Issues.aspx. |
| [27] | Glynn, W. (2008 November). Alabama Ranks Number One: In Mercury Pollution. Locust. New American Journal. 1-5. |
| [28] | Chief Engineer’s Office. (2006 November). Mercury In Texas: A Report to A Report To 79th Texas Legislature. Austin, TX: Government of Texas, Texas Commission On Environmental Quality, 1-67. |
| [29] | The Encyclopedia of Earth. (2014). Health Effect of Mercury. Retrieved 22nd December Fromhttp://www.eoearth.org/view/article /153405/ on 12/22/2014. |

 Abstract
 Reference
 Full-Text PDF
 Full-text HTML