-
Paper Information
- Next Paper
- Previous Paper
- Paper Submission
-
Journal Information
- About This Journal
- Editorial Board
- Current Issue
- Archive
- Author Guidelines
- Contact Us
Frontiers in Science
p-ISSN: 2166-6083 e-ISSN: 2166-6113
2013; 3(2): 66-70
doi:10.5923/j.fs.20130302.03
An Application of Analytical Hierarchy Process for Simulation Software Selection in Education Area
 Abstract
 Reference
 Full-Text PDF
 Full-text HTML
Suay Ereeş1, Emel Kuruoğlu2, Nilgün Moralı3
1Department of Statistics, Yaşar University, Izmir, Turkey
2Department of Computer Sciences, DokuzEylül University, Izmir, Turkey
3Department of International Trade and Logistics, HasanKalyoncu University, Gaziantep, Turkey
Correspondence to: Suay Ereeş, Department of Statistics, Yaşar University, Izmir, Turkey.
| Email: |  |
Copyright © 2012 Scientific & Academic Publishing. All Rights Reserved.
In recent years, there are many developments and differences in software products which are used for simulation applications in many fields such as education. These developments in simulation software make it difficult for users to choose the most appropriate simulation package for their interest. Because of only the softwares which meet the system requirements will succeed, choosing simulation software package becomes an important issue and has vital importance. Hence to make this choice, applying Analytical Hierarchy Process (AHP) which is a multi-criteria decision making method and used for systematical decisions is very convenient and makes the decision process faster. In this study, the most important criteria determined by experts and academicians were discussed and compared to choose the most appropriate simulation software program for education area.
Keywords: Simulation Software Selection, Analytic Hierarchy Process, Multi Criteria Decision Making, Education Sector
Cite this paper: Suay Ereeş, Emel Kuruoğlu, Nilgün Moralı, An Application of Analytical Hierarchy Process for Simulation Software Selection in Education Area, Frontiers in Science, Vol. 3 No. 2, 2013, pp. 66-70. doi: 10.5923/j.fs.20130302.03.
1. Introduction
- Simulation is a method that has a wide application area used for modelling and analysis. Simulation models are used in such areas as manufacturing, health and military. Increase in the usage of simulation models results in a requirement for simulation software programs. Thanks to the achievements in technology and computer software engineering, lots of software packages with different features have been developed. There are approximately 60-70 simulation models with different features available. Some of them are ARENA, Simulink, GPSS etc. These softwares differ from each other as per some aspects such as their prices, the technical support provided and capacity of carrying out statistical analyses. Naturally, choosing and using of appropriate package program that meets the needs of systemic requirements at an optimum level and demands of users have great importance. However, many package programs with different features make the decision process more difficult for the users.Development in simulation packages contributes these package programs to have lots of features and capacity for meeting the criteria. Very developed programs have lots of features but are offered for sale with huge prices. On theother hand, budget friendly programs could not meet variousrequirements. Determining right criteria is crucial inchoosing the most appropriate software package program for the relevant application area. These criteria differ from person to person or firm to firm. Criteria are determined by consulting to opinions of experts and program dealers.Several publications related to the users’ surveys are found in simulation literature[3],[4],[6],[7],[8].Determination of necessary criteria for choosing the simulation software package requires developing of a multi criteria decision model. Such models are developed as hierarchical structures. Generally, a target situation specifying main aim is chosen and sub-targets (criteria) are determined in relation to relevant target situation and significance levels are attributed for these criteria. The person that performs the analysis is liable to pay attention to the integrity of sub-criteria and concordance of them with main target and creating the model with an appropriate structure. Lots of methods have been developed with an aim to create a multi criteria decision model. The most frequently used method is AHP[5]. This method has been used for this study.
2. Materials and Methods
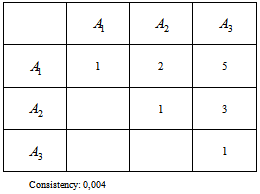
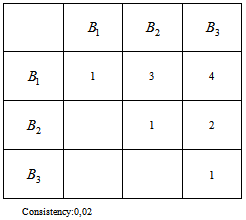
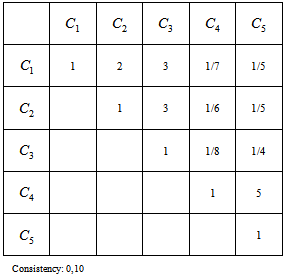
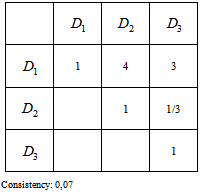
- Analytic Hierarchy Process – AHP is a multi-criteria decision making technique developed by Thomas L. Saaty[1],[10]. There is a wide application area of AHP approach. Some application samples could be categorized as choosing the database, finance, macroeconomic estimation, product design, choosing the portfolio, distribution of resources (budget, energy and health), political strategy, transportation, education, choosing of the area of facility and technology transfer. The most important difference of AHP when compared to other decision making approaches is its capacity of taking individual judgments of decision maker into consideration.A hierarchy is primarily built that describes the problem in AHP model. The aim is placed on the top. Criteria appear on the sub-levels of this aim. Alternatives are placed on the lowest level. Priorities are determined for the aim via realizing paired comparison of criteria at all levels. If a decision is to be made about alternatives, paired comparisons are realized between them. Significances are retrieved and assessed for alternatives.Paired comparison process is realized as comparison of the ones at a lower level in relation to the criteria at an upper level. The matrix below is obtained as a result of paired comparisons:[9]
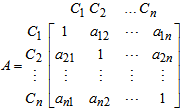 | (1) |
 = criterion i and
  = importance of criterion i according to criterion j and
 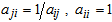 in paired comparison matrix[2]. If criterion
  is
is  times important as per criterion
  , Criterion
  becomestimes important as per
  . Choices are stated as per the scale 1-9 as explained in Table 1[1]. Intermediate values not situated in the table could be used in creating comparison matrix. Alternatives are taken as independent ones while stating choices.
|
3. Results and Discussion
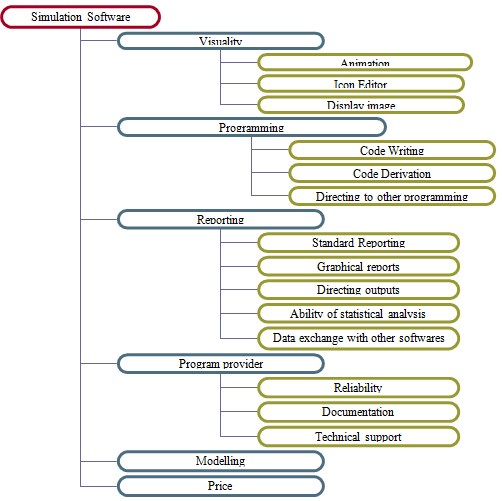
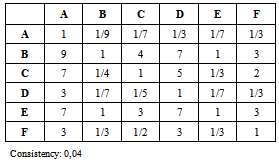
- The problem is defined in this study as determining the criteria to be taken into consideration by simulation program users working in the field of education. Application includes determining priorities of main criteria via AHP application with the contribution of hierarchical model. Therefore, 13 experts working in the academic field have been requested to make paired comparisons of some criteria chosen through benefiting from articles of researchers who have lots of studies in this field and opinions of experts. These experts have also been requested to fill an information form for the related objective. AHP technique has been applied to retrieved data via using Expert Choice program and their analyses have been made.Six main criteria have been chosen from various articles written on simulation software package and after receiving the opinions of some experts. These are the criteria of visuality, programming, reporting, program provider, modelling and price. Visuality comprises of all visual themes that will be provided by the software. Animation, icon editor and display image have been determined as sub-criteria. It is stated that whether it is possible to provide animation of simulation trials and whether it is possible to provide easiness such as using icons with icon editor or manipulating with hand. Model animation and image of the graphics on screen are implied with the expression of display image. Whether the user sees the model as a whole when the size of the image of the model surpasses the sizes of the screen constitutes the content of this feature.Programming comprises of writing codes, deriving codes and sub- criteria for directing to other programming languages. Writing codes is not only a process enabling the realization of functions on menus but also additional functions with the process of code writing. Code derivation is described as providing developable program code for simulation model and this feature is strongly required for modelling of complex systems. The feature of directing to other programming languages is described as allowing to make simulation modelling via another programming language such as FORTRAN by writing codes. If the software program does not have the feature of code derivation or code writing or using any other programming language is easier for the user, this feature becomes very practical. Main criterion of reporting has five sub-criteria. The term of standard reports criterion is used to explain the process of producing of standard reports such as queue length and waiting time and presentation of them in the form of statistical graphics such as graphical reports and the presentation of outputs as histograms and bar diagrams. Sub-criterion of directing outputs expresses the capacity of software to send the results to a hardcopy appliance such as file, printer or plotter. Ability of statistical analysis is the term including all statistical results such as the average, variance, confidence intervals and statistical dispersions to be provided by the software and is of vital importance. For instance, goodness of fit test is applied to observe how far simulation results are from the real system and this gives an important idea for the users about reliability. Criterion of data exchange between other softwares expresses the capacity to send data to various software systems such as plot programs, statistical programs and Word; it also explains the capacity to take back data from these softwares. This criterion facilitates the process for users when particularly complex systems are wished to be modelled.
 | Figure 1. Hierarchical Model for Simulation Software Selection |
|
|
|
|
|
|
4. Conclusions
- Variety of package programs in which simulation applications could be realized in relation to the increase in the usage of simulation method and great importance of choosing the appropriate one among them are mentioned in this study. Education has been chosen as application field and main criteria that should be included in the most appropriate simulation package program have been decided via AHP technique. Main features that should be included in simulation software packages to be purchased with the aim of education have been determined as the ability of programming, reporting and modelling on the basis of data gained in this study and AHP technique applied in the program of Expert Choice. It is understood from these results that the capacity of software for writing programs (codes), doing statistical analyses, producing results in standard reports and graphics and providing flexibility of modelling in such a way that it enables the development of simulation model are the reasons for their preference by the users.Visuality and price criteria are the ones to which users do not attach importance and take into account while purchasing simulation software package. Nevertheless, reliability of program provider and the support to be provided are generally the last ones as per importance levels. This fact could be explained as this criterion is only important for the beginner users of softwares.
References
| [1] | Dyer, R.F., E.H. Forman (1991), An Analytic Approach to Marketing Decisions, Prentice Hall, NJ. |
| [2] | Genest, C., S.-S. Zhang (1996), “A Graphical Analysis of Ratio-scaled Paired Comparison Data”, Management Science, 42(3), 335-349. |
| [3] | Hlupic, V., (2000), “Simulation Software: An Operational Research Society Survey of Academic and Industrial Users”, Proceedings of the 2000 Winter Simulation Conference, (2000), 1676-1683. |
| [4] | Hlupic, V., Irani, Z., R. J. Paul (1999), “Evaluation Framework for Simulation Software”, The International Journal of Advanced Manufacturing Technology, 15(5), 366-382. |
| [5] | Kuruüzüm, A., N. Atsan (2001),“AnalitikHiyerarşiYöntemiveİşletmecilikAlanındakiUygulamaları”, Akdeniz İ.İ.B.F. Dergisi, 1, 83-105. |
| [6] | Law, A.M., S.W. Haider (1989), “Selecting Simulation Software for Manufacturing Applications: Practical Guidelines and Software Survey”, Industrial Engineering, 21, 33-46. |
| [7] | Mackulak, G.T., Cochran, J.K., P.A. Savory (1994), “Ascertaining Important Features for Industrial Simulation Environments”, Simulation, 63(4), 211-221. |
| [8] | Nikoukaran, J., Hlupic, V., R. J.Paul(1998), “A Hierarchical Framework for Evaluating Simulation Software”, Simulation Practice and Theory, 7, 219-231. |
| [9] | Saaty, T.L. (1977). “A Scaling Method for Priorities in Hierarchical Structures”, Journal of Mathematical Psychology, 15: 57-68. |
| [10] | Saaty, T., L., (1994), “How to Make a Decision: The Analytic Hierarchy Process”, +Interfaces, 24, 19-43. |