-
Paper Information
- Next Paper
- Previous Paper
- Paper Submission
-
Journal Information
- About This Journal
- Editorial Board
- Current Issue
- Archive
- Author Guidelines
- Contact Us
Frontiers in Science
p-ISSN: 2166-6083 e-ISSN: 2166-6113
2013; 3(1): 22-26
doi:10.5923/j.fs.20130301.04
Three Dimensional Micro-image Analysis of Nonwoven Structure
 Abstract
 Reference
 Full-Text PDF
 Full-text HTML
Subhankar Maity1, Kunal Singha1, Mrinal Singha2
1Department of Textile Technology, Panipat Institute of Engineering & Technology, Harayana, India
2Department of Pharmaceutical Chemistry, CU Shah College of Pharmacy & Research, Gujarat, India
Correspondence to: Kunal Singha, Department of Textile Technology, Panipat Institute of Engineering & Technology, Harayana, India.
| Email: |  |
Copyright © 2012 Scientific & Academic Publishing. All Rights Reserved.
Different techniques of micro-image analysis of nonwoven structures have been discussed in this article. The characteristic features of these techniques have been critically examined. The instruments used of these techniques have been described with schematic diagrams. The advantages and disadvantages to the techniques have been discussed as well.
Keywords: Micro-Image Analysis, Nonwoven Structures, Characteristic Techniques
Cite this paper: Subhankar Maity, Kunal Singha, Mrinal Singha, Three Dimensional Micro-image Analysis of Nonwoven Structure, Frontiers in Science, Vol. 3 No. 1, 2013, pp. 22-26. doi: 10.5923/j.fs.20130301.04.
Article Outline
1. Introduction
- The term ‘nonwoven’ arose from more than half a century ago when nonwovens were often regarded as low-price fibrous materials as the substitute of traditional textiles and were generally made from dry laid carded webs using converted textile processing machinery. Especially the yarn formation process was omitted and fabric was developed directly by bonding the fiber web in various ways. Nonwovens are made by means of assembling short (staple fibers) or infinitely long fibers (continuous filaments) on top of each other and bonding them together via a mechanical, thermal or chemical process. Now nonwovens are most vital in various technical textile applications due to their better functionality, specific properties and ease of manufacturing. The majority of air filters, wipes, insulations, barrier fabrics, surgical masks, cosmetic/hygiene products and dippers are made of such nonwoven materials. Nonwovens can be dense and strong, as in woven fabrics, or porous and compressible, as in foams. The analysis of nonwoven structure helps to improve the products, products performance, and in the technologies for manufacturing these products. The analyses of three dimensional nonwoven structures are mainly based on the image processing technique[1-5].
2. Three Dimensional Image Processing
- The image processing technique which is used for the 3 dimensional structure cannot the give the good results, because the images taken has very poor resolution in the thickness direction of the nonwoven fabric. So to estimate the complete structure the slices are cut from the sample and analyze it as two dimensional structures, the assumption is taken that fibers are aligned in the fabric plane and nearly vertical to the fabric plane. There are two methods to analyze the three dimensional structure of nonwoven as following[6,8, 9, 12-16]. ● DVI Method (Digital Volumetric Imaging)● Tomography
2.1. DVI Method (Digital Volumetric Imaging
- Digital Volumetric Imaging (DVI) is advancement in digital microscopy that for the first time permits routine generation of high-fidelity three-dimensional images of nonwoven materials. Digital Volumetric Imaging has allowed us to obtain structural information of nonwoven structures. In the past, researchers were hampered by 3-D images that were limited in depth (in the “z” dimension). Then 3D imaging methods depends on taking serial sections from a sample of block and rendering these images to 3D format. With DVI, detailed light microscopic images can be obtained sequentially millimeters deep into a structure, and are automatically registered and presented with convenient visualization software. Using DVI, we are able to define the orientation of fibers in 3D space, the permeability, porosity, packing & filtration capacity of the nonwoven structure. DVI is a fluorescent imaging technique[6-8].Samples are prepared by florescent technique, dyeing of fibers, dehydration and embedding the sample in polymer resin. Image acquisition is performed by automated slicing of polymer matrix and taking microscopic images. These 2D images are then combined to construct a 3D image. The DVI Microimager captures high-resolution virtual sections directly from the nonwoven block's surface. This process, also called surface imaging microscopy, permits the collection of a much greater amount of information from each sample by automating the collection of large numbers of serial sections. In essence, the DVI Microimager images a section before it is cut from a sample, rather than after, eliminating the need to produce histologic sections. This breakthrough makes possible automated serial sectioning of entire samples, and the production of unprecedented three-dimensional digital representations. At present, the DVI Microimager can be able to image at the resolutions and corresponding sample sizes as shown in Table 1[6-10].
|
2.2. DVI System Components
- DVI has three principal and proprietary components, ● DVI Sample Block● DVI Microimager for image processing, and ● RESView Interface Visualizer with Data analyzer.
2.3. DVI Sample Block
- It is eliminating the need to mount specimens on glass microscope slides. Samples are trimmed by the user and put into a proprietary transport vial that limits the size of the sample to an imagable size. The processing of the sample is more highly automated than in standard histologic microscopy because in DVI the entire sample is stained instead of just a section from it. After staining, the sample is passed through a series of solvents and finally into the company’s proprietary pacified polymer to form a black, precisely configured block ready for the DVI Microimager[6,8].
2.4. DVI Microimager
- The DVI Microimager is an integrated system that includes an illumination light source, filter wheel, robotically controlled microtome, diamond knife cutting assembly, high-end CCD array camera and control computer. In the DVI Microimager, a sample is clamped in a robotic microtome and moved on a motorized translation stage, cutting the top 0.5 to 4 microns on a diamond knife. After capturing an image of the surface of the block, the next cut is made and then a servo-controlled platform advances the block by a distance exactly equal to the amount of material removed from the surface. Image data is collected through epiilumination fluorescence microscopy optics in multiple color channels, and the resulting optical images are captured on a high-end CCD array camera. The DVI Microimager repeats this process approximately 300 times per hour, automatically storing the information on a hard drive. As the images are collected, each may be shown on a computer display to the laboratory operator. DVI can be operated in a 2D-only mode, or by repeating the serial collection of thousands of precisely registered two-dimensional images per sample, DVI can form the raw material for a high-fidelity 3D digital copy. The two modes are entirely compatible and could be selected from sample to sample[6,20].
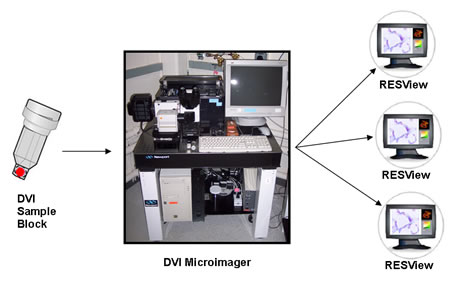 | Figure 1. DVI System Components[6] |
 | Figure 2. Schematic of DVI micro imager RESView Interface Visualization[6] |
2.5. Advantages of DVI
- 3-D model can be used to easily compare manufactured part to design intent. It eliminates need to produce specimens on glass slides. It is an automated process. Accuracy is in the micron level[21].
2.6. Disadvantages of DVI
- It is a destructive process and faster than traditional microtome, but still it is slow; about18hrs is required to process 400mm3 sample pieces. It can be expensive - ~$23,500 for workstation with hardware and software, and ~$1,000 processing costs per sample.
2.7. Tomography Technique
- Tomography is imaging by sections or sectioning. A device used in tomography is called a tomograph, while the image produced is a tomogram. In most cases it is based on the mathematical procedure called tomographic reconstruction. The word was derived from the Greek word tomos which means "a section", "a slice" or "a cutting". In conventional tomography, a sectional image through a body by moving an X-ray source and the film in opposite directions during the exposure. Consequently, structures in the focal plane appear sharper, while structures in other planes appear blurred. By modifying the direction and extent of the movement, different focal planes can be selected which contain the structures of interest[10-11].
2.8. Modern Tomography
- More modern variations of tomography involve gathering projection data from multiple directions and feeding the data into a tomographic reconstruction software algorithm processed by a computer. Different types of signal acquisition can be used in similar calculation algorithms in order to create a tomographic image. With current technology, tomograms are derived using several different physical phenomena listed in the Table 2.
 | Figure 3. Tomography Technique[10] |
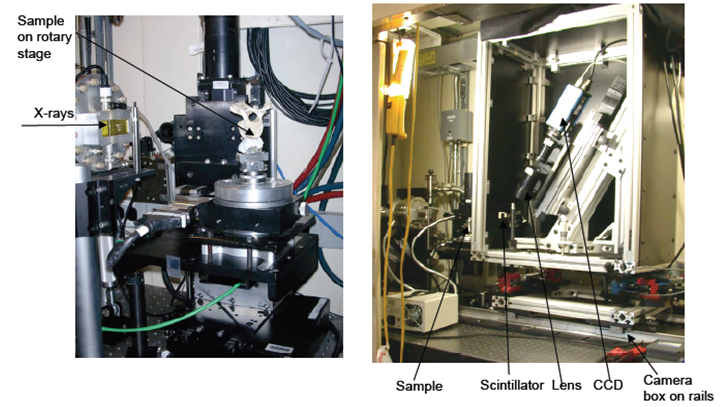 | Figure 4. Tomography Camera- Schematic[10] |
3. Conclusions
- 3-D micro-image analysis does geometric characterization of 3-D nonwoven structures and also helps in mathematical modeling. The image analysis technique detects the similarity of images, image retrieval, object detection and event detection. It also opens new opportunities such as fitting of three dimensional geometric models, computing macroscopic material properties (permeability, filtration, stability etc.) by using numeric simulations in the model or the preprocessed 3-D image. It also helps to determine optimal material parameters for the desired properties.
References
| [1] | Russel,S.J, Hand book of Nonwovens, Woodhead Publishing Ltd., 2007 |
| [2] | Wilhelm Albrecht, Hilmar Fuchs, Walter Kittelmann, Nonwoven Fabrics, 2003. |
| [3] | Pourdeyhimi, B., Ramanathan, R.; Measuring fiber orientation in nonwovens, Textile Research Journal, 66 (1996) 713-721. |
| [4] | Drobina,R, Mieczyslaw S. Machino; Application of the image analysis technique for textile identification; AUTEX Research Journal, 6(1) (2006) 40-48. |
| [5] | Kohel, L., Zeng, X., Liqing L; Digital Image Analysis to Determine Pore Size Distribution of Nonwoven Fabrics; IMACS multiconference on "Computational Engineering in Systems Applications"(CESA), October 4-6, (2006) Beijing, China. 145-149. |
| [6] | Jaganathan, S., Hooman V. Tafreshi, Pourdehymi, B ; Two-scale modeling approach to predict permeability of fibrous media; Journal of Engineered Fibres and Fabrics (special issue 2008-FILTRATION), 13 -18. |
| [7] | Pourdeyhimi, B., Mazé,B., Hooman Vahedi Tafreshi; Simulation and Analysis of Unbonded Nonwoven Fibrous Structures; Journal of Engineered Fibers and Fabrics, 1(2) (2006) 47-65. |
| [8] | Zobel, S. Maze, B., Vahedi H., Tafreshic,, Wang, Q., Pourdeyhimi, B.; Simulating permeability of 3-D calendered fibrous structures; Chemical Engineering Science 62 (2007) 6285-6296. |
| [9] | Thomas F. Gilmore, Hawthorne A. Davis; Tomographic approaches to Nonwovens Structure Definition, National Textile Center Annual Report: September (1994) 299-304. |
| [10] | Katja S; Department Models and Algorithms in Image Processing; Fraunhofer Instiut Techno-und Writschaftsmathematic; 3d Image Analysis and modeling of Microstructures. |
| [11] | Zhang Y.F., Bresee, R. R. ‘Fabrik Detection and Classification Using Image Analysis’, Textile Research Journal, 65(1) (1995) 1-9. |
| [12] | Cybulska, M., ‘Analysis of Warp Destruction in the Process of Weaving Using the System for Assessment of the Yarn Structure’, Fibres & Textiles in Eastern Europe, 5(4) (1997) 68-72. |
| [13] | Berlin J., Worley S., Ramey H., ‘Measuring the Cross-Sectional Area of Cotton Fibers with an Image Analyzer’, Textile Research Journal, 51 (1981), 109-113. |
| [14] | Wen Che-Yen., ‘Defect Segmentation of Texture Images with Wavelet Transform and a Cooccurrence Matrix’, Textile Research Journal, 71 (2001), 743-749. |
| [15] | Krucińska I., Graczyk M., ‘Review of selected methods of image analysis used for quality estimation of fibres and yarns (in Polish)’, Proceedings of the 2nd Scientific Conference of the Textile faculty of the Technical University of Łódź, J-22 (1999) 5-8. |
| [16] | Wu Y., Pourdeyhimi B., Spivak M. ‘Texture Evaluation of Carpets Using Image Analysis, 61 (1991), 407-419. |
| [17] | Pourdeyhimi, B., Dent, R. and Davis, H., Measuring Fiber Orientation in Nonwovens, Part III: Fourier Transform, Textile Research Journal, 67 (2011) 143-151. |
| [18] | Tanaka, S., and Deshpande, A., "Measuring Fiber Orientation in Nonwovens, Part V: Real Fabrics", Textile Research Journal, 69 (2009) 185-92. |
| [19] | Pourdeyhimi, B., Ramanathan, R., and Dent, R., "Measuring Fiber Orientation in Nonwovens, Part II: Direct Tracking", Textile Research Journal, 66 (2008) 747-753. |
| [20] | Thorr, F., Drean, J. Y., and Adolphe, D., "Image Analysis Tools to Study Nonwovens", Textile Research Journal, 69 (2011) 162-168. |
| [21] | Pourdeyhimi, B., Dent, R., and Davis, H., "Measuring Fiber Orientation in Nonwovens, Part III: Fourier Transform", Textile Research Journal, 67 (2010) 143-151. |
| [22] | Pourdeyhimi, B., Dent, R., Jerbi, A., Tanaka, S. and Deshpande, A., Measuring Fiber Orientation in Nonwovens, Part V: Real Webs, Textile Research Journal, 67 (2011) 143-151. |