-
Paper Information
- Next Paper
- Previous Paper
- Paper Submission
-
Journal Information
- About This Journal
- Editorial Board
- Current Issue
- Archive
- Author Guidelines
- Contact Us
Frontiers in Science
p-ISSN: 2166-6083 e-ISSN: 2166-6113
2013; 3(1): 14-21
doi:10.5923/j.fs.20130301.03
Fiber Crimp Distribution in Nonwoven Structure
 Abstract
 Reference
 Full-Text PDF
 Full-text HTML
1Department of Textile Technology, Panipat Institute of Engineering & Technology, Harayana, India
2Department of Pharmaceutical Chemistry, CU Shah College of Pharmacy & Research, Gujarat, India
Correspondence to: Kunal Singha, Department of Textile Technology, Panipat Institute of Engineering & Technology, Harayana, India.
| Email: |  |
Copyright © 2012 Scientific & Academic Publishing. All Rights Reserved.
The crimp of the textile fibers is very critical to determine its properties and voluminisity. The microscopic characteristic of the nonwoven fabric is totally depends on the linearity and length of the crimp and the amplitude of the crimp. In this review paper we have discussed about the crimp calculation, measurement techniques and the standards used for the textile nonwoven substrates. The crimp frequency (orientation distribution function; ODF) which is being measured by Textechno FAVIMAT instrument and by modern image processing techniques is also been discussed here.
Keywords: Crimp, Voluminisity, Nonwoven Fabric, Crimp Calculation, Crimps Frequency, Orientation Distribution Function
Cite this paper: Kunal Singha, Mrinal Singha, Fiber Crimp Distribution in Nonwoven Structure, Frontiers in Science, Vol. 3 No. 1, 2013, pp. 14-21. doi: 10.5923/j.fs.20130301.03.
Article Outline
1. Introduction
- Crimp in a textile strand is defined as the undulations or succession of waves or curls in the strand, induced either naturally during fiber growth, mechanically, or chemically. Crimp in a fiber is thus considered as the degree of deviation from linearity of a non straight fiber. Fiber crimp is the waviness of a fiber expressed as waves or crimps per unit length (figure 1) or as the difference between the lengths of the straightened and crimped fiber (expressed as a percentage of the straightened length)[1-3]. Fiber crimp characteristics have a big influence on the processing performance of the fibers. Crimp also contributes essentially to the properties of intermediate fiber assemblies, yarn and finished fabrics. Fiber crimp imparted to synthetic fibers, which are initially straight, makes it possible to process these fibers with existing machinery designed for natural fibers. Straight, slick synthetic fibers would not have sufficient cohesion for carding, combing, drawing, roving, and spinning. In nonwoven processes, crimp and crimp retention during processing are major contributors to processing efficiency, cohesion, fabric bulk and bulk stability.
1.1. Wave Length, Crimp Frequency and Crimp Length
- The wave length λ of fiber crimp is twice the distance between two crossings of the fiber with the zero axis. It cannot be measured directly, since fiber crimp is by far too irregular and the small measuring quantities- wavelengths in the order of 1-3 mm - cause problems. Therefore, the crimp length lc, as the average length of fiber in one crimp, is sometimes used to describe crimp which can be measured as equation (1);
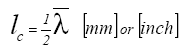 | (1) |
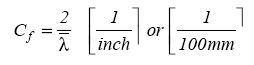 | (2) |
1.2. Crimp Angle
- The angle α between the leg of a crimp wave and the zero line may be used to characterize crimp geometry. The crimp angle φ is the angle between the two legs of a crimp bow, as shown in Figure 2; Φ indicates the sharpness of a crimp[2].
1.3. Crimp Amplitude and Crimp Index
- The crimp amplitude A is the maximum distance of a crimp bow from the zero axes. Since the measurement of the amplitude of single crimp bows is practically impossible, average crimp amplitude of the fiber is derived geometrically with Pythagoras from length measurements of the crimped and the uncrimped fiber. The crimp index Ci is an indirect measure of the crimp amplitude. It is also called crimp ratio, crimp percentage, crimp contraction or crimp retraction and is the ratio of the difference of extended length L0 and crimped length Lc of a fiber, in percent of the extended length of the fiber L0 as shown in by the equation (3). Ci describes the crimp potential of a textile fiber as its ability to contract under tension.
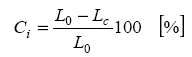 | (3) |
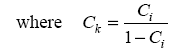 | (4) |
1.4. Crimp Width and Crimp Depth[1]
- These parameters were defined for the use in numerical image analysis of crimped fibers. The crimp width Cw is the distance between the midpoints of successive valleys of a crimp[4], as shown in Figure 3. The crimp depth Cd is the perpendicular distance between a peak of a crimp and a line joining the valleys of the adjacent crimp waves. Cw, Cd or Cw/Cd characterize the size of individual crimps (Figure 3). The mid points are determined by numerical regression of fitting curves. For an idealized triangular crimp bow, Cw corresponds to λ/2 and Cd corresponds to 2A[5,7].
1.5. Crimp Degree
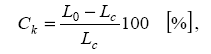
- The crimp degree Kg is defined as L0 / Lc, where L0 is the length of the straightened fiber and Lc is the length of the crimped fiber[9,12] .It is related to the crimp index by the equation (5);
 | (5) |
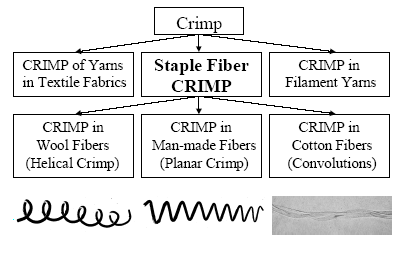 | Figure 1. Different types of crimp on textile substrates[1] |
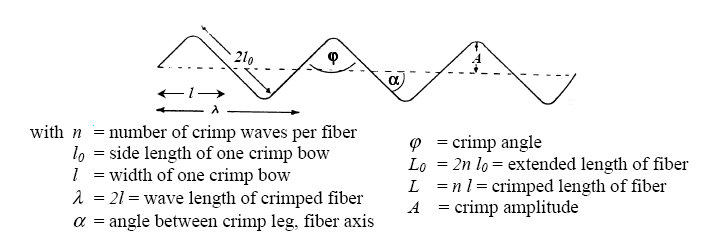 | Figure 2. Idealized geometry of the crimped fiber[2] |
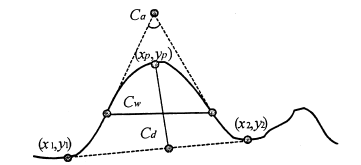 | Figure 3. Irregular crimp wave with crimp descriptors[4] |
1.6. Three-Dimensional Character of Crimp
- Crimp form of textile fibers is essentially three-dimensional in character because the two parameters, geometric curvature and torsion, accurately describe the space path of fiber crimp. Measurements needed for determination of these parameters are tedious and impractical to obtain by manual methods. An instrument built by DuPont makes these measurements automatically [11,14]. It differs from published instrumental techniques by providing data which allow definition of torsion and curvature of crimp as well as the more usual the fiber crimp frequency and extensibility parameters[8, 12-13]. A measurement of a series of fibers shows that fiber crimp, expected to be planar by virtue of mechanical crimping process, and has a three-dimensional character. A curved line in space can be defined by curvature and torsion at any point along the line. These two quantities as a function of arc length of are basis for development of crimp parameters. Statistics of curvature and torsion distribution along a fiber and among fibers are also important descriptive parameters of crimp. Geometric torsion should not be confused with mechanical or fiber torsion, commonly called twist. Curvature is by definition a mathematical expression, which is more easily visualized in a physical sense than is geometric torsion. The mathematical statement of these parameters can be shown as by the equation (6).
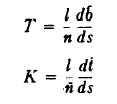 | (6) |
 which is in the direction of the radius of curvature, the tangent vector
  which is tangent to the curve at the point and orthogonal to the normal vectors and the binomial vectors
  which is orthogonal to the other two has been shown by this diagram. Curvature, K and torsion, T can be expressed in the x, y, z-co-ordinates system, so that data obtained by the automatic crimp-measuring instrument are used to calculate these parameters for any crimped fiber[13-15].
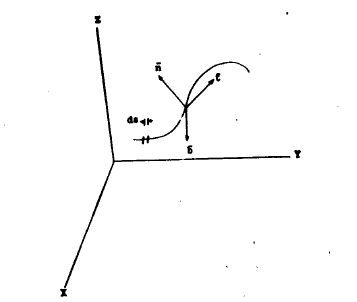 | Figure 4. Curve in three-dimensional space(x, y, z Cartesian co-ordinates) [15] |
2. Crimp Distribution
- The purpose of the study of fiber crimp distribution in nonwoven fabric is to quantify fiber mechanical behavior during de crimping and re-crimping, and relate it to fundamental fiber properties, nonwoven fabric properties, and process ability in nonwoven equipment by the study of crimp stability of fiber crimp in nonwoven fabrics. PET fibers of three different crimp levels have been carded and webs have been produced under various processing settings. Samples from different settings and processing stages are being tested for their single fiber crimp characteristics. An empirical function fitting the stress-strain curves of several single fibers in the crimp region has been found and may deliver parameters that characterize the crimp removal behavior of these fibers and their processing parameters. Synthetic fibers must be crimped to process on conventional carding equipment[16]. The initial crimp level and crimp retention during processing influence nonwoven fabric performance.
2.1. Effect of Crimp on Filtration Performance
- Use of crimped rather than uncrimped fibers improves both efficiency and drag characteristics. The reason for the reduced drag and higher efficiency with crimped fibers may be found that straight fibers seem to form groups of two or more where the fibers run close together for a considerable length[17]. The space between them becomes clogged with filtered particles, and the group then acts as a single, wide, flat fiber with a higher resistance to air flow. Efficiency decreases because of the larger spaces between these groups. None of these groups is visible in the case of crimped fibers, which maintain an open structure.
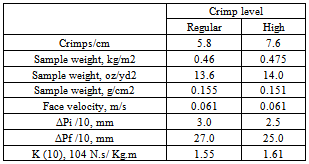
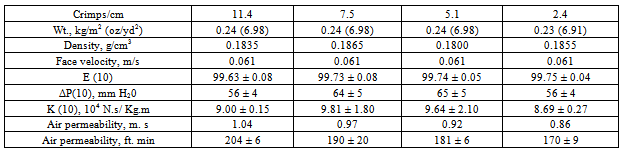
2.2. Crimp Frequency
- Experiments with fabrics made of crimped and uncrimped fibers showed that the crimped fabrics gave higher efficient lower pressure drop. This information is of limited value, since in practice uncrimped fibers are difficult to process and are therefore rarely used[15,18]. The extended study of the effects of crimp was therefore aimed at detecting any dependence on crimp level. It is done with two sets of fabrics. The first was made from three rayon fibers samples having crimp levels designated zero, normal (5.8 crimps/cm) and high (7.6crimps/cm). Micrographs of the three kinds of fiber are shown in Figure 5;
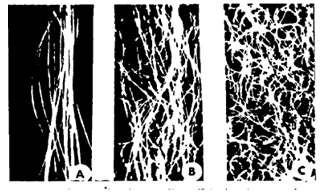 | Figure 5. Micrographs of rayon fibers (7.8X); A = no crimp, B = normal (5.8 crimps/cm), C = high crimp (7.6 crimps cm)[15] |
|
|
|
2.3. Fiber orientation
- The experiment were simulation and tracking scheme done by R. Dent to produce image for characterizing fiber orientation varying different parameters in nonwoven structure[22].
2.4. Incorporation of crimp
- Most real nonwovens have fibers or filaments with crimp or curl. For simplicity, we assume a sine wave to be sufficient for describing crimp. A sine wave is also convenient because it can be easily represented by its wavelength and amplitude. In defining crimp, we allow crimp percentage and period (wavelength) to be specified. The height (amplitude) is computed from these parameters[29-31].
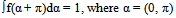
3. Orientation Distribution Function (ODF)
- The orientation distribution function (ODF) f(α) is a function of the angle α. The integral of the function f (α) from an angle a α1 to a α2 is equal to the probability that a fiber will have an orientation between the angles α1, and a2. The function f(α) must additionally satisfy the following conditions (7) and (8);
 | (7) |
 | (8) |
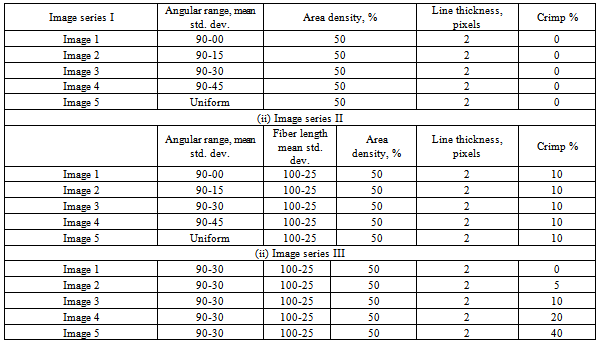
3.1. Simulation Results
- Some sample results are presented in Tables 4 show the structural features of the simulated images. Table 4. (i) displays image series I where the orientation anisotropy varies for a set composed of continuous lines with no crimp. They were generated using the μ-randomness procedure. All other parameters were kept constant for this series. Table 4 (ii) shows the image series II also vary in their orientation anisotropy. These are composed of discontinuous lines and incorporate 10% crimp[32]. They were generated using the I-randomness procedure. The third series was also generated using the I-randomness procedure and they vary only in their crimp percentage, shown in Table 4.
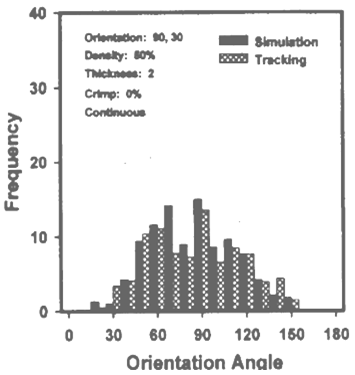
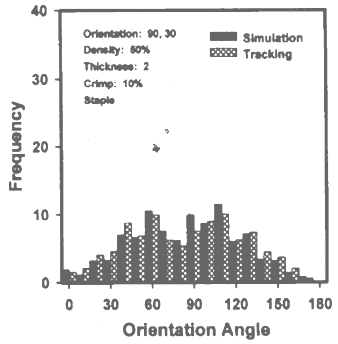
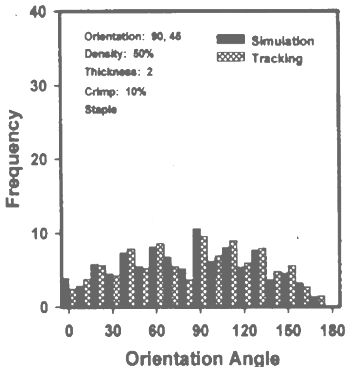
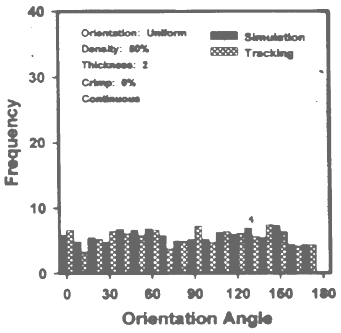
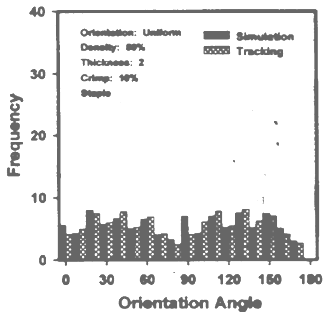
3.2. Frequency Distribution Curve
- In each series there were five images taken by the author varying their orientation angular range, and the different series were made varying their crimp level that is at zero crimp level (continuous) and particular crimp level (staple 10%) and different crimp level. Here we give three images of different orientation range of two distinct series that is at no crimp and at 10% crimp. From the curve we clearly see that keeping same parameters in both cases, only due varying their crimp level the shape of the curve changes, that is likely from unimodal to bimodal, the cause of this may be crimp effect[26-27].
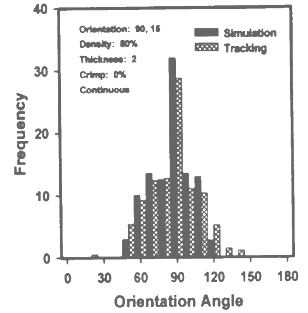 | Figure 6. ODF of Series I, image 2, at 0% crimp |
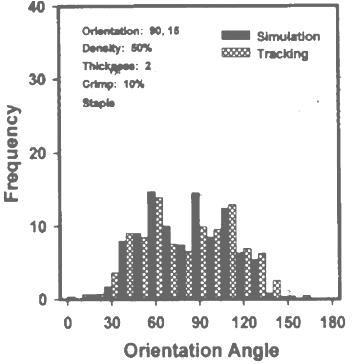 | Figure 7. ODF of Series II, image 2, at10% crimp[26] |
 | Figure 8. ODF of Series II, image 3, at 0% crimp |
 | Figure 9. ODF of Series III, image 3, at10% crimp[27] |
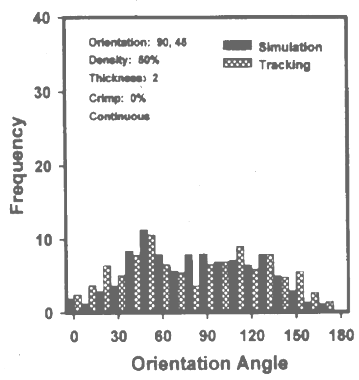 | Figure 10. ODF of Series I, image 4, at 0% crimp |
 | Figure 11. ODF of Series III, image 4, at 10% crimp[26] |
 | Figure 12. ODF of Series I, image 5, at 0% crimp |
 | Figure 13. ODF of Series II, image 5, at 10% crimp[27] |
4. Conclusions
- The influence of on single fiber crimp characteristics is being reviewed in this study. Stress-strain data in the crimp removal region are being collected with the Textechno FAVIMAT. Due to very high variability, a statistically reliable correlation between processing parameters and fiber crimp characteristics as determined with the Textechno software could not be established yet. Parameters characterizing the shape of the stress-strain curve in the crimp region rather than single points of the curve seen more suitable to describe fiber crimp characteristics and will hopefully reduce the variability[36]. A general function that fits the experimental stress-strain data in the crimp region of several different fibers has been found. The general validity of this model function is being investigated and the two shape parameters of the fitting curve are being evaluated quantitatively for various fibers. Based on this function and the previously introduced mechanical model for the crimp removal mechanism, a characteristic function for the torsional spring moment in the crimp node can be derived. In nonwoven, crimp and crimp retention of synthetic fibers during processing are, along with finish, major contributors to processing efficiency, web cohesion, fabric bulk and bulk stability[33-35]. The meaning of measurable crimp parameters and their influence on processing and fabric characteristics has not been quantified. Experimental stress-strain data from the Textechno FAVIMAT are being analyzed to determine appropriate parameters for the characterization of crimp and crimp stability and for the prediction of processing and fabric characteristics.
References
| [1] | Bauer-Kurz, Ina. “Fiber Crimp and Crimp Stability in Nonwoven Fabric”, www.thenonwovensinstitute.com |
| [2] | R.H. Brand and P. Kende, “Measurement of three – dimensional fiber crimp”, textile research journal 1970; 40; 169. |
| [3] | Textechno FAVIMAT, brochure, Moenchengladbach, Germany. |
| [4] | George E.R. Lamb, Peter A. Costanza, and Bernard Miller, “Influences of fiber geometry on the performance of nonwoven air filters1, textile research journal, June 1975, pg 452- 463. |
| [5] | George E.R. Lamb, Peter A. Costanza, “Influences of fiber geometry on the performance of nonwoven air filters, part-II, textile research journal, Feb. 1979, Pg 79-87. |
| [6] | B. Pourdeyhimi and R.Ramanathan, “Measuring fiber orientation in nonwoven, part-I”, textile research journal Nov 1996, 66, pg 713-722. |
| [7] | B. Pourdeyhimi and R.Ramanathan, “Measuring fiber orientation in nonwoven, part-II”, textile research journal Nov 1996, 66, pg 747-753. |
| [8] | Adanur, S., and Liao, T., Fiber Arrangement Characteristics and their Effects on Nonwovenn Tensile Behavior, Textile Res. J. 69(11), 816-824 (1999). |
| [9] | Baudonnel, J., Giroud, J. P., and Gourc, J. P. Experimental and Theoretical Study of Behavior of Non-woven Geotextiles, “Second International Conference on Geotextiles, Las Vegas”, 1984, pp. 823-828. |
| [10] | Cazzuffi, D., and Venezia, S., The Mechanical Properties of Geotextiles: Italian Standard and Interlaboratory Test Comparison, “Third International Conference on Geotextiles, Vienna”, 1986, pp. 695-700. |
| [11] | Chrysochoos, A., and Peyroux, R. , Analyse expérimentale et modélisation numérique des couplages thermomécaniques dans les matériaux solides, Rev. Gén. Therm. 37, 582-606 (1998). |
| [12] | Hearle, J. W. S., and Stevenson, P. J., Non Woven Fabric Study. Part III: The Anisotropy of Non Woven Fabrics, TextileRes. J. 33(11), 877-888 (1963). |
| [13] | Lemaître, J., and Chaboche, J.-L., “Mécanique des matériaux solides”, 2nd edn, Dunod, Paris, 1988. |
| [14] | Luong, M. P. ,Thermographie infrarouge appliquée à la mécanique des solides, in “Mécanique et géotextiles”, Ecole Polytech, Paris, 1998, pp. 115-129. |
| [15] | Marchio, D., and Reboux, P., “Introduction aux transferts thermiques”, Les Presses de l’Ecole des mines, Paris, 2003. |
| [16] | Myles, B., and Carswell, I. G., Tensile Testing of Geotextiles, “Third International Conference on Geotextiles, Vienna”, 1986, pp. 713-718. |
| [17] | Offermann, S., Bissieux, C., and Beaudoin, J. L., Statistical Treatment to Infrared Thermoelastic Analysis of Applied and Residual Mechanical Stresses, Rev. Gén. Therm. 37, 718-724 (1998). |
| [18] | Poudeyhimi, B., Ramanathan, R., and Dent, R., Measuring Fiber Orientation in Non Wovens, Part I: Simulation, Textile Res. J. 66(11), 713-722 (1996). |
| [19] | Poudeyhimi, B., Ramanathan, R., and Dent, R., Measuring Fiber Orientation in Non Wovens, Part V: Real Webs, Textile Res. J. 69(3), 185-192 (1999). |
| [20] | Rowe, R. K., and Ho, S. K., Determination of Geotextile Stress-Strain Characteristics using a Wide Strip Test, “Third Villard, P., and Giraud, H., Three Dimensional Modeling of the Behavior of Geotextiles Sheets as Membranes, Textile Res. J. 68(11), 797-806 (1998). |
| [21] | Wayne, M. H. Montalvo, J. R., and Boatwright, M., Relationship between Wide-width Strip Tensile and Modified Strip Tensile Tests when Testing Nonwoven Geotextiles. “Geosynthetics’ 93. Vancouver”, 1993, pp. 571-577. |
| [22] | Zhao, Y., “Visualisation du champ de déformation de surfaces textiles. Mise au point et utilisation d’un logiciel d’analyse d’image”, Thèse Ecole Centrale de Paris, 1991.International Conference on Geotextiles, Vienna”, 1986, pp. 885-890. |
| [23] | Thorr, F., Adolphe, D. C., and Drean, J. Y., Study of Non Woven Mass Reorganization under Tensile Stress Thanks to a New Sensor and Image Analysis, Sensors Actuators A 62, 565-570 (1997). |
| [24] | Thorr, F., “Contribution à l’étude de l’évolution de la structure de non-tissés sous sollicitation uniaxiale”, Thèse Université de Haute Alsace, 1997. Stress-strain Response of Fabrics Under Two-dimensional Loading, Textile Res. J. 37, 948-975 (1967). |
| [25] | Sidhu, R. M. J. S., Averill, R. C., Riaz, M., and Pourboghart, F., Finite Element Analysis of Textile Composite Preform Stamping, J. Compos. Struct. 52, 483-497 (2001). |
| [26] | 5. Boise, P., Gasser, A., and Hivet, G., Analysis of Fabric Tensile Behaviour: Determination of the Biaxial Tension-strain Surfaces and their Use in Forming Simulations, Composites Part A 32, 1395-1414 (2001). |
| [27] | Farboodmanesh, S., Chen, J., Mead, J. L., and White, K., “Effect of Construction on Mechanical Behavior of Fabric Reinforced Rubber,” Rubber Division Meeting, American Chemical Society, Pittsburgh, PA, USA (2002). |
| [28] | Steeves, E. C., “Mathematical Modeling of the Biaxial Stressstrain Behavior of Fabrics,” Technical Report 82-009, United States Army Natick Research and Development Laboratories, Natick, MA, USA (1982). |
| [29] | Main, J. A., Peterson, S. W., and Strauss, A. M., Load-deflection Behavior Of Space-based Inflatable Fabric Beams, J. Aerosp. Eng. 7(2), 225-238 (1994). |
| [30] | Main, J. A., Peterson, S. W., and Strauss, A. M., Beam-type Bending of Space-based Inflated Membrane Structures, J. Aerosp. Eng. (8)2, 120-125 (1995). |
| [31] | Sagar, T. V., Potluri, P., and Hearle, J. W. S., Meso-scale Modeling of Interlaced Fibre Assemblies Using Energy Method, Comput. Mater. Sci. 28, 49-62 (2003). |
| [32] | King, M., and Socrate, S., “A Shell Formulation to Model the Three-dimensional Deformation Response of Woven Fabrics,” ASME International Mechanical Engineering Congress and Exposition, Anaheim, CA, USA (2004). |
| [33] | Cavallaro, P., Sadegh, A., and Johnson, M., Mechanics of Plain-woven Fabrics for Inflated Structures, J. Compos. Struct. 61(4), 375-393 (2003). |
| [34] | Quigley, C., Cavallaro, P., Johnson, A., and Sadegh, A., “Advances in Fabric and Structural Analyses of Pressure Inflated Structures,” Conference Proceedings of the 2003 ASME International Mechanical Engineering Congress and Exposition (2003). |
| [35] | ABAQUS Version 6.4, ABAQUS Inc., Pawtucket, RI, USA (2003). |
| [36] | Cavallaro, P., Sadegh, A., and Quigley, C., “Combined Inplane Shear and Multi-axial Tension or Compression Testing Apparatus,” U.S. Patent No. 6,860,156 (2005). |