-
Paper Information
- Next Paper
- Previous Paper
- Paper Submission
-
Journal Information
- About This Journal
- Editorial Board
- Current Issue
- Archive
- Author Guidelines
- Contact Us
Frontiers in Science
p-ISSN: 2166-6083 e-ISSN: 2166-6113
2012; 2(6): 226-234
doi: 10.5923/j.fs.20120206.16
Structure-Property Relationships of Needle-Punched Nonwoven Fabric
 Abstract
 Reference
 Full-Text PDF
 Full-Text HTML
Subhankar Maity, Kunal Singha
Department of Textile Technology, Panipat Institute of Engineering & Technology, Panipat, 70 Milesstone, G. T. Road, Harayana, Pin- 132102, India
Correspondence to: Subhankar Maity, Department of Textile Technology, Panipat Institute of Engineering & Technology, Panipat, 70 Milesstone, G. T. Road, Harayana, Pin- 132102, India.
| Email: |  |
Copyright © 2012 Scientific & Academic Publishing. All Rights Reserved.
Needle-punched nonwoven fabrics are manufactured with suitable structures to develop specific property to serves specific application. This paper reviews the influence of structural parameters such as fiber orientations, packing density, specific surface area, thickness etc. on various mechanical and functional properties of nonwoven fabrics.
Keywords: Needle-Punched, Specific Property, Structural Parameters, Functional Properties
Cite this paper: Subhankar Maity, Kunal Singha, "Structure-Property Relationships of Needle-Punched Nonwoven Fabric", Frontiers in Science, Vol. 2 No. 6, 2012, pp. 226-234. doi: 10.5923/j.fs.20120206.16.
Article Outline
1. Introduction
- The high rate of growth in nonwovens has led to a substantial increase in research aimed at establishing links between structure and desired properties of nonwovens. Needle-punched nonwoven materials with the required combination of functional properties are widely used in numerous technical applications, including, filters, composites, protective clothing, packaging, geo-textiles, home furnishings, heat and noise insulating, etc. As the properties of nonwovens depend on the structure of the material, a structure-property relationship will provide a tool to manipulate the nonwoven structure to achieve satisfactory product performance by both establishing appropriate manufacturing parameters and selecting proper fiber specifications. This requires quantification of the degree of bonding among the fibres and the establishment of relationships between the process parameters corresponding fabric properties.Let at first discuss about the structural parameters of needle-punch nonwoven structure. A fiber segment can be considered for better understanding the characteristic behavior of nonwoven structure. Fiber segments are considered as fiber sections between any two crossover points and which can be treated as minimal units in a web. Owing to fiber bonds or surface contacts at crossover points, even the segments on the same fiber may differ significantly in their mechanical performance. The influence of a fiber segment on the stress-strain property of the fabric depends mainly on its structural characteristics: length, thickness, curl, and orientation. A thin nonwoven fabric can be treated as a two dimensional fiber network in which fibers (staple or filament) lie in various directions and are bonded or in contact with one another at fiber crossover points. Here fiber-to-fiber bonds maintain fabric integrity[1]. Length distribution of fiber segments is useful information for assessing the compactness and other properties of a web. Short segments are often accompanied by a compact web structure. More the open structure more will be segment length[1]. Fiber or fiber bundle thickness has a direct influence on web mechanical properties. It is desirable to know fiber thickness distribution in a web where fibers have different diameters or fiber bundles are commonly present. In addition, thickness is often used as a weighting factor in analyzing fiber orientation distribution[2]. Segment curl is another important structural parameter. Curl of a fiber segment refers to its degree of curvature, which is a primary factor influencing the initial modulus of a nonwoven fabric. Hearle and Stevenson defined a fiber curl factor as the ratio of the length of a fiber segment that spans two selected points on the segment to the shortest distance between these two points[3]. Segment orientation of fiber orientation is the most important structural parameter which governs ultimate functional properties of nonwoven structure. An uneven distribution in fiber orientation results in anisotropic behaviours in mechanical properties[1].
2. Mechanical Property & Structure Relationship
- Anisotropy[4] is important to the structure and application of nonwoven fabrics. The arrangement of the fibers and their orientation distribution are related to the mechanical structure of the web. Nonwoven fabrics are defined as web structures made by bonding or interlocking fibers or filaments using mechanical, thermal, chemical, or solvent methods. The failures of nonwoven fabrics can include bond failure, fiber rupture, and fibre slippage[5]. Generally, fibers in the web are oriented in various directions following a random or known statistical distribution.The mechanical properties of nonwoven fabrics depend on raw materials, fiber fineness, fiber length, fiber arrangement, and structural differences resulting from different manufacturing processes[6-7]. Thus, test has been conducted to see the effect of such fiber arrangements on the tensile strength, tearing strength, and bursting strength of the nonwoven fabrics.
2.1. Influence of Fiber Arrangement on Tensile Strength
- Fiber orientation has a big influence on the tensile strength of the nonwoven material. Because the fibers were arranged along the machine direction (vertical direction) by the conventional method of manufacturing nonwoven fabrics, tensile strength was best in the vertical direction. The tensile strength of the parallel web or random web decreased with increasing angle of cut of the specimen for strength measurement. Elongation was higher in the horizontal direction or cross direction.It was also reported that the coefficient of variation of the parallel web was below 10% for tensile strength. Due to uneven thickness, the variation coefficient of the random webs was above 10%; with the random arrangement, there were more fibers in the horizontal direction than in the vertical direction. The tensile strength of the horizontal direction increased, but that of the vertical direction decreased[2].
2.2. Influence of Fiber Arrangement on Tearing Strength
- A study was conducted for accessing the tearing strength of the nonwoven material and the influence of fiber arrangement on it also reported[2]. It was reported that both for parallel and random webs the tearing strength in horizontal direction is more than that of the vertical direction for both the method.
2.3. Influence of Fiber Arrangement on Bursting Strength
- The bursting strength in the random webs was lower than that in the parallel webs. One possible explanation could be that the fiber arrangement in the random webs was anisotropic, so there were more interlacing spots and voids in these webs. The failure extended from these voids to the perimeter under breaking conditions. The bursting strength in the parallel webs was better[2].
2.4. Air Permeability& Structure Relationship
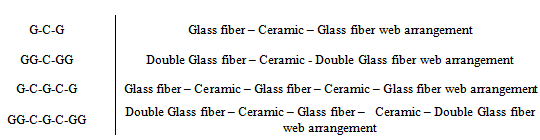
- Permeability[8] affects criteria such as sound absorption, filtration, and thermal properties. The pressure gradient through a bed of porous material is a function of fluid viscosity, fluid and material densities, rate of fluid flow, and material porosity. When considering the flow through porous materials, the shape, arrangement, and size distribution of voids through which flow must occur are extremely important. In fact, there is no simple correlation between permeability and porosity because of the strong dependence of flow rate on the width, shape, and tortuosity of the conducting channels[9-10]. Tortuosity, the ratio of effective channel length and sample thickness, is an important factor in determining flow through nonwoven materials[11-12].The researchers had been determined and discussed the experimental and theoretical air permeability of multilayer, glass/ceramic nonwoven samples. The Frazier permeability tester was used for experimental measurements. Theoretical permeability was determined using a modified Kozeny equation[8] along with weighted averages for fiber diameter and density. The fabric structure was varied by changing the number of glass and ceramic webs, and by varying the number of needle barbs used in needle punching the samples.
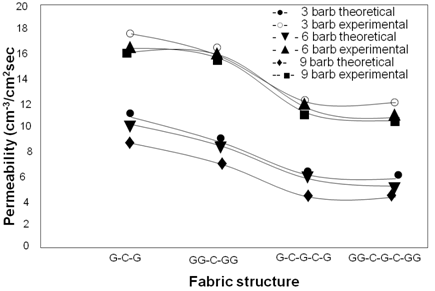 | Figure 1. Comparison of experimental and Theoretical permeability[8] |
- As shown in figure 1, the theoretical permeability was lower than the experimental permeability in all cases. According to the author this difference in permeability is mainly associated with the non random distribution of fibers, and this lack of randomness is due to two factors. First, needled nonwovens have areas that have not been needled and where the fibers are still randomly oriented. However, the areas where the needle penetrates the fibers are not considered to be randomly distributed. In these areas, a channel may be formed that reduces tortuosity, thus increasing permeability.A second factor causing the difference in experimental and theoretical permeability is the non-uniform weight/thickness ratio of the experimental fabric, which is due to the non-uniformity of the ceramic web. Produced by melt blowing, the ceramic web has thick and thin spots throughout. The thin spots are open places that allow more airflow. It is believed that non-uniformity in the ceramic web is the major factor that causes the experimental permeability to be higher than the theoretical permeability.
3. Thermal Conductivity & Structure Relationship
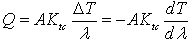
- One of the[13] major applications for nonwoven fibrous systems is as thermal insulation materials. Because of savings in both space and weight, low-density insulating nonwoven materials are being used in consumer appliances, homes, and automobiles, in aircraft, and in industrial process equipment. Heat flux passing through a participating medium may in general be represented by several mechanisms: free and forced convection, conduction through solid fibers, and conduction through air in the inter fiber spaces, and radiation[14]. Thermal conductivity is one mode of heat transfer in which an energy exchange takes place from the higher temperature to lower temperature. Based on the Fourier[15] heat transfer equation,
 | (1) |
 | (2) |
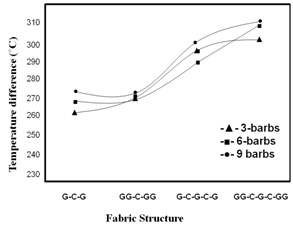 | Figure 2. Effect of fabric structure on temperature difference at an applied temperature of 400°C[13] |
3.1. Effect of Fabric Structure on Coefficient of Thermal Conductivity
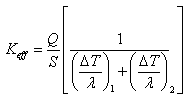
- The effect of the number of barbs and the fiber content on the effective thermal conductivity (Keff) has been discussed following. All discussion is based on sample behavior at steady state. Keff is determined from equation and is a function of flow rate, ΔT and thickness. Effect of number of barbs
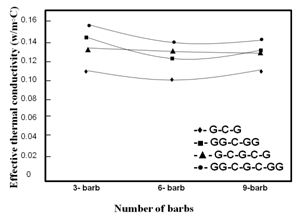 | Figure 3. Effect of no. of barbs on effective thermal conductivity[13] |
4. Moisture Diffusivity and Structure Relationship
- Fiber volume fraction and shape coefficient are the most important structural parameters affecting water vapor diffusivity through non hydrophilic nonwoven fabrics. Water vapor diffusivity decreases with increasing fiber volume fraction and decreases as the flatness of the fiber cross section increases[20].
4.1. Effects of Fiber Volume Fraction
- Fiber volume fraction is playing a strong role in controlling moisture diffusion through fibrous structures[20]. Figure 4 shows that for melt blown nonwovens, water vapor diffusivity decreases with increasing fiber volume fraction. But in many cases, moisture vapor transmission cannot be adequately explained solely on the basis of fiber volume fraction. This is because of the complex interactions between fiber volume fraction and other parameters including fiber shape coefficient and the kind of fiber used in the nonwoven construction. The differences between semi-permeable, permeable, and highly permeable nonwoven barrier fabrics are illustrated in Figure 5.
4.2. Effects of Shape Coefficient
- Beside fiber volume fraction, fiber shape factor is key parameter controlling moisture permeability of nonwoven fabric. It was reported that water vapor diffusivity is inversely proportional to the fiber shape coefficient. This means that flat fibers provide more cover than round or trilobal fibers. Higher fiber cover reduces moisture penetration[20].
4.3. Effects of Fabric Thickness and Fiber Diameter
- Fabric thickness and fiber fineness affect water vapor diffusivity because these variables control optical porosity. The finer the component fibers, the more will be the filament separation and the higher the cover factor. Thicker fabrics also have lower optical porosities as is shown in figure 6. This paper[20] shows, however, that the effects of fabric thickness and fiber fineness on total water vapor diffusivity are small. Figure 7 shows the relationship between water vapor diffusivity and fiber fineness. Unfortunately, because of the interaction with fiber volume fraction, this comparison does not give enough information about the effects of fiber fineness. However, this comparison shows that there is little difference in the water vapor diffusivity of nonwoven samples made with 2.5 μm fibers ( M 1 ~ M9) and melt blown samples containing fibers in the 10 μm range (M 10 ~ M 18 ).
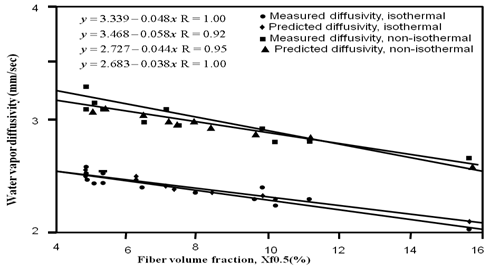 | Figure 4. Relationships between water vapor diffusivity and fiber volume fraction of melt blown webs[20] |
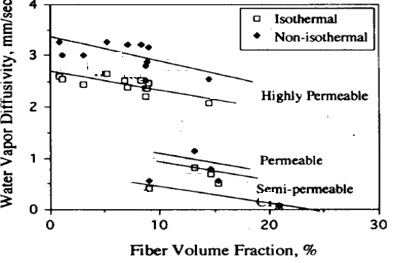 | Figure 5. Relationships between water vapor diffusivity and fiber volume fraction of barrier nonwovens[20] |
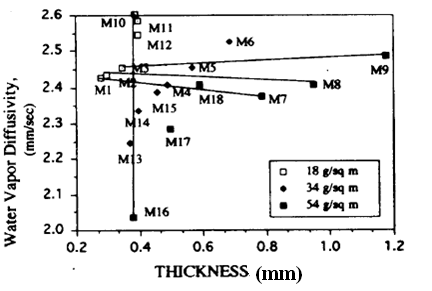 | Figure 6. Relationship between fabric thickness and water vapor diffusivity[20] |
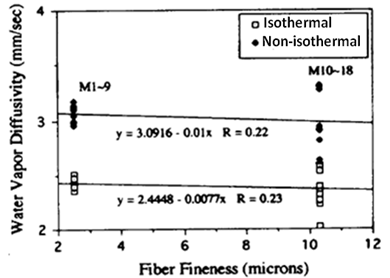 | Figure 7. Relationship between water vapor diffusivity and fiber fineness[20] |
5. Acoustical Behavior and Structural Relationship
- Nonwoven fabrics[21] are ideal materials for use as acoustical insulation products because they have high total surface. The surface area of the fabric is directly related to the denier and cross sectional shape of the fibers in the fabric. Smaller deniers yield more fibers per unit weight of the material, higher total fiber surface area and greater possibilities for a sound wave to interact with the fibers in the structure. Another important parameter is the packing density of the fibers in the nonwoven material. More fibers per unit volume at the same fabric thickness yield greater possibilities for sound waves to interact with the fibers.To obtain an indication of the effect of fiber shape on acoustical properties, needle punched nonwoven fabrics made from 3 and 15 den polyester round fibers, 15 den polyester trilobal fibers, and 3 and 15 den polyester expanded surface area fibers (4DG) with comparable thicknesses and densities were selected. To obtain an indication of the effect of fiber denier on acoustical properties, fabrics made from 3 and 15 den polyester rounds, 15 den polyester trilobal, and 3 and 15 den polyester 4DG fibers with comparable thicknesses and densities were selected.As shown in Figure 8, needlepunched nonwoven test materials made from 3 den round fibers were better sound insulators than test materials made from 15 den round polyester fibers. Results showed that the difference in transmitted sound between test materials made from 3 den round polyester fibers and 15 den round polyester fibers did not change with density for each fabric density level. Sound insulation of nonwoven test material made from 3 denier round fibers was much better than the sound insulation of nonwoven test material made from 15 den round fibers. The results for trilobal and 4DG shapes showed the same trend with round shape fiber, as shown in Figure 9. The acoustical insulation comparison for the nonwoven test materials made from 15 den round-, trilobal- and 4DG shaped fibers was used to study the effect of expanded surface area. As shown in Figure 9, the needlepunched nonwoven fabrics made from 4DG and trilobal fibers had better sound insulation results than nonwoven fabrics made from round fibers. The reason for this result may be because of the effect of surface area in the fabric. 4DG fibers had approximately three times more surface area than round fibers. Higher surface area in the nonwoven fabric increased the possibility of the sound wave interaction with the fibers and resulted in more effective sound deadening in the nonwoven fabric. From the results shown in Figures 8 and 9, it could be concluded that surface area affected sound insulation properties of nonwoven fabrics positively.To obtain an indication of the effect of fabric density on acoustical properties, nonwoven fabrics with comparable densities at the same thicknesses and weights were selected.An acoustical insulation comparison for all fibers at five fabric density levels is shown in Figure 10. At a fabric density level of approximately 1.18 g/cm3, fibers were mostly crushed and there was no difference in the acoustical behavior of the test materials. The material was no longer a needlepunched nonwoven fabric; it was more like a polyester sheet film. The surface was very smooth and, therefore, most of the sound wave was reflected instead of moving into the material. This property resulted in sound transmitted values that were much lower for the polyester sheet film than nonwoven fabrics. Increasing sound reflection rather than increasing sound absorption is not an effective way to insulate the sound because there will be noise pollution on the environment with increasing reflection value of the sound wave.As indicated in Figure 10, needlepunched nonwoven fabrics with higher densities yielded better sound insulation properties than nonwoven fabrics at lower densities. Therefore, we concluded that fabric density affected the sound insulation property of the nonwoven fabrics positively. The effect of fabric density on the transmitted sound data for needlepunched nonwoven fabrics made from different deniers and different shapes was consistent with the results, as shown in Figure 10.
 | Figure 8. Transmitted sound results for needlepunchd nonwoven fabrics made from 3 and 15 denier fibres with 0.16 g/cc density[21] |
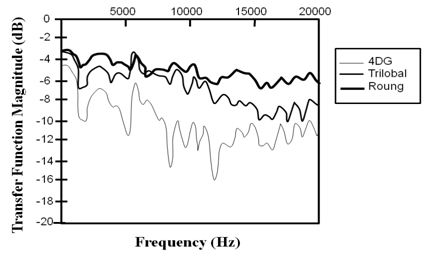 | Figure 9. Transmitted sound results for needlepunchd nonwoven fabrics made from15 denier 4DG, trilobal and round fibres with 0.27 g/cc density[21] |
 | Figure 10. Transmitted sound results for needlepunchd nonwoven fabrics made from 3 denier 4DG fibres with various densities 0.09g/cc, 0.16 g/cc, 0.27 g/cc, 0.44 g/cc and 1.18 g/cc[21] |
6. Conclusions
- The tensile strength of the parallel web or random web decreases with increasing angle of cut direction of the specimen. Elongation is irregular and best in the horizontal direction or cross direction. Both for parallel and random webs tearing strength of horizontal direction are more than that of the vertical direction for both the method. The bursting strength in the parallel webs is better than that of the cross web. When tortuosity reduces air permeability increases. As the number of barbs in needleunched nonwoven increases from three to six, Keff decreases, but when the number of barbs increases further from six to nine, Keff increases slightly. Water vapor diffusivity decreases with increasing fiber volume fraction and decreases as the flatness of the fiber cross section increases. Smaller deniers yield more fibers per unit weight of the material, higher total fiber surface area and greater possibilities for a sound wave to interact with the fibers in the structure. More fibers per unit volume at the same fabric thickness yield greater possibilities for sound waves to interact with the fibers. needlepunched nonwoven fabrics with higher densities yield better sound insulation properties than nonwoven fabrics at lower densities.
Abbreviations