-
Paper Information
- Next Paper
- Previous Paper
- Paper Submission
-
Journal Information
- About This Journal
- Editorial Board
- Current Issue
- Archive
- Author Guidelines
- Contact Us
Frontiers in Science
p-ISSN: 2166-6083 e-ISSN: 2166-6113
2012; 2(5): 101-118
doi: 10.5923/j.fs.20120205.03
Assessment of the Nutritional Status of Beef and Low-Fat Beef Burger
 Abstract
 Reference
 Full-Text PDF
 Full-Text HTML
Mohamed K. E. Youssef 1, Badway. M. D. Mostafa 2, Magda A. A. Seliem 1, Alyaa M. A. Hashem 2
1Food Science and Technology Department, Faculty of Agriculture, Assiut University, Assiut, 71526, Egypt
2Food Technology Research Institute, Agricultural Research Center, Giza, 12619, Egypt
Correspondence to: Alyaa M. A. Hashem , Food Technology Research Institute, Agricultural Research Center, Giza, 12619, Egypt.
| Email: |  |
Copyright © 2012 Scientific & Academic Publishing. All Rights Reserved.
Four fat replacers (carrageenan, carboxymethyl cellulose, soy flour and goat (Chevon) meat were added at three levels (0.3, 0.5 and 1%), (1.5, 3 and 4.5%), (5, 10 and 15%) and (25, 50 and 100%) to prepared low-fat beef burger. Chemical, caloric values, thiobarbutric acid, total volatile basic nitrogen, and nitrogen compounds (total soluble nitrogen, soluble protein nitrogen and non protein nitrogen were evaluated. The data revealed that raw and grilled beef burger formulated with fat replacers were higher in moisture, protein, ash and carbohydrate and lower in fat than control. Protein was decreased but ash and carbohydrate were increased as fat replacers increased. After grilling moisture, protein and fat were decreased but ash and carbohydrate were increased. Caloric values were decreased by grilling than ungrilled beef burger. Samples containing soy flour at different ratios in raw or grilled state had the lower thiobarbituric acid values. Carrageenan, carboxymethyl cellulose and soy flour reduced the level of total volatile basic nitrogen. Furthermore, the highest total soluble nitrogen was found beef burger containing different soy flour ratios. Extending storage time of high and low-fat beef burgers as influenced by different fat replacers to 3 months at -20℃ reduced moisture, protein and nitrogen compounds but increased ash, fat, carbohydrate, thiobarbituric acid values and total volatile basic nitrogen. The aim of this study was carried out in an attempt to clarify the effect of adding fat replacers on the nutrition status of low-fat beef burger.
Keywords: Beef Burger, Fat Replacers, Carrageenan, Carboxy Methyl Cellulose, Soy Flour, Goat Meat
Cite this paper: Mohamed K. E. Youssef , Badway. M. D. Mostafa , Magda A. A. Seliem , Alyaa M. A. Hashem , "Assessment of the Nutritional Status of Beef and Low-Fat Beef Burger", Frontiers in Science, Vol. 2 No. 5, 2012, pp. 101-118. doi: 10.5923/j.fs.20120205.03.
Article Outline
1. Introduction
- In recent years, health concerns about fat consumption and change in consumer's preferences had led to extensive research on low- fat foods[1].High animal fat diets are associated with several types of obesity, hypertension, cardiovascular diseases and coronary heart diseases. There is evidence that fat-rich diets, as well as causing obesity, are also directly related to the risk of colon cancer. Fat and cholesterol are also associated with cardiovascular diseases. In light of these implications, various international institutions, among them the World Health Organization (WHO), have drawn up the following nutritional recommendations: fat should provide between 15% and 30% of the calories in the diet; saturated fat should provide not more than 10% of these calories, and cholesterol intake should be limited to 300 mg/day[2].Reduction or removal of fat from meat products requires fat replacers and various ingredients e.g. flavoring and seasoning that can provide mouth feel, texture and flavor of fat in the finished products. One of the most interesting hydrocolloids gums, which could be used in meat industries, is carrageenan. Carrageenans are sulphated polysaccharides extracted from seaweed. It is widely used in food industry for a broad range of applications because of its water binding, thickening and gelling properties[3]. Carboxymethyl cellulose is widely used because it is tasteless, odorless, acts as moisture binder, emulsion stabilizer, thickener and improves the texture of a wide range of food products. Because it is physiologically inert and non caloric, cellulose gum is particularly useful in dietetic Foods[4].Soy protein is one of the most widely used vegetable proteins in meat industry due to its various technological benefits, whereas it plays a significant role in the modification of the functional characteristics of the meat products[5]. There are other meats characterized with lower fat content than beef suggested for production of low fat meat products such as (chevon) goat meat[6]. Chevon has 10 and 19% more carcass leanness than beef and lamb, respectively. The fat content is lower by 47 and 54% than beef and mutton, respectively[7]. This investigation was carried out in an attempt to clarify the effect of adding fat replacers on the nutrition status and caloric value of low-fat beef burger.
2. Materials and Methods
2.1. Materials
2.1.1. Meat
- 40 kg of fresh lean beef (top round) muscle from old cow (3 years old) were obtained from Assiut slaughter house during March 2010. Visible fat and connective tissue were eliminated manually[8]. The lean beef samples were minced using meat mincer and was used for processing of low-fat beef burger.
2.1.2. Goat Meat (Chevon)
- 6.0 kg of fresh meat of goat was obtained from healthy 1-yr-old goat (leg and shoulder cuts) purchased from Assiut local market during March 2010. The goat meat samples were minced using meat mincer and used for processing of low fat-beef burger.
2.1.3. Fat replacers
2.1.3.1. Carrageenan
- 72g of GENUVISCO carrageenan type CSM-2 was obtained from Technogen Company at Dokii, Cairo, Egypt during March, 2010. It is a hydrocolloid consisting mainly of calcium, magnesium, potassium, and sodium sulphate ester of glactose and 3,6 anhydrogalactose co-polymers. It is soluble in cold water exhibiting a viscosity effect almost instantaneously after dispersion. The suspension was prepared by stirring 0.3, 0.5 and 1.0g of carrageenan in 100 ml iced water, then it was added to meat[9].
2.1.3.2. Low-Fat Soy Flour
- 1200g of soy flour was purchased from the Food Technology Institute Agriculture Research Center- Giza, Egypt during March 2010. Powdered soy flour was rehydrated (by mixing one part of powdered soy flour with two parts of tap water) before addition to the meat[10].
2.1.3.3. Carboxymethyl Cellulose Sodium Salt (CMC)
- 360 g of carboxmethyl cellulose (CMC) product No: 0385 was purchased from EL- Badry company at Assuit, Egypt during March, 2010. The suspensions were prepared by stirring 1.5, 3.0, 4.5 gm of CMC in 100 ml iced water, then it added to meat[11].
2.1.4. Spices
- Spices mixture was prepared using equal weights of clove, black pepper, Chinese cubeb, paprika and nutmeg that were obtained from the local market during March 2010.
2.1.5. Salt, onion, garlic and parsely
- Salt, fresh onion, garlic and parsley were obtained from the local market and used for preparation of beef burger during March, 2010.
2.2. Methods
2.2.1. preparation of Beef Burger Samples
- The burger formulae were formed using a patty marker (stainless steel model "Form") to obtain round discs 10 cm diameter and 0.5 cm thickness. After preparation of each formulae, the beef burger samples (each sample was 50 g) were packed in polyethelene bags and were stored immediately in a deep freezer at -20˚C for up to three months where samples were required at zero time 1, 2 and 3 months for analyses before and after cooking. Basal beef burger formula included 85.75% minced beef, 1% salt, 0.5% onion, 0.25% garlic, 0.25% parsley, 0.25% mixed spices and 12 ml iced water[9]. The suspensions of carrageenan (0.3, 0.5, 1%), carboxymethyl cellulose (1.5, 3, 4.5%), rehydrated soy flour (5, 10, 15%), and minced goat meat (25, 50, 100%) at different ratios were added to basal formula to prepare different low-fat beef burger treatments.
2.2.2. Cooking of Beef Burger
- The beef burger studied samples were cooked using an electrical grill (Arcelik Mini Firin, Turkey) at 300℃ (the distance between heat source and the sample was 4 cm) for a total of 10 min, 6 min one side and 4 min in the other side[12].
2.2.3. Chemical analysis
2.2.3.1. Moisture, crude protein, ash and crude fat contents
- They were determined according to Official Methods[13].
2.2.3.2. Carbohydrate contents
- Carbohydrates were calculated by difference[12] by follows:% carbohydrate = 100 – (% moisture + % protein + % ash + % fat)
2.2.3.3. Caloric value
- Caloric value was estimated as follows:Caloric value (k. cal/100 gm) = (% carbohydrate x 4) + (% protein x 4) + (% fat x 9)[14].
2.2.3.4. Thiobarbituric acid value (TBA)
- Thiobarbituric acid (TBA) values were determined in raw and grilled beef burgers samples at 0, 1, 2 and 3 months of storage at -18˚C. according to the method of[15].
2.2.3.5. Total volatile basic nitrogen (T.V.B.N)
- Total volatile nitrogen was determined in raw and grilled beef burgers samples according to the method described by[16].
2.2.3.6. Determination of nitrogen compounds
- Total soluble nitrogen and soluble protein nitrogen were determined in raw beef burger samples according to themethod described by[17].According to[18] non protein nitrogen was calculated using the following equation: NPN= T.S.N-S.P.N
2.2.4. Statistical analysis
- The data obtained from three replicates were analyzed by ANOVA using the SPSS statistical package program, and differences among the means were compared using the Duncan's Multiple Range test[19]. A significance level of 0.05 was chosen.
3. Results and Discussion
3.1. Moisture
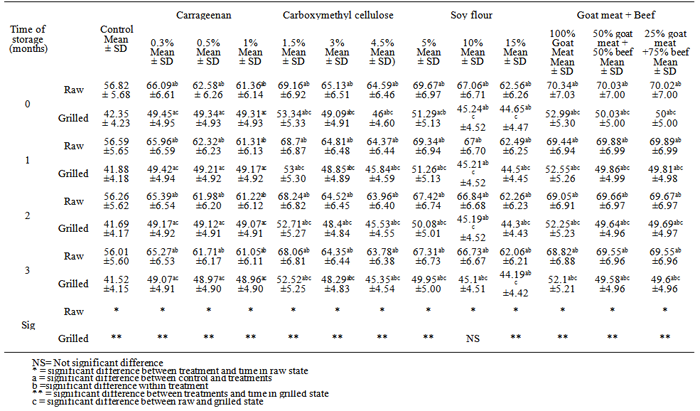
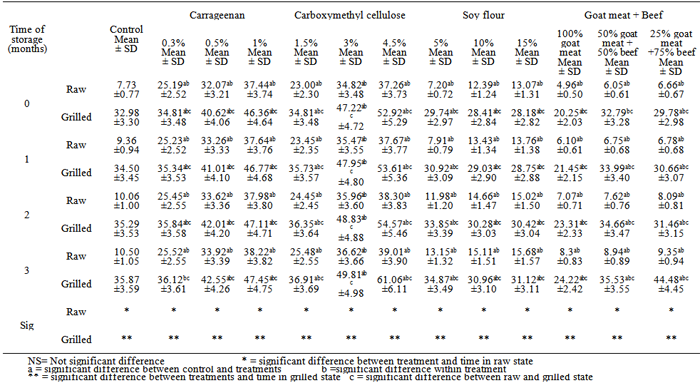
- From the tabulated data presented in Table (1) it could be noticed that moisture content of all samples containing fat replacers: carrageenan, carboxymethyl cellulose and soy flour and samples containing goat meat + beef at different ratios as additives ingredients had higher moisture content with a significant difference than that of control sample (without any fat replacers) at zero time and at any time of frozen storage as it was, 56.82%. Such findings coincide with[20] who reported that high-fat patties had lower moisture content than low-fat treatments. High fat control had significantly lower moisture content (59.59%) than that of any other frankfurter groups (P < 0.05)[21].[12]found that the lowest moisture content were determined for control beef burger as 59.43%, the lowest moisture content of control beef burgers were due to the adjustment of fat to 20%. Similar results were obtained by[22];[23] and[24].Moreover, the samples containing goat meat + beef had the highest moisture content with a significant difference than that of all samples containing fat replacers (carrageenan, carboxymethyl cellulose and soy flour) in comparison between control and other treatments. This finding might be due to the high moisture content of goat meat than beef.[25] reported that the edible tissue of goats contained more moisture and ash than that of lambs, but less amount of fat.[26] using ground meat patties with chevon and beef found that the moisture content was 75.5%, 74.2%, 73.8%, 71.8% 70.8% and 69.4% for treatments which had 100% goat meat, 80% goat meat + 20% beef, 60% goat meat + 40% beef, 40% goat meat + 60% beef, 20% goat meat + 80% beef and 100% beef; respectively.From the obtained results presented in Table (1) the moisture content of samples were decreased as the ratio of fat replacers increased with a significant difference in comparison within each treatment, which might be due to their formulae having more amount of ingredients which could be explained on the basis that added more ingredients had a much lower moisture. Furthermore, moisture content of all samples under investigation decreased continuously after grilling except in sample had soy flour at level 10%, and as the time of storage increased till 3 months at -20˚C with a significant statistical difference in comparison between each treatment and time of storage. Such results might be due to the drip loss and partially evaporation of moisture through the polyethylene bags used for packing. The results are in agreement with those previously by[9] and[27].
3.2. Crude Protein Content
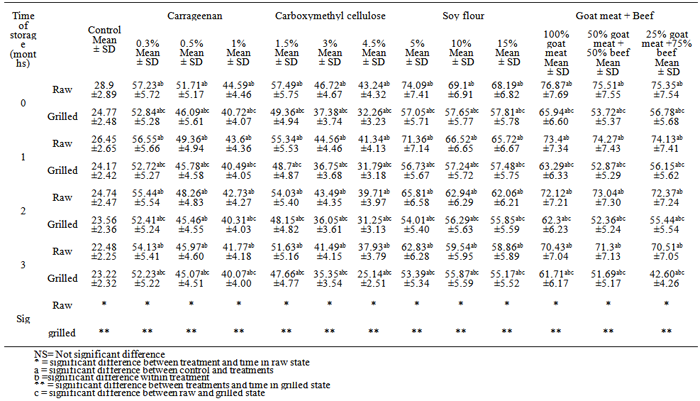
- Meat protein is known to contain all the essential amino acids which contributed to its high biological value[28]. From the results given in Table (2) it could be observed that protein content was higher for treatment containing goat meat at levels (100%, 50%, and 25%) with a significant difference in comparison between control and other treatments than that of control sample whether at zero time or at any time of frozen storage.[29] compared the texture attributes of low-fat chevon sausages to those of beef and pork sausages. They manufactured two batches each of chevon, beef, pork and mixed meat sausages prepared by using equal proportions of chevon, beef and pork lean and they found that protein contents of different type of studied sausages were similar. The protein contents were 20.00, 20.47, 21.39 and 22.03%, respectively, in chevon, beef, pork and mixed-meat sausages. While,[30] found that protein content were 23.39% and 23.41% on wet weight basis for lamb and goat meat; respectively.Meanwhile, treatment containing goat meat at levels (100, 50 and 25%) recorded high protein content followed by treatment containing soy flour at levels (5, 10 and 15%). Such results might be due to the highest original crude protein content of soy flour. Similar results are obtained by[31].Furthermore, the percentage of protein content in treatments containing carrageenan and carboxymethyl cellulose at different ratios were high and similar than that of the control sample, but lower than the treatment containing goat meat + beef and soy flour whether at zero time or at any time of frozen storage. Such results might be due to carrageenan and carboxymethyl cellulose had no protein as being polysaccharides. Similar findings were reported by reported by[10]. From the results represented in Table (2) it could be observed that protein levels decreased as the different fat replacers content increased and this could be attributable to the decrease in red meat content. Similar results were previously reported by[12];[24] and[32]. However, the protein levels increased as the soy flour content increased either after and before grilling and this could be attributable to the highest original crude protein content of soy flour. Similar findings were reported by[31]. Significant differences were found among protein contents for raw and grilled beef burger. The data concluded that protein content of grilled beef burger (on dry weight basis) was less than that of uncooked and increased when calculated (on wet weight basis). Such results agreed with[9] who found that protein content of the raw beef burger was 15.60% and turned to 21.61% in the cooked burger (on wet weight basis) with cooking yield 58.2%. While, when calculated on dry weight basis turned to 61.42% for raw beef burger and to 56.42% in cooked burger.[26] stated that protein content of raw chevon chops was 79.35% (on dry weight basis), while the protein content for cooked chevon chops by microwave 100% power, microwave 60% power and broil was 65.2% (on dry weight basis), 69.09% (on dry weight basis) and was 80.93% (on dry weight basis); respectively.[33] concluded that grilling caused a reduction in the protein content of the beef burger by 18%.
|
|
|
3.3. Ash content
- From the same Table (3) it could be seen that ash content was higher in all samples as compared with control sample due to the added fat replacers. Such results agreed with that previously reported by[34], who reported that ash content significantly increased with the addition of walnut to low-fat frankfurters[35].The data presented in Table (3) indicated that treatment containing goat meat at different levels had higher ash content than that of control sample.[25] showed that edible tissue of goats contained more moisture and ash than lambs, but less amount of fat. Moreover, from the same table it could be noticed that when the ratios of fat replacers increased the ash content increased with signific ant difference in comparison with in each treatment. This result might be due to their formulae containing high amount of ingredients.Data given in Table (3) revealed that after grilling, it could be noticed that all samples recorded no significant increase for ash content than raw beef burgers. This increase might be due to the moisture loss during cooking. This explanation coincided with[9][14] findings.[36] found that cooking of low-fat beef burger samples increased ash content to 2.41% - 2.92% in the cooked product. They found that cooking yield ranged from 72.72% to 81.46%. From their results it could be deduced that retention of ash after cooking ranged from 90.40% to 97.50%.With advancement of frozen storage, the percentage of ash content increased for all treatments whether control sample or low-fat beef burger samples with a significant statistical difference except in the sample having 50% goat meat. Such findings are in agreement with the previously reported by[10] and[14], who stated that ash content increased during frozen storage for sausages influenced by why protein, texturized soy flour and iota carrageenan stored at -18˚C for 6 months and for beef sausage, ostrich sausage and beef washed sausage; respectively.
3.4. Crude fat content
- Results given in the Table (4) illustrated that the fat content of control sample had high amount of fat with high significant difference than that of other treatments, as it was 58.29% at zero time. While, the fat yield after manual eliminating visible fat to prepare low-fat beef burgers formulae reaching to 9.40% in sample containing 0.5% carrageenan (on dry weight basis), also other treatments had approximately similar percentage of fat content.[37] prepared low-fat patties containing 5.1% fat on fresh weight basis.The low percentage of fat content in samples containing goat meat + beef at different levels might be due to that goat meat had less amount of fat.[26] showed that chevon might be an excellent resource in the preparation of low-fat diets, since the fat content of lean meat is significantly less. Similarly,[29] found that fat levels were 2.29, 7.07, 2.77 and 3.02%; respectively, in chevon, beef, pork, and mixed meat sausages. However, the increase of fat content in the treatment containing soy flour at different levels might be duo to the higher fat content of soy flour. Such results supported the finding of[31] who found that the replacement of 10% and 20% of hens meat with soy flour led to raising the higher fat content of soy flour than in hens meat. Similar findings was reported by[38]. Moreover, there was a significant difference in comparison within each treatment in most cases.Such data revealed that fat content of all treatments was decreased after grilling which might be due to fat loss from beef burger by grilling. The results are in agreement with that previously obtained by[9] who showed that grilling or microwave-grilling caused a clear reduction in the fat content of beef burger samples from ~ 12.7% (on dry weight basis) in uncooked beef burger to ~ 8% (on dry weight basis) in the grilled burger. Results given in the same Table (4) showed that the fat content of all treatments was increased as long as frozen storage period increased with a significant statistical difference on the expense of losses in moisture and protein percentage. Similar findings were reported by[14];[31] and[38].
3.5. Total Carbohydrate Contents
- From the results presented in Table (5), it could be concluded that fat replacers (carrageenan, carboxymethyl cellulose, soy flour) incorporation increased the total carbohydrates content of different low-fat beef burger with high significant difference when compared to control treatment which had 7.70% at zero time. From the same Table (5) it could be noticed that as the ratios of fat replacers increased the total carbohydrates of samples were increased with a significant difference in comparison within each treatment. This probably was due to the presence of carbohydrates in original additives as fat replacers. The treatments containing carrageenan and carboxymethyl cellulose by different levels had the highest carbohydrates content than other treatments. These results might be due to its being polysaccharides, then followed by samples which containing soy flour by different levels.[10] found that the treatment containing 8% fat + texturized soy flour had the highest carbohydrates content followed by sample having 12% fat + whey protein concentrate, then samples containing 12% fat + texturized soy flour and the treatment containing iota carrageenan having higher carbohydrate content than control sample.
|
|
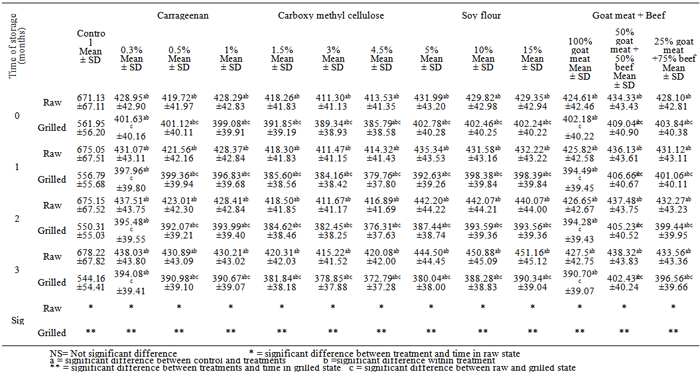
3.6. Caloric value
- Low-fat meat products can exert a bigger effect in reducing dietary fat intake as many traditional meat products had high-fat content. The decrease of fat in ingredients and the use of fat substitutes can cut down meat caloric value by up to, or more than, half[39]. The data represented in Table (6) indicated that the control sample had the highest caloric value 671.02 k. cal / 100g with high significant difference when compared with other treatments. Such results might be due to that control sample had high percentage of fat content, as expected, since fat is the most concentrated dietary energy source, providing 9 k. cal / 100 g, more than the twice that supplied by the proteins or carbohydrates[40].On the other hand, the caloric values of samples containing fat replacers were lower than the control sample. Lower caloric values in low-fat beef burger were a natural result of the reduced fat content in the formulation.[41] found that energy of the frankfurters containing carrageenan was 452.2 k. cal / 100 g, while energy of the control sample was 634.4 k. cal / 100 g. While,[42] stated that lean patties with added 0.5% carrageenan and 0.2% hydrolyzed vegetable proteins would had a composition of 66.3% moisture, 8.2% fat, 24.5% protein and 172 k. cal / 100 g. Meanwhile, there was a significant difference in comparison within each treatment in all of cases. Data indicated a clear reduction in caloric values caused by grilling process than raw beef burger. However, with advancement of frozen storage time, the caloric value of all treatments increased with a significant statistical difference. This probably was due to increased fat and carbohydrates contents during storage.
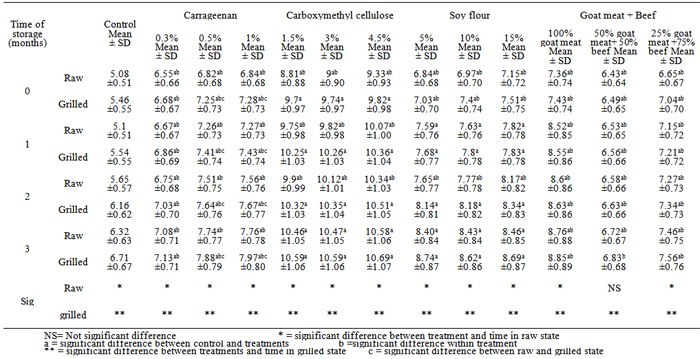
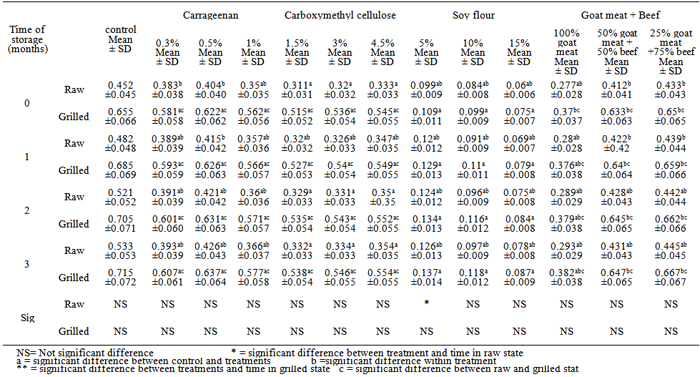
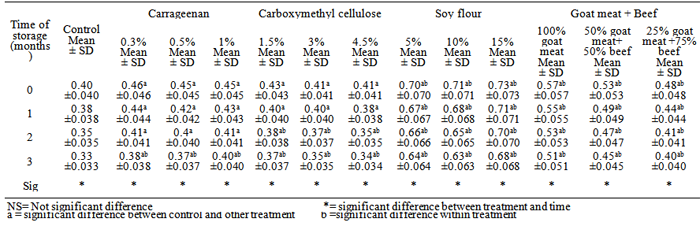
3.7. Thiobarbituric acid value (T.B.A)
- The TBA value test had been widely used for measuring oxidation rancidity in fat containing foods, especially fish and meat. The TBA test is a sensitive test for the decomposition products of highly unsaturated fatty acids[43].Results given in Table (7) indicated that TBA value for control sample had the highest TBA value, as it was 0.452 mg malonaldehyde / kg sample with a significant difference than that of other treatments. This might be due to the higher fat content of control sample when compared with other samples. Meanwhile, the samples containing soy flour at different ratios had the lower TBA values. This probably was due to the presence of natural antioxidants which could retard lipids oxidation[10].From the results presented in Table (7) it could be observed that samples containing 100% goat meat had lower TBA value as compared to control sample. This might be due to the low-fat content of goat meat.[44] reported that chevon is attractive to health conscious consumer due to its lower fat compared to other traditional red meats such as lambs, beef and pork.[25] stated that the edible tissue of goats contains more moisture and ash than that of lambs, but less amount of fat. Moreover, the samples containing 50% goat meat + 50% beef and 25% goat meat + 75% beef had lower TBA value when compared to control. Such results might be due to the low fat content.Furthermore, from the data presented in Table (7) it could be observed that the treatments containing carrageenan and carboxymethyl cellulose had lower TBA values as compared to the control sample. Lower TBA values recorded for low-fat beef burger were a natural result of the reduced fat content in the formulation.[45] found that the sausages with carrageenan had lower (P < 0.05) TBA values than that produced without carrageenan. Meanwhile, there was a significant difference in treatment having goat meat + beef and in all cases in comparison within each treatment.
|
|
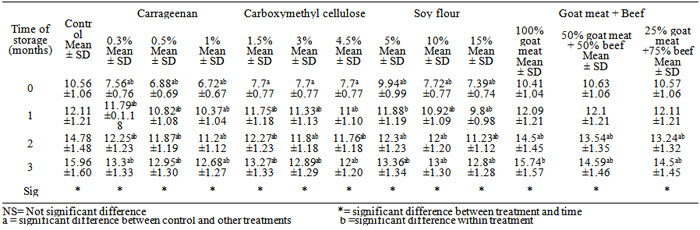
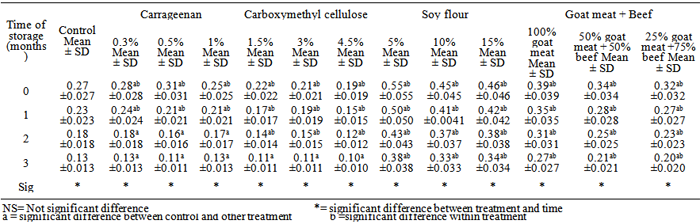
3.8. Total volatile basic nitrogen (TVBN)
- From the data obtained in Table (8) it could be observed that at any given time of frozen storage (as well as zero time), the TVN was highest for control sample with a significant difference and samples containing goat meat + beef at different levels, followed by low-fat beef burger which had soy flour at different ratios. Carrageenan, carboxymethyl cellulose and soy flour as fat substitutes reduced the level of TVBN contents which was found to increase continuously during frozen storage at -20℃ for all samples. Similar findings were previously reported by[10] who found that the TVN was highest for control sample and followed by sausages which contained either textured soy flour or iota carrageenan with 8% fat. Furthermore, there was a significant difference in comparison within each treatment in most of cases. rapid development of total volatile basic nitrogen (T.V.B.N).By advancement of frozen storage, the TVBN values of all samples increased with a significant statistical difference, which coincided with the decreasing of protein content during frozen storage as shown in Table (2).[46] mentioned that the increase in TVBN values during storage of beef sample, could be due to the bacterial breakdown associated by the formation of some alkaline substances such as ammonia, which was confirmed by the
3.9. Protein fractions
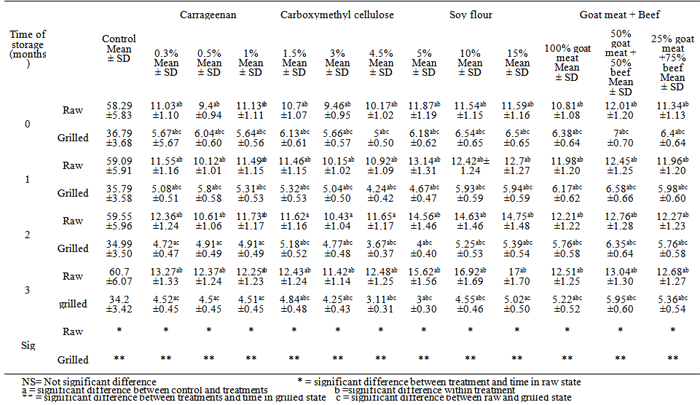
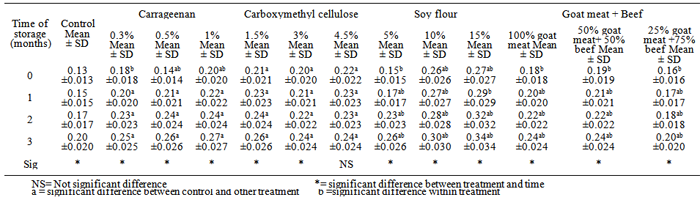
3.9.1. Total soluble nitrogen (T.S.N)
- Total soluble nitrogen fraction contains water soluble protein (sarcoplasmic proteins), salt soluble protein (myofibriullar proteins), and non protein nitrogen (free amino acid and other extractive nitrogenous compounds)[28].Data obtained in Table (9) indicated that the highest total soluble nitrogen was found in beef burgers containing soy flour at different ratios with a significant difference than that of other treatments. This might be due to the high original crude protein content of these samples as compared to control and other treatments. Such findings are in agreement with the results previously obtained by[31] who found that replacement of a part of hens meat with 10 and 20% soy flour increased the T.S.N of sausage than that of the control sample. Similar findings were reported by[27] and[38]. Besides, it might be due to the higher protein solubility of soy flour protein as reported[47] who found that the protein solubility of commercial soy flour was 21.4%. Meanwhile, there was a significant difference in comparison within each treatment in most of cases except treatments which had carrageenan and carboxymethyl cellulose. With advancement of frozen storage, the protein solubility decreased with a significant statistical difference, possibly due to protein denaturation as well as the escape of soluble nitrogen with the separated drip as reported by[48]. [49] reported that T.S.N content decreased which might be due to ascribed to possible denaturation of protein due to association of lipid oxidation and hydrolysis products with protein molecules. The decrease in protein solubility during frozen storage could be attributed to denaturation of protein associated with freezing as well as to the reaction of myosin protein with malonaldehyde which is a product of polyunsaturated fatty acids oxidation[50].[10] found that T.S.N of low-fat 8% meat sausage was 0.88% (representing 29.1% of total nitrogen) and decreased to 0.73% after 3 months of storage at -18℃.
|
|
|
|
3.9.2. Soluble protein nitrogen (S.P.N)
- Soluble protein nitrogen fraction contains only the sarcoplasmic and myofibrillar proteins[18]. It indicates the loss of solubility of proteins in meat and meat products, and can be used to follow up protein denaturation and breakdown[51].Moreover, results given in Table (10) showed that extending storage time of beef burgers was accompanied by remarkable decrease in soluble protein nitrogen.[9] found that the prepared uncooked low-fat beef burger samples and stored to 3 months at -20℃ was accompanied by remarkable decrease of soluble protein nitrogen to 0.16% in sample contained basal formula + 0.75% thyme – 0.2% in sample contained basal formula + 0.75% rosemary.
3.9.3. Non protein nitrogen (N.P.N)
- Non protein nitrogen (NPN) fraction contains free amino acids, protein degradation products and other extractive nitrogenous compounds. It can be calculated by subtracting soluble protein nitrogen (SPN) from total soluble nitrogen[18]. Non protein nitrogen was studied as an indication of protelysis[50].From data given in Table (11) it could be noted that extending storage time as influenced by different fat replacers to 3 months at -20℃ was accompanied by a gradual significant statistical increase in NPN content.[9] found that NPN content of low-fat beef burger was increased, since it reached 0.19% in samples having basal formula + 0.75% rosemary – 0.29% in sample had basal formula + 0.75%thyme after 3 months of storage at -20℃.[52] found that non protein nitrogen content (NPN) of fresh chicken white (breast) and dark (thigh) meat samples was 0.42 and 0.37%; respectively and increased to 0.5% and 0.44%; respectively after 3 months of storageat-20℃.
4. Conclusions
- On the basis of the above-mentioned data, Fat level can be successfully reduced by the addition of fat replacers (carrageenan, CMC, Soy Flour, and Chevon) at different ratios would improve nutritional value and health benefits. TBA value for control sample had the highest TBA value compared with other samples which containing fat replacers. Carrageenan, carboxymethyl cellulose and soy flour as fat substitutes reduced the level of TVBN contents. The highest total soluble nitrogen was found in beef burgers containing soy flour at different ratios. extending storage time of beef burgers was accompanied by remarkable decrease in soluble protein nitrogen and increase in non-protein nitrogen. The low-fat beef burger recommended to include in diet regimen of both over weight and obese persons as well as diabetic, hypercholesterolemic and hyperlipidimemic patients.
ACKNOWLEDGEMENTS
- The authors wish to express the acknowledgement for Food Science and Technology Department, Faculty of Ag-ricultural, and Meat and Fish Department, Food Technology Research Institute, Agricultural Research Center for pro-viding the necessary laboratory facilities to accomplish the present work.