-
Paper Information
- Next Paper
- Previous Paper
- Paper Submission
-
Journal Information
- About This Journal
- Editorial Board
- Current Issue
- Archive
- Author Guidelines
- Contact Us
Frontiers in Science
2012; 2(4): 58-61
doi: 10.5923/j.fs.20120204.02
Prediction of Some Water Quality Indices in River Yobe- Nigeria, through Annual Projections
 Abstract
 Reference
 Full-Text PDF
 Full-Text HTML
Waziri Maimuna 1, Ogugbuaja O. Victor 2
1Department of Chemistry, Yobe State University, Damaturu. Nigeria
2Department of Chemistry, University of Maiduguri. Nigeria
Correspondence to: Waziri Maimuna , Department of Chemistry, Yobe State University, Damaturu. Nigeria.
| Email: |  |
Copyright © 2012 Scientific & Academic Publishing. All Rights Reserved.
Water quality assessment or monitoring involves the determination of a number of parameters using several analytical techniques which are usually cumbersome. In this study, an attempt was made to establish relationships between some water quality indicators which can be used to predict other related parameters in order to ease up the long experimental procedures involved. This was achieved by collecting water samples from six locations along river Yobe-Nigeria during the wet and dry seasons as well as the harmattan period. The conductivity, turbidity and total dissolved solids (TDS) of the samples were measured using standard analytical techniques. Results of the study showed both location and seasonal variations in levels of the conductivity and TDS but were within the World Health Organization (WHO) and Nigerian Industrial Standard (NIS) permissible limits for drinking water. However, the levels of turbidity which ranged from 11.33 2.16 NTU to 21.83
 3.97NTU exceeded the standard limits. Significant differences (p<0.05) in conductivity, TDS and turbidity were recorded between seasons at most of the locations. Based on the data obtained, annual variations were calculated and empirical relationships between these three variables were established. The relationships suggest that the quality of the river investigated can be monitored effectively by controlling the conductivity of the water. The relationships may also be applicable to surface waters which contain similar composition of ions in the water and can be used to predict levels of other related physicochemical parameters used in assessing quality of the surface water.
Keywords: Relationships, Physicochemical Parameters, Prediction, Seasonal Variation, Harmattan Period
Article Outline
1. Introduction
- Water pollution is a global problem and the complexity involved in assessment and monitoring of water quality may be associated with the vast potential sources of water pollution. It is also a fact that water analysis involves a multitude of parameters with a corresponding larger multitude of analytical techniques. Relationships between dependent and independent variables have been used to relate pollution indicators and estimate the quantity and quality of pollutants or indicators in water bodies[1-4]. Conductivity has been used as a standard water quality parameter[5, 6]. It provides a clear view of the total ionic strength and extent of salinity as well as assesses the TDS in a water body. Studies have shown the importance of conductivity in geophysical mapping of polluted Ground water and in separating hydrographs like wise in the establishment of empherical relationships with other water quality parameters[7-9]. Furthermore, the use of Geographical Information Systems to relate conductivity toother water quality parameters have been reported[10,11]. Water turbidity has also been related to bacterial population in drinking water[12].The aim of this study is to establish relationships between annual variations in conductivity and other pollution indicators in order to establish an instant measurement methodology to predict other physicochemical water quality indicators in the area of study. The establishment of such relationships will provide an instant highlight on which parameter to concentrate on, in order to maintain the quality of the water.
2. Materials and Methods
2.1. Determination of Conductivity and TDS
- Conductivity/TDS meter Hach model 44600 was used to measure the conductivity and TDS levels of all the samples. The procedures used were as contained in the manufacturer’s manual for the equipment.
2.2 Determination of Turbidity
- The turbidity of the water samples was determined using the absorbtimetric method of the Smart spectrophotometer (Lamotte model) with standard formazin solution as a reference. The procedures used were as contained in the manufacturer’s manual for the equipment.
2.3. Data Analysis
- Results obtained were expressed as mean± SD and statistically analysed for significance in variations between sampling locations. The t-test was used for variationsbetween seasons while variations between sampling locations by analysis of variance (ANOVA) Microsoft Excel+Analyse-it v. 2.10).Variations were considered significant at p<0.05.
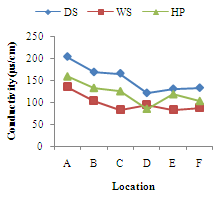 | Figure 1. Seasonal variations of Conductivity(µs/cm) at different Locations of River Yobe |
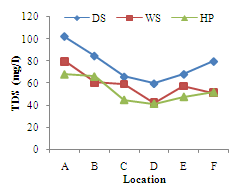 | Figure 2. Seasonal variations of Total dissolved solids(mg/l) at different Locations of River Yobe |
3. Results and Discussion
- Conductivity ranged from 82.83+10.55µs/cm (location E) to 204.00+45.37µs/cm (location A). The highest value was recorded during the dry season and lowest during the harmattan period (Figure 1). Higher values of theconductivity may be due to increased ionic compounds for the water samples resulting in decrease in conductivity with increase in turbidity. The highest conductivity values recorded during the dry season may be attributed to high evapotranspiration and pollution from the use of manure and fertilizers for irrigation activities. Similar high conductivities values associated with evaporation from intensive agricultural activities in the Great Salt Lake in Utah and Mono Lake in California have been reported[13, 14]. Low conductivity in the wet season lower than the harmattan values may be due to likely dilution from the enormous amount of rainfall and cleansing of the flooded waters. Significant differences (p<0.05) were recorded within and between locations at most of the locations.The seasonal variations of total dissolved solids (TDS) at all the locations are shown in Figure 2. This followed similar pattern as that of conductivity since the amount of dissolved solids in water affects its ability to conduct electricity, however, this was not the case in the harmattan period. The high levels of TDS during the harmattan period may be associated with compositions of complex particulate matter which is characteristic of the harmattan period[15]. This complex particulate matter consists of both inorganic and organic chemicals, as well as microbial entities[16, 17]. Similar studies have shown that high rates of deposition of organic pollutants is responsible for high values of TDS and low DO in surface water[1] hence, the high TDS values in the harmattan period when compared to the dry season recorded in this study. High concentrations of TDS can lower the water quality and cause water balance problems for individual organisms and aquatic life. Although there is no serious health effect associated with TDS ingestion in drinking water but earlier research revealed an inverse relationship between TDS concentrations in drinking water and the incidence of cancer, coronary heart disease and cardiovascular diseases[18-20].Turbidity levels ranged from 11.33+2.16 NTU (location A) to 21.83+3.97NTU (location D) as shown in Figure 3. All the locations exceeded the 5NTU recommended turbidity level stipulated by WHO[21] and NIS[22]. Though rainfall and river flow are related to turbidity but high turbidity peaks were also noted during the harmattan period (Figure 3).
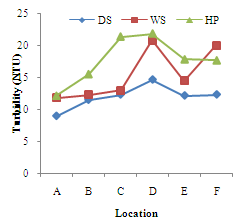 | Figure 3. Seasonal variations of Turbidity (NTU) at different Locations of River Yobe |
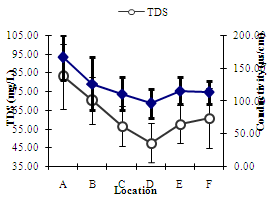 | Figure 4. Annual Estimated Mean Variations of TDS (mg/L)and Conductivity (µs/cm) at different Locations of the River Yobe |
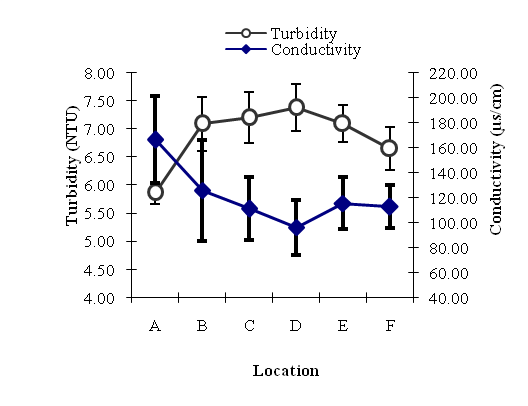 | Figure 5. Annual Estimated Mean Variations of Turbidity (NTU) and Conductivity (µs/cm) at different Locations of River Yobe |
4. Conclusions
- Seasonal variations in conductivity, total dissolved solids and turbidity of river Yobe water samples were investigated and results showed both seasonal and location variations. Annual variations in the parameters were computed and relationships were established which can provide an instant highlight or a guide on which parameter to focus on. This suggests that the established relationships can provide a guide for prediction or forecasting in order to maintain quality of the water.