-
Paper Information
- Previous Paper
- Paper Submission
-
Journal Information
- About This Journal
- Editorial Board
- Current Issue
- Archive
- Author Guidelines
- Contact Us
Frontiers in Science
p-ISSN: 2166-6083 e-ISSN: 2166-6113
2012; 2(3): 47-52
doi: 10.5923/j.fs.20120203.06
Study on Noise Levels Generated due to Jack Hammer Drills in Granite Quarries
 Abstract
 Reference
 Full-Text PDF
 Full-Text HTML
Piyush Gupta, Surendra Roy, A. Rajan Babu
National Institute of Rock Mechanics, Kolar Gold Fields, India
Correspondence to: Piyush Gupta, National Institute of Rock Mechanics, Kolar Gold Fields, India.
| Email: |  |
Copyright © 2012 Scientific & Academic Publishing. All Rights Reserved.
In this study, environmental noise and operator noise dose generated by jack hammer drilling were monitored in seven granite quarries in South India. The ambient noise was monitored at different distances and directions from the source. The maximum noise level was found in the downwind direction. The correlation study between distance and noise level was carried out to determine the safe zone limit for each quarry. To know the combined influence of compressive strength, rock density and distance, multiple regression analysis of data was conducted and a model was developed for the prediction of noise levels. Model adequacy was checked using F-statistics, normal distribution curve and correlation between predicted and measured values of noise levels. The operator noise dose in each quarry exceeded the prescribed limit. However, it can be controlled by providing ear plugs/ear muffs and by properly maintaining the jack hammers.
Keywords: Noise Levels, Environmental Noise, Operator Noise Dose, Jack Hammer Machine, Safe Zone Limit, Regression Analysis
Article Outline
1. Introduction
- In granite quarries, various machinery like jack hammer, air compressor, excavator, crusher etc. are used for different operations, which generate noise pollution and can influence the operators and surroundings. Among them, jack hammer driven by compressed air is used to drill blast holes in the quarries, which generates high noise levels. Sound levels in surface mines of India, generally exceed the standards, leads to severe health-related impacts[1] and cause temporary or permanent impairment of hearing ability[2] in mine workers. Its excessive values can increase pulse rate, blood pressure, nervousness, annoyance, sleeplessness and affects the human health and behaviour[3-4]. According to Camargo et al.[5], occupational hearing loss is still the most prevalent disease in the mining industry. In order to protect the health and safety of operators and their surroundings, the Director General of Mines Safety (DGMS) - India has defined the maximum allowable daily noise exposure as 90 dB(A) in an eight-hour shift with unprotected ears via their circular no. DG (Tech) / 18, 1975[6]. This regulation deals with noise dose but it does not cover environmental noise. The Government of India has made another standard applicablefor environmental noise. This standard limits the sound level to 75 dB(A) from 6 AM to 10 PM and 70 dB(A) from 10 PM to 6 AM[7]. Therefore, noise levels needs to be monitored in terms of occupational noise and environmental noise to determine whether the noise criteria specified in the regulations are complied with or not.Some investigators studied the mining machinery noise when the machine was at full idle in neutral[8-9] but the noise generated by a machine in the production environment includes both process-generated and machinery-generated noise[10]. In addition to rock properties and distances[10], topography and wind direction can also influence the noise levels. In this study, environmental noise and operator noise dose was monitored in seven different granite quarries during drilling operation of jack hammer machine. The monitored values were compared with environmental standards. The influence of rock properties, wind direction and distance has been studied. The safe zone limits for the noise level as well as statistical model for the prediction of noise levels has also been discussed in this paper.
2. Site Description
- The noise generated due to jack hammer drilling operation was studied in different granite quarries namely A, B, C, D, E, F and G. The details of the quarries are given in Table1.
3. Details of Jack Hammer used for Drilling
- Usually pneumatic rock drill is used for the dimension stone technology. In the quarries, drilling was carried out by compressed air jack hammer (Make: Atlas Copco). Technical specifications of jack hammer drill used in the quarries are given in Table 2.
| |||||||||||||||||||||||||||
4. Environmental Noise Measurements
- The environmental sound levels were measured with a Bruel & Kjaer Integrating Sound Level Meter (Model no. 2239A). The measurement range of the instrument was set depending on the expected sound level 70-140 dB(A). The instrument was held at arm’s length while making the measurement. The noise measurements were stored on the instrument and then downloaded to a computer. A-weighted equivalent continuous sound pressure level (Leq) measurements were carried out at different distances from the jack hammer drill machine without interference of other machines. Depending on the site conditions, monitoring was carried out in different directions and distances. The Leq was measured with a time interval of 5 min. The procedures of noise monitoring were kept same in all the quarries. Noise levels monitored at different distances and directions for different quarries are shown in Figure 1. Due to site constraints, monitoring could not be conducted in all the directions in the quarries. In quarry A, noise level was higher in north-west compared to others (Figure 1a). This may be due to wind was blowing from that direction and the fluctuations in wind speed might be the reasons for the higher noise levels. The trend lines of noise levels for the different directions of quarry B, C, D, E, F and G (Figure 1b-g) were same indicating that direction did not influence the noise levels. Absence of wind during monitoring period could be the reasons for similar trend lines. It was observed that even at the same distance, noise levels varied from one quarry to other. Variation in geology and rock properties (Table 1) from one quarry to others might influence the noise levels[10]. At each quarry, noise levels exceeded the standards at monitored locations except in south-west direction of quarry A.
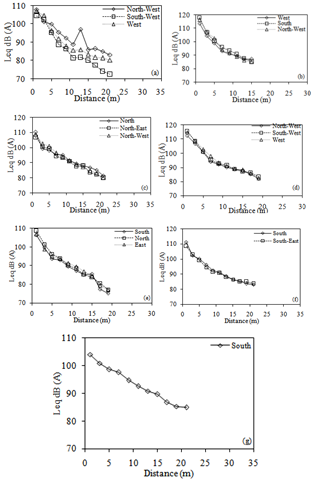 | Figure 1. Variation in sound level with respect to distance and direction in (a) Quarry A (b) Quarry B (c) Quarry C (d) Quarry D (e) Quarry E (f) Quarry F and (g) Quarry G |
4.1. Assessment of Safe Zone Limits
- The safe zone limit represents the distance beyond which noise level remains within the norms i.e. mine workers will not suffer from the noise if they work beyond this zone. Since the noise level at the monitored distances exceeded the standard, therefore, an attempt was made to determine the safe zone limit. As there were no significant variations in noise levels in different direction of monitoring in the quarry therefore the data of each quarry was combined and analysed separately. Using the data, correlations between distances and noise levels were derived. The correlation coefficient of each quarry was found statistically significant at 1% level of significance (Figure 2). Negative correlation indicated as the distance increased the noise level decreased. Variation in noise levels at the distances might be due to rock properties. The results also agreed with Roy and Adhikari[10]. The safe zone for each quarry was determined by extending the trend line on x-axis (Table 2).
|
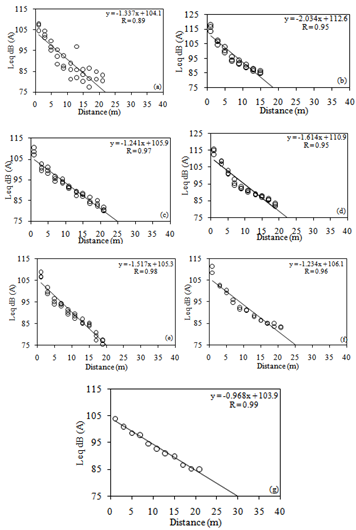 | Figure 2. Correlation between distance and sound level for (a) Quarry A (b) Quarry B (c) Quarry C (d) Quarry D (e) Quarry E (f) Quarry F and (g) Quarry G |
4.2. Statistical Analysis of Data
- It was found that different parameters like rock density, compressive strength and distance may influence the noise level. Therefore, to find out the combined influence of these parameters on noise levels, multiple regression analysis of 183 sets of data, consisting of all quarries was carried out using SPSS software version 13.0 and the following predictive equation was derived.Leq (dBA) = 83.372 – 1.419*Distance (m) – 0.014*Compressive strength (Mpa) + 0.009* Density (kg/m3) (1)Analysis of variance (ANOVA) for this model indicated that observed value of F is 346.921 whereas critical value of F-Statistics0.01,3,179 is 3.78. It reveals that observed value is many times higher than critical value. According to Montgomery et al.[11], for the regression model, to be useful as a predictor, observed F ratio must be at least four or five times greater than critical value of F-Statistics. Hence the model is more adequate for prediction of noise levels.The study of residuals (or error) is very important in deciding the adequacy of the statistical model. If the error shows any kind of pattern that means the model is not taking care for all the systematic information. For the best performance of the model, residuals should be random i.e. they should follow the normal distribution with zero mean and constant variance[12]. Figure 3 indicates histograms of the residuals of noise level. The residuals analysis shows that the residuals are distributed normally with zero mean and constant variance. Therefore, the model can be used for predicting the noise levels. Grivas and Chaloulakou[13] and Papanastasiou et al.[14] used correlation coefficient (R) between measured and predicted values for the evaluation of model performance. Figure 4 shows the plots of predicted and measured values of Leq. The correlation coefficient (R) for equation (1) is 0.92, which is significant in statistical sense at 1% level of significance. The regression coefficients (83.372, -1.419 and 0.009) are also statistically significant at 1% level of significance indicating that ambient Leq can be calculated using the equation (1) for any of the quarries.
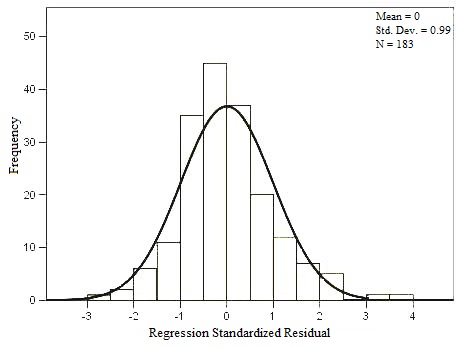 | Figure 3. Standardized residual analysis of Leq |
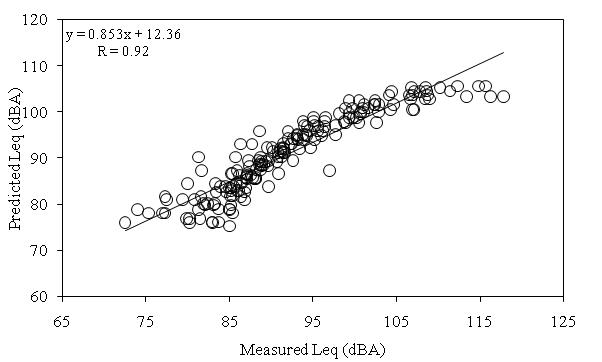 | Figure 4. Correlation between measured and predicted values of Leq |
5. Operator’s Noise Dose Measurements
- Noise dose is the amount of noise exposure that an employee or operator is exposed for a given amount of time[15]. The noise dose for the operators of compressed air jack hammers was measured using Logging Noise Dose Meter (Make: Bruel & Kjaer, Model 4445). The instrument range was set to 70 to 140 dB. The microphone was positioned about 100 mm from the operator’s ear and clipped to his collar while the meter was secured in his breast pocket. The operators were not using any hearing protection devices. These procedures were followed for the operators of all the seven quarries. As the operator works for 8 hours in the mine, therefore, operator’s noise dose was monitored for this period to compare with the Indian regulations.
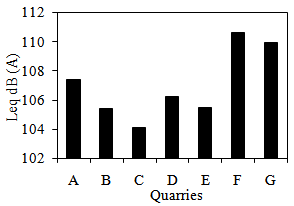 | Figure 5. Operator noise dose for different quarries |
6. Conclusions
- At most of the locations in the quarries, noise levels exceeded the prescribed limit. Safe zone limit for each quarry was found 30 m indicating that noise will not affect the surroundings beyond this distance. This variation in noise levels was influenced by the topography, geological discontinuities, rock properties, distance and presence of wind. Multiple regression analysis of data revealed that distance, compressive strength and density influenced the noise levels. Using these parameters, a model was developed for the prediction of noise level and the adequacy of model indicated that it can be used to predict noise levels at the quarries.Operator noise dose exceeded the limit prescribed by the DGMS at each quarry. Geology, rock properties, hilly terrain adjacent to the drilling point was also responsible for higher noise dose. Noise dose levels can be minimized by periodic maintenance of jack hammers as well as by providing protective devices like ear plugs/ear muffs.
ACKNOWLEDGEMENTS
- The authors are thankful to The Director, National Institute of Rock Mechanics for giving permission to publish the paper.
References
| [1] | Vardhan, H., Karmakar, N.C. and Rao, Y.V., 2006, Assessment of heavy earth-moving machinery noise vis-à-vis routine maintenance., Noise Control Eng. J., 54 (2), 64-78. |
| [2] | C.G. Down and J. Stocks, Noise (Excluding Air Blast). In: Environmental Impact of Mining, Applied Science Publishers Ltd., London, 1977. |
| [3] | T. Godish, Air Quality, 4th ed., Lewish Publishers Inc., Chelsea, Michigan, USA, 2004. |
| [4] | Okten, G., Tuncel, Z. and Kuzu, C., 1998, An investigation of noise pollution in Istanbul Metro tunnel drivages. In: Environmental Issues and Waste Management in Energy and Mineral Production (eds. Pasamehmetoglu & Ozgenoglurears), Balkema, Rotterdam, pp. 189-193. |
| [5] | Camargo, H.E., Peterson, J.S., Kovalchik, P.G. and Alcorn, L.A., 2010, Acoustic assessment of pneumatic and electric jackleg drills used in the mining industry, Proc., National Conference on Noise Control Engineering and 159th Meeting of the Acoustical Society of America (eds. C.B. Burroughs and G. Maling), Baltimore, Maryland, April 19-21, pp. 1-11. |
| [6] | Dubey, A. and Nath, R., 2000, A study of noise pollution due to opencast coal mining activity, Minetech, 21 (1), 37-39. |
| [7] | The Environmental (Protection) Act, 1986, Universal Law Publishing Co. Pvt. Ltd., Delhi, India, 2000. |
| [8] | Vardhan, H. and Adhikari, G.R., 2006, Development of noise spectrum based maintenance guideline for reduction of heavy earth moving machinery noise., Noise Control Eng. J., 54 (4), 236-244. |
| [9] | CMRS (Central Mining Research Station) Report, Noise problem arising out of coal mining activities and its abatement., CMRS, Dhanbad, India, 1985. |
| [10] | Roy, S. and Adhikari, G.R., 2007, Worker noise exposures from diesel and electric surface coal mining machinery., Noise Control Eng. J., 55 (5), 434-437. |
| [11] | D.C. Montgomery, E.A. Peck and G.G. Vining, Introduction to Linear Regression Analysis, John Wiley & Sons, Inc., New York, 2003. |
| [12] | Goyal, P., Chan, A.T. and Jaiswal, N., 2006, Statistical models for the prediction of respirable suspended particulate matter in urban cities., Atmos. Environ., 40, 2068-2077. |
| [13] | Grivas, G. and Chaloulakou, A., 2006, Artificial neural network for prediction of PM10 hourly concentrations, in the Greater Area of Athens, Greece., Atmos. Environ., 40, 1216-1229. |
| [14] | Papanastasiou, D.K., Melas, D. and Kioutsioukis, I., 2007, Development and assessment of neural network and multiple regression models in order to predict PM10 levels in a medium-sized Mediterranean city., Water Air Soil Pollut., 182, 325-334. |
| [15] | L. Marraccini, Noise Abatement. In: SME Mining Engineering Handbook, 2nd ed, Volume 1, H. L. Hartman, Sr. Ed., published by Society for mining, metallurgy and exploration, Inc., Littleton, Colorado, 1992. |
| [16] | Ramlu, M.A., 2004, Occupational noise exposure and hearing damage., J. Mines Met. Fuels., 52 (12), 415-419. |
| [17] | Sensogut, C., 2007, Occupational noise in mines and its control - A case study., Polish J. of Environ. Stud., 16 (6), 939-942. |