Frontiers in Science

p-ISSN: 2166-6083    e-ISSN: 2166-6113

2012;  2(3): 28-36

doi:10.5923/j.fs.20120203.03

Heavy Metal Pollution in Mithi River of Mumbai

Pravin U. Singare, Ravindra M. Mishra, Manisha P. Trivedi

Department of Chemistry, Bhavan’s College, Munshi Nagar, Andheri (West), Mumbai 400058, India

Correspondence to: Pravin U. Singare, Department of Chemistry, Bhavan’s College, Munshi Nagar, Andheri (West), Mumbai 400058, India.

Email:

Copyright © 2012 Scientific & Academic Publishing. All Rights Reserved.

Abstract

The present study highlight the toxicity levels of different heavy metals in aquatic environment of one of the most polluted river of Mumbai- the Mithi River. Although the river has attracted tremendous attention after 26/7 flood in Mumbai, the pollution level of the river has remained neglected issue. The present study was performed for two assessment years 2009-10 and 2010-11 at three different sampling stations namely Airport, CST Kalina and BKC Taximen’s Colonyalong the flow of Mithi River. The results of present investigation indicates that the concentration levels of most of the heavy metals like Al, As, Cd, Cr, Hg, Ni, Pb, Sr and Mn obtained during the assessment year 2010-11 was higher than that obtained during 2009-10 by the factor of 1.4 to 5.7 µg/L. The environmental impact of these toxic heavy metals is discussed. The results point out the need of rational planning of pollution control strategies, so as to keep check on release of toxic heavy metals in the river. It is expected that the present study will be useful for rational planning of pollution control strategies and their prioritisation; to evaluate effectiveness of pollution control measures already is existence and to assess the nature and extent of pollution control needed.

Keywords: Heavy Metals, Water Pollution, Toxicity, Environmental Impact, Mithi River, Mumbai, India

Cite this paper: Pravin U. Singare, Ravindra M. Mishra, Manisha P. Trivedi, Heavy Metal Pollution in Mithi River of Mumbai, Frontiers in Science, Vol. 2 No. 3, 2012, pp. 28-36. doi: 10.5923/j.fs.20120203.03.

1. Introduction

Heavy metals are considered very important and highly toxic pollutants in the various environmental departments. Ecotoxicologists and environmental scientists use the term “heavy metals” to refer to metals that have caused environmental problems. Heavy metals including both essential and non-essential elements have a particular significance in ecotoxicology, since they are highly persistent and all have the potential to be toxic to living organisms[1]. The metals which have been studied extensively the last decades are: Cd, Hg, Zn, Cu, Ni, Cr, Pb, Co, V, Ti, Fe, Mn, Ag and Sn. Some metals that have received more attention are Hg, Cd, and Pb, because of their highly toxic properties and their effects on the environment and the living organisms. Inputs of these toxic heavy metals to the environment as a result of anthropogenic activities is difficult to measure due to the very large natural inputs from the erosion or rocks, wind-blowing dusts, volcanic activity and forest fires. Atmospheric and river inputs, dredging spoil, direct discharges, industrial dumping and sewage sludge are some of the important contributors to metal pollution, which lead to the release of toxic heavy metals to the marine environment. Some metals enter the sea from the atmosphere, e.g. natural inputs of metals, such as Aluminium (Al) in wind-blowing dust of rocks and shales, and mercury (Hg) from volcanic activity. Lead (Pb) inputs in the atmosphere from industrial and vehicular exhaust are much greater than natural inputs. Some metals are deposited by gas exchange at the sea surface, by fallout of particles (dry deposition) or are scavenged from the air column by precipitation (rain) which is called wet deposition. The nature of metals depends on ore-bearing deposits in the catchment area and the discharge of human waste when the river passes through urban areas. Dredging of shipping channels produces large quantities of metal pollution. Much smaller quantities of metals are added to the sea by direct discharges of industrial and other waste and the dumping of sewage sludge[2]. Acid rain resulting from dissolved hydrogen sulphide, sulphur dioxide and oxides of nitrogen has contributed to alterations of soil and freshwater acidity. As a consequence there is an increase in the bioavailability of many heavy metals to freshwater biota[3].
Metals are separated into the essentials and non-essentials in classes A and B, and in a borderline class[2].
Class A metals: Calcium (Ca), Magnesium (Mg), Manganese (Mn), Potassium (K), Sodium (Na), Strontium (Sr)
Class B metals: Cadmium (Cd), Copper (Cu), Mercury (Hg), Silver (Ag)
Borderline metals: Zinc (Zn), Lead (Pb), Iron (Fe), Chromium (Cr), Cobalt (Co) Nickel (Ni), Arsenic (As), Vanadium (V), Tin (Sn).
The world-wide emissions of metals to the atmosphere (thousands of tons per year) by natural sources is estimated as: Ni: 26, Pb: 19, Cu: 19, As: 7.8, Zn: 4, Cd: 1.0, Se: 0.4, (x103tons.Year-1). Whereas, from anthropogenic sources: Pb: 450, Zn: 320, Ni: 47, Cu: 56, As: 24, Cd: 7.5, Se: 1.1 (x103tons. Year-1). It is obvious from these numbers that Pb, Zn, Ni and Cu are the most important metal pollutants from human activities[4]. Heavy metal pollution of freshwater ecosystems has been shown to be extensive[5]. Rivers make a major contribution of metals in the marine environment and are considered as a dominant pathway for metals transport[6]. As a result heavy metals become significant pollutants of many riverine systems. The behavior of metals in natural waters is a function of the substrate sediment composition, the suspended sediment composition, and the water chemistry. During their transport, the heavy metals undergo numerous changes in their speciation due to dissolution, precipitation, sorption and complexation phenomena[7,8] which affect their behaviour and bioavailability[9]. Hence, heavy metals are sensitive indicators for monitoring changes in the aquatic environment.
The preservation of aquatic resources for ecosystem and human health and well-being is a paramount concern worldwide and it has become evident that approaches to managing aquatic resources must be undertaken within the context of ecosystem dynamics in order that their exploitation for human uses remains sustainable[10]. If aquatic resources are not properly managed and aquatic ecosystems deteriorate, then human health and well-being may be compromised. Water quality monitoring for the detection of trends, impacts, and improvements is further complicated because the issues of concern and available resources are constantly changing[11]. Although it is not always possible to predict new and emerging threats to aquatic ecosystems, baseline water quality monitoring must be maintained to facilitate the early detection of such threats. The success of local, regional, and global efforts to curb rates of water quality degradation can only be measured if sufficient data are available that enable the tracking of trends over time and space.
The problem of water quality degradation due to toxic heavy metals has begun to cause concern now in most of the major metropolitan cities in Maharashtra state of India and Mumbai is not an exception to it. The day by day deteriorating quality of water bodies in the country[12-22] has prompted us to carry the systematic and detail study of pollution due to toxic heavy metals in water of Mithi River, which due to rapid urbanisation and industrialisation is considered as one of the highly polluted river of Mumbai.

2. Materials and Methods

2.1. Area of Study

The water sampling was done from three different sampling stations along the flow of Mithi River namely Airport (L1), CST Kalina (L2) and BKC Taximen’s Colony (L3). Airport site near Jari Mari area is thickly populated and has many small scale industries including scrap dealers. Previous short term study conducted by Maharashtra Pollution Control Board shows the presence of cyanide, consistent high COD, oil and grease found at this station indicating some chemical activity in that area[21]. Unauthorized encroachments by illegal industrial units, scrap dealers and oil mixing business at CST road near Kalina, have further resulted in discharge of solid waste, organic waste, industrial waste, heavy metals, oils and tar in the river. This sampling point is surrounded by many small scale industries including recyclers, barrel cleaners, workshops and other units. This area has thick density of population. Illegal activities like washing of oily drums have resulted in discharge of unauthorized hazardous waste which is carried out along the bank of this river. Development of Bandra-Kurla Complex has resulted in diversion and unnatural turn along the Mithi River at few places thereby affecting natural flow of the river and seriously affected the drainage. This part of the river is a dumping ground for garbage and it is reflected in higher values of suspended solids. The organic waste, sludge and garbage dumping has reduced the carrying capacity of the Mithi River. The solid wastes which is discharged in to the Mithi river from the surrounding illegal industries and the slums has resulted in sever water logging during 26/7 deluge in Mumbai. The map showing flow of Mithi River is shown in Figure 1.
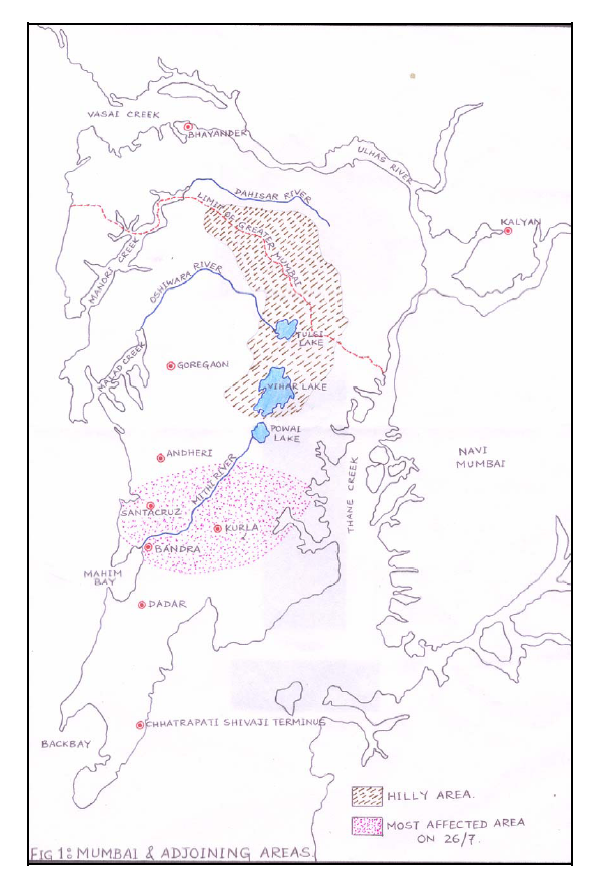
Figure 1. Map showing flow of Mithi River in Mumbai

2.2. Climatic Conditions

The area is located along western Arabian cost of India from 18 deg. 53’ north to 19 deg. 16’ north latitude and from 72 deg. east to 72 deg. 59’ longitude. The area experiences tropical savanna climate. It receives heavy south west monsoon rainfall, measuring 2166 mm on an average every year. The temperature ranges from 16 deg. centigrade to 39 deg. centigrade with marginal changes between summer and winter months. Whereas relative humidity ranges between 54.5 to 85.5%.

2.3. Requirements

The chemicals and reagent were used for analysis were of Analytical Reagent (AR) grade. The procedure for calculating the different parameters were conducted in the laboratory. The laboratory apparatus were acid soaked (nitric acid) before the analysis. After acid soaked, it is rinsed thoroughly with tap water and de-ionised distilled water to ensure complete removal of traces of cleaning reagents. The pipettes and burette were rinsed with solution before final use.

2.4. Water Sampling and Sample Preparation

The water samples were collected randomly twice in a month in morning, afternoon and evening session from three different sampling stations along the flow of Mithi River. The samples were collected and subsequently analysed for a span of two years starting from October 2009 to September 2011. The sampling was done in three shifts i.e. morning shift between 07:00 a.m. to 09:00 a.m., afternoon shift between 02:00 p.m. to 04:00 p.m. and evening shift between 07:00 p.m. to 09:00 p.m. Polythene bottles of 2.5 L and 2.0 L were used to collect the grab water samples (number of samples collected, n = 19). The bottles were thoroughly cleaned with hydrochloric acid, washed with tape water to render free of acid, washed with distilled water twice, again rinsed with the water sample to be collected and then filled up the bottle with the sample leaving only a small air gap at the top. The sample bottles were stoppard and sealed with paraffin wax. Water samples (500 mL) were filtered using Whatman No. 41 (0.45 μm pore size) filter paper for estimation of dissolved metal content. Filtrate (500 mL) was preserved with 2 mL nitric acid to prevent the precipitation of metals. The samples were concentrated to tenfold on a water bath and subjected to nitric acid digestion using the microwave-assisted technique, setting pressure at 30 bars and power at 700 Watts[23,24]. About 400 mL of the sample was transformed into clean glass separating funnel in which 10 mL of 2% ammonium pyrrolidine dithiocarbamate, 4 mL of 0.5 M HCl and 10 mL of methyl isobutyl ketone (MIBK) are added[25]. The solution in separating funnel was shaken vigorously for 2 min and was left undisturbed for the phases to separate. The MIBK extract containing the desired metals was then diluted to give final volumes depending on the suspected level of the metals[26]. The sample solution was then aspirated into air acetylene flame in an atomic absorption spectrophotometer.

2.5. Heavy Metal Analysis by AAS Technique

The analysis for the majority of the trace metals like aluminium (Al), cadmium (Cd), chromium (Cr), nickel (Ni), lead (Pb), strontium (Sr) and manganese (Mn) was done by Perkin Elmer ASS-280 Flame Atomic Absorption Spectrophotometer. Arsenic (As) was determined by hydride generation coupled with an atomic fluorescence detector, while mercury (Hg) was analysed with a cold-vapour atomic adsorption spectrophotometer. The calibration curves were prepared separately for all the metals by running different concentrations of standard solutions. A reagent blank sample was analyzed and subtracted from the samples to correct for reagent impurities and other sources of errors from the environment. Average values of three replicates were taken for each determination.

2.6. Quality Control/Assurance

Water samples were collected in polythene bottles that were free from heavy metals and organics and well covered while transporting from field to the laboratory to avoid contamination from the environment. Reagent blanks were used in all analyses to check reagent impurities and other environmental contaminations during analyses. Analytical grade reagents were used for all analyses. All glassware used were soaked in appropriate dilute acids overnight and washed with teepol and rinsed with deionised water before use. Tools and work surfaces were carefully cleaned for each sample during grinding to avoid cross contamination. Replicate samples were analysed to check precision of the analytical method and instrument. To validate the analytical procedures used, the spike recovery test was conducted on some samples for Al, As, Cd, Cr, Ni, Pb, Sr, Mn and Hg.

3. Results and Discussion

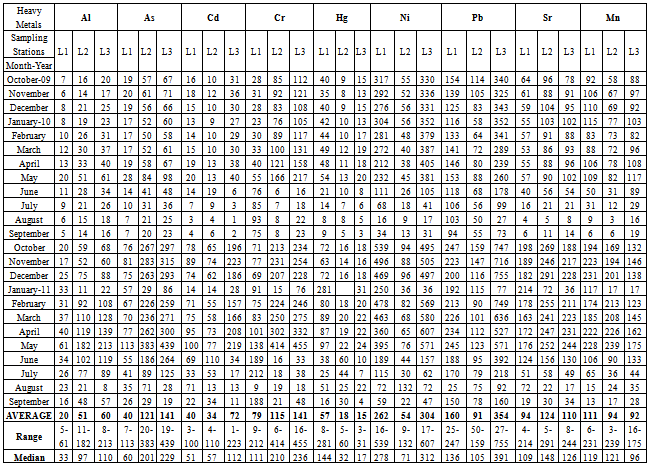
A number of elements are normally present in relatively low concentrations, usually less than a few mg/L, in conventional irrigation waters and are called trace elements. Heavy metals are a special group of trace elements which have been shown to create definite health hazards when taken up by plants. Under this group are included, Cr, Cd, Ni, Zn, Cu, Pb and Fe. These are called heavy metals because in their metallic form, their densities are greater than 4 g/cc. The experimental data on concentration (µg/L) of toxic heavy metals like Al, As, Cd, Cr, Hg, Ni, Pb, Sr and Mn in the water samples collected along sampling stations L1, L2 and L3 of Mithi River is presented in Table 1. The trend in average concentration of these metals at different sampling stations for two assessment years 2009-10 and 2010-11 is graphically represented in Figures 2-4.
The effects of aluminium (Al) have drawn our attention, mainly due to the acidifying problems. Al may accumulate in plants and cause health problems for animals that consume these plants. The concentrations of Al appear to be highest in acidified aquatic environment[27]. In such aquatic environment the number of fish and amphibians is declining due to reactions of aluminium ions with proteins in the gills of fish and the embryo's of frogs[28].
Table 1. Heavy Metal Content in Water Samples Collected at different Sampling Stations along Mithi River of Mumbai (values in µg/L)
     
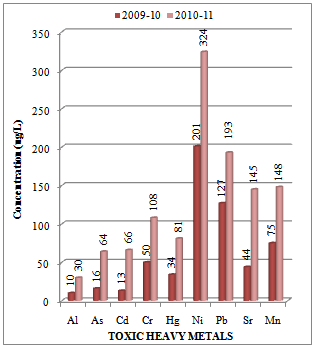
Figure 2. Variation in average concentration values of different toxic heavy metals in water samples collected at sampling station L-1 of Mithi River during the assessment year 2009-10 and 2010-11
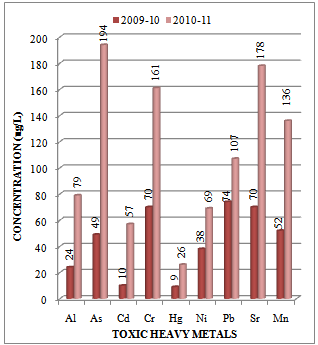
Figure 3. Variation in average concentration values of different toxic heavy metals in water samples collected at sampling station L-2 of Mithi River during the assessment year 2009-10 and 2010-11
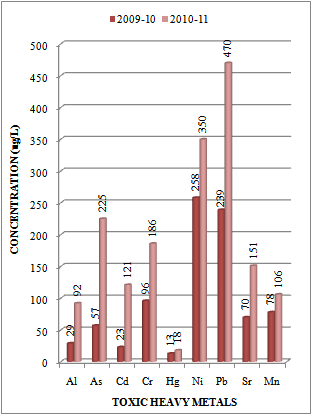
Figure 4. Variation in average concentration values of different toxic heavy metals in water samples collected at sampling station L-3 of Mithi River during the assessment year 2009-10 and 2010-11
From the results of present investigation it was observed that Al concentration at different sampling stations lies in the range of 5-61, 11-182 and 8-213 µg/L at L1, L2 and L3 sampling stations respectively. The biyearly average Al concentration was found to be 20, 51 and 60 µg/L respectively at different sampling stations (Table 1). It was also observed that the average Al concentration for assessment year 2010-11 was higher than that obtained for the assessment year 2009-10 by a factor of 3.0 at L1 to 3.3 at L2 sampling stations (Figures 2-4).
Levels of arsenic (As) are higher in the aquatic environment than in most areas as it is fairly water-soluble and may be washed out of arsenic bearing rocks[29]. Recently, the anthropogenic activities such as treatment of agricultural land with arsenical pesticides, treating of wood using chromated copper arsenate, burning of coal in thermal plants power stations and the operations of gold-mining have increased the environmental pervasiveness of As and its rate of discharge into freshwater habitat[30]. As can also interfere with the fish immune system by suppressing antibody production[31] as well as by lowering macrophage activity and maturation[32]. Several studies are reporting As induced liver fibrosis, hepatocellular damage, inflammation, focal necrosis in addition to hepatocellular carcinoma[33-35]. In the present investigation it was observed that As concentration at L1, L2 and L3 sampling stations lies in the range of 7-113, 20-383 and 19-439 µg/L respectively. The biyearly average As concentration was found to be 40, 121 and 141 µg/L respectively at different sampling stations (Table 1). It was also observed that the average As concentration for assessment year 2010-11 was higher than that obtained for the assessment year 2009-10 by a factor of 3.9 at L3 to 4.0 at L1 and L2 sampling stations (Figures 2-4).
Cadmium (Cd) is typically a metal of the 20 th century, and is mainly used in rechargeable batteries and for the production of special alloys. It was the outbreak of the Itai-Itai bone disease in Japan in the 1960s that really drew the attention of the public and regulatory bodies to this heavy metal that had been discharged in the environment at an uncontrolled rate for more than one century. Although emissions in the environment have markedly declined in most industrialized countries, Cd remains a source of concern for populations living in polluted areas, especially in less developed countries[36]. Cd dispersed in the environment can persist in soils and sediments for decades. When taken up by plants, Cd concentrates along the food chain and ultimately accumulates in the body of people eating contaminated foods. By far, the most salient toxicological property of Cd is its exceptionally long half-life in the human body. Once absorbed, Cd irreversibly accumulates in the human body, in particularly in kidneys[37], the bone, the respiratory tract[38] and other vital organs such the lungs or the liver. In addition to its extraordinary cumulative properties, Cd is also a highly toxic metal that can disrupt a number of biological systems, usually at doses that are much lower than most toxic metals[39-41]. In the present investigation it was observed that Cd concentration at L1, L2 and L3 sampling stations lies in the range of 3-100, 4-110 and 1-223 µg/L respectively. The biyearly average Cd concentration was found to be 40, 34 and 72 µg/L respectively at different sampling stations (Table 1). It was also observed that the average Cd concentration for assessment year 2010-11 was higher than that obtained for the assessment year 2009-10 by a factor of 5.1 at L1 to 5.7 at L2 sampling stations (Figures 2-4).
Chromium (Cr) is one of the most common skin sensitizers and often causes skin sensitizing effect in the general public. A possible source of chromium exposure is waste dumps for chromate-producing plants causing local air or water pollution. Penetration of the skin will cause painless erosive ulceration (“chrome holes”) with delayed healing. These commonly occur on the fingers, knuckles, and forearms. The characteristic chrome sore begins as a papule, forming an ulcer with raised hard edges. Ulcers can penetrate deep into soft tissue or become the sites of secondary infection, but are not known to lead to malignancy[42]. Besides the lungs and intestinal tract, the liver and kidney are often target organs for chromate toxicity[43]. In the present investigation it was observed that Cr concentration at L1, L2 and L3 sampling stations lies in the range of 9-212, 6-414 and 16-455 µg/L respectively. The biyearly average Cr concentration was found to be 79, 115 and 141 µg/L respectively at different sampling stations (Table 1). It was also observed that the average Cr concentration for assessment year 2010-11 was higher than that obtained for the assessment year 2009-10 by a factor of 1.94 at L3 to 2.30 at L2 sampling stations (Figures 2-4).
Mercury (Hg) poisoning has become a problem of current interest as a result of environmental pollution on a global scale. High concentration of Hg, which could pose an ecological hazard, leading to contamination of plants, aquatic resources and bioaccumulation in the food chain[44]. Although elemental mercury is relatively innocuous and non-toxic, it can be converted to organomercurials, which are particularly toxic and are retained in the cells of plants and living organisms. Bodaly et al.[45] have reported that treated sewage water discharged into rivers and similar water bodies could result in an appreciable increase in the build up of alkyl mercury. Further reports by Tanaka[46] and Goldstone et al.[47] have dwelt on the natural alkylation of total Hg in waste water and water bodies. In the present investigation it was observed that Hg concentration at L1, L2 and L3 sampling stations lies in the range of 8-281, 5-60 and 3-31 µg/L respectively. The biyearly average Hg concentration was found to be 57, 18 and 15 µg/L respectively at different sampling stations (Table 1). It was also observed that the average Hg concentration for assessment year 2010-11 was higher than that obtained for the assessment year 2009-10 by a factor of 1.38 at L3 to 2.89 at L2 sampling stations (Figures 2-4).
Nickel (Ni) and nickel compounds have many industrial and commercial uses, and the progress of industrialization has led to increased emission of pollutants into ecosystems. Ni is a nutritionally essential trace metal for at least several animal species, micro-organisms and plants, and therefore either deficiency or toxicity symptoms can occur when, respectively, too little or too much Ni is taken up. Although a number of cellular effects of nickel have been documented, a deficiency state in humans has not been described[48-50]. Although Ni is omnipresent and is vital for the function of many organisms, concentrations in some areas from both anthropogenic release and naturally varying levels may be toxic to living organisms[50-52]. Ni compounds have been well established as carcinogenic in many animal species and by many modes of human exposure but their underlying mechanisms are still not fully understood[53, 54]. Ni can cause cancer of the lungs and nasal passages. The most common effect of nickel exposure is an allergic reaction. Approximately 10-15% of the population is sensitive to nickel. The most common reaction is a rash at the site of contact. Less frequently, some people that are sensitive to nickel suffer asthma attacks after exposure. Some workers exposed to high levels of Ni have developed chronic bronchitis and changes to their lungs. In the present investigation it was observed that Ni concentration at L1, L2 and L3 sampling stations lies in the range of 16-539, 9-132 and 17-607 µg/L respectively. The biyearly average Ni concentration was found to be 262, 54 and 304 µg/L respectively at different sampling stations (Table 1). It was also observed that the average Ni concentration for assessment year 2010-11 was higher than that obtained for the assessment year 2009-10 by a factor of 1.36 at L3 to 1.82 at L2 sampling stations (Figures 2-4).
Ecological and toxicological aspects of lead (Pb) and its compounds in the environment have been extensively reviewed[55-63]. There is agreement by all authorities on five points. First, Pb is ubiquitous and is a characteristic trace constituent in rocks, soils, water, plants, animals, and air. Second, more than 4 million metric tons of Pb is produced worldwide each year, mostly for the manufacture of storage batteries, gasoline additives, pigments, alloys, and ammunition. The widespread broadcasting of Pb through anthropogenic activities, especially during the past 40 years, has resulted in an increase in Pb residues throughout the environment-an increase that has dislocated the equilibrium of the biogeochemical cycle of Pb. Third, Pb is neither essential nor beneficial to living organisms; all existing data show that its metabolic effects are adverse. Fourth, Pb is toxic in most of its chemical forms and can be incorporated into the body by inhalation, ingestion, dermal absorption, and placental transfer to the foetus. Fifth, Pb is an accumulative metabolic poison that affects behaviour, as well as the hematopoietic, vascular, nervous, renal, and reproductive systems. In the present investigation it was observed that Pb concentration at L1, L2 and L3 sampling stations lies in the range of 25-247, 50-159 and 27-755 µg/L respectively. The biyearly average Pb concentration was found to be 160, 91 and 354 µg/L respectively at different sampling stations (Table 1). It was also observed that the average Pb concentration for assessment year 2010-11 was higher than that obtained for the assessment year 2009-10 by a factor of 1.45 at L2 to 1.97 at L3 sampling stations (Figures 2-4).
Strontium (Sr) compounds that are water-insoluble can become water-soluble, as a result of chemical reactions. The water-soluble compounds are a greater threat to human health than the water-insoluble ones. Therefore, water- soluble forms of Sr have the opportunity to pollute aquatic environment. For children exceeded strontium uptake may be a health risk, because it can cause problems with bone growth. In the present investigation it was observed that Sr concentration at L1, L2 and L3 sampling stations lies in the range of 4-214, 5-291 and 8-244 µg/L respectively. The biyearly average Sr concentration was found to be 94, 124 and 110 µg/L respectively at different sampling stations (Table 1). It was also observed that the average Sr concentration for assessment year 2010-11 was higher than that obtained for the assessment year 2009-10 by a factor of 2.16 at L3 to 3.30 at L1 sampling stations (Figures 2-4).
Manganese (Mn) is one out of three toxic essential trace elements, which means that it is not only necessary for humans to survive, but it is also toxic when too high concentrations are present in a human body. Excess manganese interferes with the absorption of dietary iron. Long-term exposure to excess levels may result in iron-deficiency anaemia. Increased manganese intake impairs the activity of copper metallo-enzymes. The presence of manganese in drinking water supplies may be objectionable for a number of reasons unrelated to health. At concentrations exceeding 0.15 mg/L, manganese stains plumbing fixtures and laundry and causes undesirable tastes in beverages[64]. Oxidation of manganese ions in solution results in precipitation of manganese oxides and incrustation problems. Even at concentrations of approximately 0.02 mg/L, manganese may form coatings on water distribution pipes that may slough off as black precipitates[65]. The growth of certain nuisance organisms is also supported by manganese[64,66]. The presence of "manganese" bacteria, which concentrate manganese, may give rise to taste, odour and turbidity problems in the distributed water. Highly toxic concentrations of manganese in soils can cause swelling of cell walls, withering of leafs and brown spots on leaves. In the present investigation it was observed that Mn concentration at L1, L2 and L3 sampling stations lies in the range of 6-231, 3-239 and 16-175 µg/L respectively. The biyearly average Mn concentration was found to be 111, 94 and 92 µg/L respectively at different sampling stations (Table 1). It was also observed that the average Mn concentration for assessment year 2010-11 was higher than that obtained for the assessment year 2009-10 by a factor of 1.36 at L3 to 2.62 at L2 sampling stations (Figures 2-4).

4. Conclusions

Although in India the Central Pollution Control Board (CPCB) is responsible for restoration and maintaining the wholesomeness of aquatic resources under Water Prevention and Control of Pollution Act 1974 passed by Indian Parliament, it is expected that to maintained or restored the water quality at desired level it is important to have monitoring on regular basis. Also to address water quality related environmental problems, it is must to have accurate information and to know precisely what the problem is, where it is occurring, how serious it is, and what is causing it. Such information is necessary for determining cost effective and lasting solutions to water related problems. Hence it is expected that the regular water quality monitoring study as performed in the present investigation will help in understanding the water quality trends over a period of time and prioritising pollution control efforts. The present study will also be useful to assess assimilative capacity of a water body thereby reducing cost on pollution control; to assess the fitness of water for different uses.

ACKNOWLEDGEMENTS

The authors are thankful to SAP Productions for developing and maintaining the paper template.

References

[1]  Storelli, M. M., Storelli, A., D’Addabbo, R., Marano, C., Bruno, R., and Marcotrigiano, G. O.,2005, Trace elements in loggerhead turtles (Caretta caretta) from the eastern Mediterranean Sea: Overview and evaluation. Environ. Pollut., 135(1), 163–170.
[2]  Phillips, D.J.H., 1995, The chemistries and environmental fates of trace metals and organochlorines in aquatic ecosystems, Mar. Pollut. Bull., 31(4-12),193-200.
[3]  Sprenger, M., and McIntosh, A., 1989, Relationship between concentrations of aluminium, cadmium, lead and zinc in water, sediments and aquatic macrophytes in six acidic lakes, Arch. Environ. Contam. Toxicol., 18(1-2)225-231.
[4]  Nieboer, E., and Richardson, D.H.S., 1980, The replacement of the nondescript term “heavy metals” by the biologically and chemically significant classification of metal ions. Environ. Pollut., B1:3-26.
[5]  Nriagu, J.O., and Pacyna, J.M., 1988, Quantitative assessment of worldwide contamination of air, water and soils by trace metals. Nature 333(6169), 134-139.
[6]  Harikumar, P. S., Nasir, U. P., and MujeebuRahman, M. P., 2009, Distribution of heavy metals in the core sediments of a tropical wetland system. Int. J. Environ. Sci. Tech., 6 (2), 225 -232.
[7]  Akcay, H., Oguz, A., and Karapire, C., 2003, Study of heavy metal pollution and speciation in Buyak Menderes and Gediz river sediments. Water Res., 37(4), 813-822.
[8]  Abdel-Ghani, N. T., and Elchaghaby, G. A., 2007, Influence of operating conditions on the removal of Cu, Zn, Cd and Pb ions from waste water by adsorption. Int. J. Environ. Sci.Tech., c4(4), 451 -456.
[9]  Nicolau, R., Galera, C. A., and Lucas, Y., 2006, Transfer of nutrients and labile metals from the continent to the sea by a small Mediterranean river, Chemosphere, 63 (3), 469 - 476.
[10]  Nakamura, K., Tockner, K., and Amano, K. 2006, River and wetland restoration: lessons from Japan, Bioscience, 56(5), 419-429.
[11]  Hirsch, R.M., Hamilton, P.A., and Miller, T.L., 2006, U.S. Geological Survey perspective on water-quality monitoring and assessment. Journal of Environmental Monitoring 8(5),512-518.
[12]  Modak, D.M, Singh, K.P., Ahmed, S., and Ray, P.K., 1990, Trace metal ion in Ganga water system. Chemosphere, 21 (1-2):275–87.
[13]  Rajaram, T., and Das, A., 2008, Water pollution by industrial effluents in India: discharge scenarios and case for participatory ecosystem specific local regulation. Futures, 40(1):56–69.
[14]  Lokhande,R.S., Singare, P.U., and Pimple, D.S., 2011, Toxicity Study of Heavy Metals Pollutants in Waste Water Effluent Samples Collected From Taloja Industrial Estate of Mumbai, India, Resources and Environment, 1(1): 13-19.
[15]  Lokhande, R.S., Singare, P.U., and Pimple, D.S., 2011, Quantification Study of Toxic Heavy Metals Pollutants in Sediment Samples Collected from Kasardi River Flowing along the Taloja Industrial Area of Mumbai, India, The New York Science Journal 4(9), 66-71.
[16]  Singare, P.U., 2011, Distribution Behaviour of Trace and Toxic Metals in Soil and Sediment along the Thane Creek Near Mumbai, India Interdisciplinary Environmental Review, 12(4), 298–312.
[17]  Singare, P.U., Lokhande, R.S., and Bhanage, S.V., 2011, Study of water pollution due to Heavy metals in Kukshet lakes of Nerul, Navi Mumbai, India, International Journal of Global Environmental Issues, 11(1), 79–90.
[18]  Singare, P.U., Lokhande, R.S., and Jagtap, A.G., 2011, Water pollution by discharge effluents from Gove Industrial Area of Maharashtra, India: Dispersion of heavy metals and their Toxic effects, International Journal of Global Environmental Issues, 11(1), 28–36.
[19]  Singare, P.U., Lokhande, R.S., and Pathak, P.P., 2010, Study on Physico-Chemical properties and Heavy Metal Content of the Soil Samples from Thane Creek of Maharashtra, India, Interdisciplinary Environmental Review, 11(1), 38-56.
[20]  Singare, P.U., Lokhande, R.S., and Naik, K.U., 2010, A Case Study of Some Lakes Located at and Around Thane City of Maharashtra, India, with Special Reference to Physico-Chemical Properties and Heavy Metal content of Lake Water, Interdisciplinary Environmental Review, 11(1), 90-107.
[21]  Klean Environmental Consultants Pvt. Ltd., Mumbai, Survey Report on Mithi River Water Pollution and Recommendations for its Control’, Report Submitted To Maharashtra Pollution Control Board (MPCB), Mumbai. Ref.No.0407/Mpcb Mithi River Survey/ 109, July 10, 2004.
[22]  Singare, P.U., Lokhande, R.S., and Bhattacharjee, S.S., 2013, Analysis of the Heavy metal Pollutants in Sediment Samples collected from Thane Creek of Maharashtra, India, International Journal of Sustainable Society, 5(3), 296-308.
[23]  Clesceri, L.S., 1998, Standard methods for the examination of Water and waste water’, in E. Arnold, Greenbergy, A.D.Eaton,(Eds.): Collection and Preservation of Samples And Metals, pp.1–27, pp.1–35, pp.3–1, pp.3–21, APHA, AWWA, WEF, Washington DC.
[24]  Paar, A., 1998, Microwave Sample Preparation System’ –Instruction Handbook, p.128, Anton Paar GmbH, Austria.
[25]  Sachdev, S.L., and West, P.W., 1970, Concentration of trace metals by solvent extraction and their determination by atomic absorption spectrophotometer’, Environmental Science & Technology, 4(9), 749–751.
[26]  Chen, M., and Ma, L.Q., 2001, Comparison of three aqua regia digestion methods for twenty florida soils, Soil Science Society of American Journal, 65(2), 491–499.
[27]  McCahon, C.P., and Pascoe, D., 1989, Short-term experimental acidification of a Welsh stream: toxicity of different forms of aluminium at low pH to fish and invertebrates, Arch. Environ. Contam. Toxicol., 18(1-2):233-242.
[28]  Verbost, P.M., Lafeber, F.P., Spanings, F.A., Aarden, E.M., and Wendelaar Bonga, S.E., 1992, Inhibition of Ca2+ uptake in freshwater carp, Cyprinus carpio, during short-term exposure to aluminum. J. Exp. Zool., 262(3):247-54.
[29]  Edmonds, J.S., and Francesconi, K.A., 1993, Arsenic in sea foods: human health aspect and regulations. Marine Pollut., 26(12), 665-674.
[30]  Pacyna, J.M., Scholtz, M.T., and Li, Y.F., 1995, Global budgets of trace metal sources. Environ. Rev., 3(2), 145-159.
[31]  Gosh, D., Datta, S., Bhattacharya, S. and Mazumder, S., 2007, Long-term exposure to arsenic affects head kidney and impairs humral immune responses of Clarias batrachus, Aquat. Toxicol., 81(1), 79-89.
[32]  Gosh, D., Datta, S., Bhattacharya, S., and Mazumder, S., 2006, Perturbation in the catfish immune responses by arsenic: organ and cell specific effects. Comp. Biochem. Physiol., 143C: 455-463.
[33]  Liu, S.X., Athar, M., Lippai, I., Waldren, C., and Hei, T.K., 2001, Introduction of oxyradicals by arsenic, implication for mechanism of genotoxicity. Proc. Nat. Acad. Sci. USA, 98(4), 1643-1648.
[34]  ATSDR, 2002, Interaction profiles for arsenic. Agency for toxic substances and disease registry. SUDHHS, PHS, Washington, DC.
[35]  Datta, S., Saha, D.R., Gosh, D., Majumdar, T., Bhattacharya, S., and Mazumder, S., 2007, Sub-lethal concentration of arsenic interferes with the proliferation of hepatocytes and induces in vivo apoptosis in Clarias batrachus L., Comp. Biochem. Physiol. Part C, 145(3), 339-349.
[36]  Sethi, P.K., Khandelwal, D.J., and Sethi, N., 2006, Cadmium exposure: Health hazards of silver cottage industry in developing countries, J. Med. Toxicol., 2(1), 14-15.
[37]  Johri, N., Jacquillet, G., and Unwin, R., 2010, Heavy metal poisoning: the effects of cadmium on the kidney, BioMetals, 23(5), pp. 783-792.
[38]  Bernard, A., and Lauwerys, R., 1986, Effects of cadmium exposure in humans. In: Handbook of experimental pharmacology, Foulkes, E.C., editors Berlin: Springer-Verlag, p. 135-177.
[39]  Nordberg, G., Nogawa, K., Nordberg, M., and Friberg, L., 2007, Cadmium. In: Handbook on toxicology of metals. Nordberg, G., Fowler, B., Nordberg, M., and Friberg, L., editors New York: Academic Press, p. 65-78.
[40]  Bernard, A., 2004, Renal dysfunction induced by cadmium: biomarkers of critical effects, Biometals, 17(5), 519-523.
[41]  Godt, J., Scheidig, F., Siestrup, C.G., Esche, V., Brandenburg, P., Reich, A., Groneberg, D.A., 2006, The toxicity of cadmium and resulting hazards for human health. J. Occup. Med. Toxicol., 1, 22.
[42]  Geller, R., 2001, "Chromium." In:Clinical Environmental Health and Toxic Exposures. Sullivan, JB, Jr. and Krieger, GR, editors. 2nd Ed. Lippincott Williams & Wilkins, Philadelphia, PA.
[43]  Rom, W. N., 2007, Environmental and Occupational Medicine. 4th Ed. 2007 by Lippincott Williams & Wilkins.
[44]  Favretto, L., Campisi, B., Reisenhofer, E., and Adami, G., 1997, Sewage pollution, Anal. Chim. Acta, 344(3), 251–259.
[45]  Bodaly, R. A., Rudd, W. M., and Flett, R. J., 1998, Effect of urban sewage treatment on total and methyl mercury concentrations in effluents, Biogeochemistry, 40(2-3), 279–291.
[46]  Tanaka, K., 1977, Photochemical alkylation of inorganic mercury in sewage treatment plant waste waters, Kanagawa-ken Kogai Senta Nenpo 10(1), 198–201.
[47]  Goldstone, M. E., Atkinson, C., Kirk, P. W.W., and Lester, J. N., 1990, The behaviour of heavy metals during waste water treatment, Science of the Total Environment, 95(1), 271–294.
[48]  Barceloux, D.G., 1999, Nickel, Clin. Toxicol. 37(2), 239-258.
[49]  Uthus, E.O., and Poellot, R.A., 1996, Dietary folate affects the response of rats to nickel deprivation, Biol. Trace Elem. Res., 52(1), 23-35.
[50]  Scott-Fordsmand, J.J., 1997, Toxicity of nickel to soil organisms in Denmark, Rev. Environ. Contam. Toxicol., 148(1), 1-34.
[51]  Haber, L.T., Erdreicht, L., Diamond, G.L., Maier, A.M., Ratney, R., Zhao, Q., and Dourson, M.l., 2000, Hazard identification and dose response of inhaled nickel-soluble salts, Regul. Toxicol. Pharmacol. 31(2), 210-230.
[52]  Diagomanolin, V., Farhang, M., Ghazi-Khansari, M., and Jafarzadeh, N., 2004, Heavy metals (Ni, Cr, Cu) in the Karoon waterway river, Iran, Toxicol. Lett., 151 (1), 63-67.
[53]  Clayton, G.D., and Clayton, F.E., 1994, Patty’s Industrial Hygiene Toxicology, 4th ed.; A Wiley-Interscience publication: New york, pp. 2157-2173.
[54]  Chang, l.W., 1996, Toxicology of Metals; Lewis publishers: New york, pp. 245-246.
[55]  Eisler, R., 1981, Trace metal concentrations in marine organisms. Pergamon Press, New York. pp.687.
[56]  Harrison, R.M., and Laxen, D.P.H., 1981, Lead pollution. Causes and control. Chapman and Hall, New York. pp.168.
[57]  Demayo, A., Taylor, M.C., Taylor, K.W., and Hodson, P.V., 1982, Toxic effects of lead and lead compounds on human health, aquatic life, wildlife plants, and livestock, CRC Crit. Rev. Environ. Control, 12(4), 257-305.
[58]  Mudge, G.P., 1983, The incidence and significance of ingested lead pellet poisoning in British Wildfowl, Biol. Conserve., 27(4), 333-372.
[59]  De Michele, S.J., 1984, Nutrition of lead. Comp. Biochem. Physiol., 78A:401-408.
[60]  Walsh, T.J., and Tilson, H.A., 1984, Neurobehaviorial toxicology of the organoleads, NeuroToxicology, 5(1), 67-86.
[61]  Lansdown, R., and Yule, W., (eds.),1986, Lead toxicity. History and environmental impact. Johns Hopkins Univ. Press, Baltimore, Maryland. pp.286.
[62]  McDonald, L.J., 1986, Suspected lead poisoning in an Amazon Parrot, Can. Vet. J., 27(3), 131-134.
[63]  MacDonald, J.W., Randall, C.J., Ross, H.M., Moon, G.M., and Ruthven, A.D., 1983, Lead poisoning in captive birds of prey, Vet. Rec., 113(3), 65-66.
[64]  Griffin, A.E., 1960, Significance and removal of manganese in water supplies. J. Am. Water Works Assoc., 52(10), 1326-1334.
[65]  Bean, E.L., 1974, Potable water-quality goals, J. Am. Water Works Assoc., 66(4), 221-230.
[66]  Wolfe, R.S., 1960, Microbial concentration of Iron and Manganese in Water with Low Concentrations of These Elements, J. Am. Water Works Assoc., 52(10), 1335-1337.