-
Paper Information
- Next Paper
- Paper Submission
-
Journal Information
- About This Journal
- Editorial Board
- Current Issue
- Archive
- Author Guidelines
- Contact Us
Frontiers in Science
p-ISSN: 2166-6083 e-ISSN: 2166-6113
2012; 2(1): 1-5
doi: 10.5923/j.fs.20120201.01
Dependence of Time Derivative of Horizontal Geomagnetic Field on Sunspot Number and aa Index
 Abstract
 Reference
 Full-Text PDF
 Full-Text HTML
1Department of Physics, Tai Solarin University of Education, Ijebu, Ode, Nigeria
2Department of Physics, Federal University of Technology, Akure, Nigeria
Correspondence to: Falayi E. O. , Department of Physics, Tai Solarin University of Education, Ijebu, Ode, Nigeria.
| Email: |  |
Copyright © 2012 Scientific & Academic Publishing. All Rights Reserved.
This work investigated the interrelationship between the monthly means of time derivatives of horizontal geomagnetic field (dH/dt), sunspot number (Rz) and aa index for period of substorms (-90nT-1800nT) during the years 1990-2009. 232 substorms were identified during the period of study. Time derivative of horizontal geomagnetic field (dH/dt) used as proxy for geomagnetic induced current (GIC), exhibited high positive correlation with sunspot number (0.86) and aa index (0.8998). 92.665% of the obtained geomagnetic activity is explicable by the combined effect of sunspot number aa index. The distribution of substorms as a function of years, gives a strong support for the existence of geomagnetic activity increases which implies that as the sunspot number increases the base level of geomagnetic activity increases.
Keywords: Solar Activity, Time Derivatives of Geomagnetic Fields, Sunspot Number, Substorms
Cite this paper: Falayi E. O. , Rabiu A. B. , "Dependence of Time Derivative of Horizontal Geomagnetic Field on Sunspot Number and aa Index", Frontiers in Science, Vol. 2 No. 1, 2012, pp. 1-5. doi: 10.5923/j.fs.20120201.01.
Article Outline
1. Introduction
- The Sun is the source of the solar wind disturbance that drives geomagnetic activity and thus it seems that solar activity should predict geomagnetic activity. However, geomagnetic activity near the time of minimum solar has proved to be reliable predictor for future solar activity (Hathaway and Wilson, 2006a). Solar eruptions such as flares, filament eruptions and coronal mass ejections are active producers of geomagnetic activity. Geomagnetic activity is generated by the interaction between the solar wind and the magnetosphere. Many features of the geomagnetic and solar activity have been discovered by spectral and statistical analysis of the uninterrupted time series of indices. We are specifically interested in the past evolution of sunspot activity. Sunspots lie at the heart of solar active regions and trace the emergence of large‐scale magnetic flux, which is responsible for the various phenomena of solar activity. Consequently, sunspots are good tracer for solar magnetic activity, particularly so during times of medium to high activity. The frequency of these eruptions rises and falls with the solar activity cycle as indicated by the number of sunspots. Sunspot number Rz is commonly considered an appropriate and reliable index of solar variability. These eruptions represent the solar cycle component of geomagnetic activity as described by Feynman (1982). The prediction of solar activity is important for the studies of solar terrestrial environment and research of some natural disasters. Geomagnetic activity close to the period of sunspot minimum is a good indicator for the level of maximum activity during solar cycle. Moreover, not only solar activity related to sunspots causes geomagnetic activity, but also high speed streams (e.g. Borovski and Denton, 2006; Diego et al., 2010).Measurements of geomagnetic variation have been undertaken since 1840. The measurements help to quantify the influence of solar disturbances on the Earth’s magnetic field. One of the geomagnetic indices is the aa, which uses data from antipodal magnetic observatories to describe the level of geomagnetic activity. The aa index has been retrospectively calculated from 1868 (Mayaud, 1973) and provide one of the longest continuous data sets which can be used in the analysis of magnetospheric and ionospheric phenomenology. Geomagnetic activity is among the most important parameters to study the long-term change in the Sun, hemisphere and near Earth space. The aa range index provides a quantitative, homogeneous and reliable series with a 3 hour resolution. The homogeneity of the aa index allows for comparison of remote time intervals and studies of long-term variations of geomagnetic activity. Feynman (1982) suggested that the geomagnetic activity indicated by the index aa could be divided into two components; one in phase and proportional to the solar activity cycle while the second component coupled with interplanetary disturbances which is out of phase with the activity cycle. It was observed that the second, interplanetary component often peaks just before solar activity minimum and has been shown to be an even better indicator for the amplitude of the following cycle (Hathaway et al., 1999).On the ground, the current are observed as variation of the local geomagnetic field (Nishida, 1978). The effects of geomagnetic activity are observed on technological systems, power grids, pipelines, telegraph lines (Boteler, et al., 1998 and Viljanen et al., 2001) and referred to as geomagnetically induced currents (GIC). Statistical analyses of GIC and the time derivative of the horizontal ground magnetic field (denoted as dH/dt), a quantity closely coupled to GIC through the basic fundamentals of Faraday’s law of induction, has been established by Viljanen et al. (2001, 2006), Weigel et al. (2002), Wintoft (2005), and Pulkkinen et al. (2005). Also, computing the geoelectric field from the measured ground geomagnetic field offers a statistical estimation of the likely occurrence of GIC in a particular system or region. Boteler (2001) showed that there is a good linear relationship between the 3‐h Kp index and the logarithms of the ground electric field. The electric field is calculated from magnetic field by assuming an equivalent ionospheric current system such that the geomagnetic variations at the Earth surface can be explained by horizontal divergence free ionospheric currents (Viljanen et al., 2003). The geoelectric field is always associated with a temporally varying geomagnetic field. This means that the time derivative of the ground magnetic field (dB/dt) characterizes GIC activity. Therefore, the horizontal component of the vector (dH/dt) is the relevant quantity. Also strong concentration of large dH/dt vectors to the east–west direction in the morning, transverse to the simultaneous main flow of ionospheric currents to the west. This may be related to the pulsation activity, and would require an investigation of small period variations binned according to the dH/dt level and to examine the characteristics of the electric field at the surface of the Earth. This present work examines the interrelation between the time derivatives of horizontal geomagnetic field (dH/dt), and each of solar activity and geomagnetic activity during high level of geomagnetic activity from 1990-2009. Sunspot number is employed as a measure of solar activity while aa index is used a proxy of geomagnetic activity. In this work dH/dt is a reflection of geomagnetically induced current (GIC) (Viljanen et al., 2001).
2. Data Analysis
- The data engaged in this research include Dst values, sunspot number, aa index and horizontal geomagnetic field component H values for all the months of the years 1990-2009. The data was limited to period of geomagnetic activity level when Dst takes values between -90nT and -1800nT. This activity level defines substorm events and 232 of such events were identified during the period of the study, 1990-2009. The Dst index data were provided by World Data Center for Geomagnetism at Kyoto University (WDC). The aa index and the horizontal geomagnetic field component were measured at UK geomagnetic observatories, situated at Lerwick (60°09'N, 01°09'W). International sunspot number (ISSN) data were taken from the National Geophysical Data Center. H is the vector of a geomagnetic disturbance in the horizontal plane, it is obtained from
 . GICs (Geomagnetically induced currents) are driven by the horizontal electric field induced at the Earth’s surface due to time-varying or fast-moving strongly inhomogeneous ionospheric current systems and affected by the Earth’s conductivity structure. Close correlation between GIC and the time derivative of the magnetic field (dH/dt) which has been demonstrated by Viljanen (1998) and Viljanen et al. (2001). We obtained the time derivative of the ground horizontal magnetic field (dH/dt =
 ) to give a reasonable measure of the induction or GIC activity (Viljanen et al., 2001). The monthly mean values of the time derivative of geomagnetic field (dH/dt) for 232 events were also examined. The time variation of the frequency occurrence of substorm according to each index is shown in Figure 1.
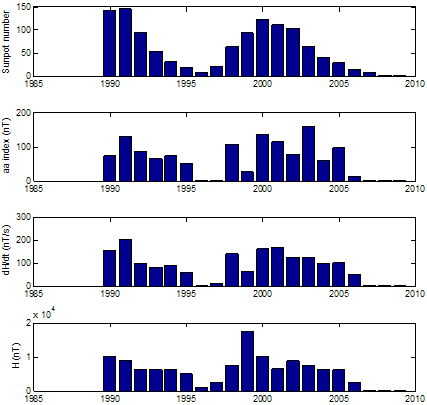 | Figure 1. Comparison of yearly averages of Sunspot number, aa index, dH/dt and H from 1990-2009 |
 | (1) |
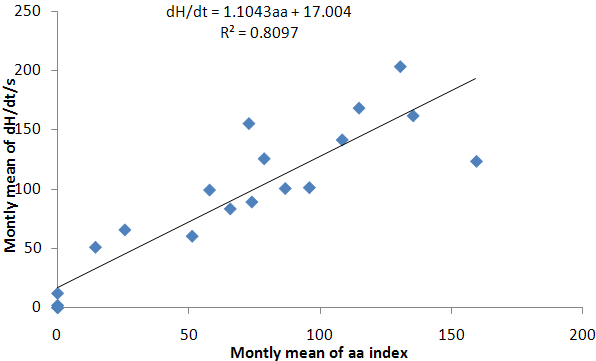 | Figure 2. Monthly mean of dH/dt versus the month mean of aa index from 1990-2009 |
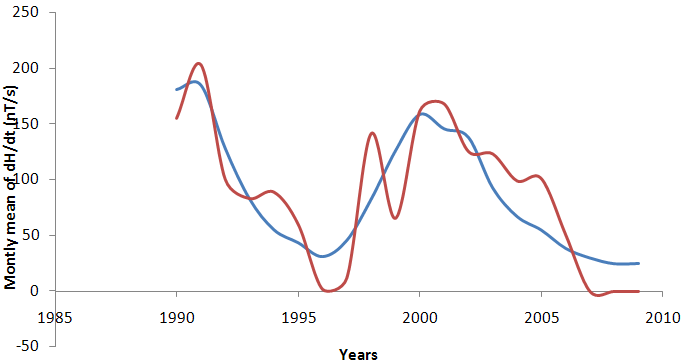
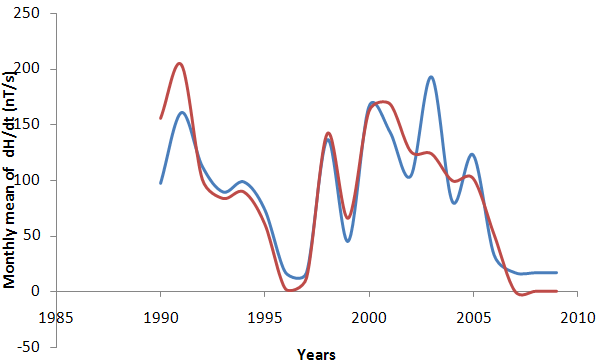 | Figure 3. Reconstructed monthly mean dH/dt predicted (blue) and monthly mean dH/dt observed (red) from 1990-2009 |
 | (2) |
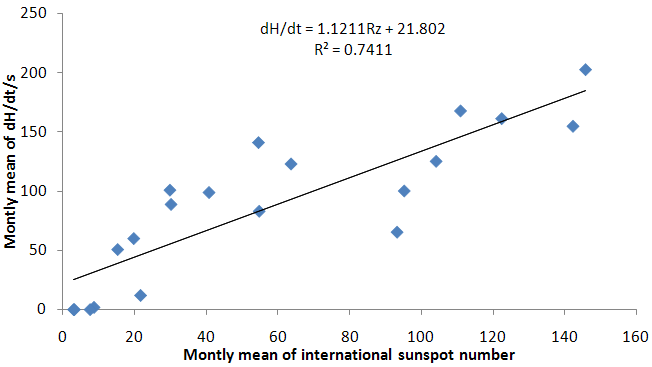 | Figure 4. Monthly means of dH/dt versus monthly mean of internation sunspot number (Rz) from 1990-2009 |
 | Figure 5. Reconstructed monthly mean dH/dt predicted (blue) and monthly mean dH/dt observed (red) from 1990-2009 |
 | (3) |
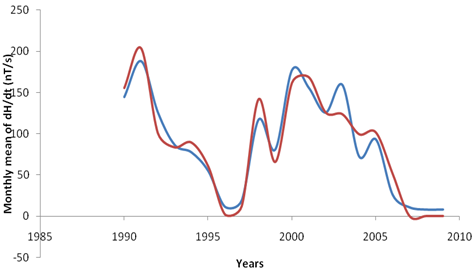 | Figure 6. Reconstructed monthly mean dH/dt predicted (blue) and monthly mean dH/dt observed (red) from 1990-2009 |
3. Discussion of Results
- The geomagnetic activity is one of the signatures of the Earth’s magnetosphere forcing by the solar wind, and it is now well accepted that long data series of geomagnetic indices provide efficient tools for studying the past evolution of solar activity and of its impact on the Earth’s environment. Figure 1 presents, from top to bottom, the monthly means of aa index, sunspot number, dH/dt and H versus time for the time period under investigation. The occurrence of high geomagnetic activity and its coincidence with a high value of the induced electric fields shows that the aa index and the time derivatives of horizontal geomagnetic field reflect essentially the same geoelectromagnetic activity. High geomagnetic activity is obviously correlated with a high sunspot number. Feynman (1982) noted that as the sunspot number increases the level of geomagnetic activity increases as well, this means that the level of geomagnetic activity is proportional to the sunspot number. Thompson (1993) linked geomagnetic disturbance with solar maximum. It is reasonable to expect that occurrence of different levels of geomagnetic activity during the maxima phase of a solar cycle can be directly related to the sunspot maximum. Figure 1 also illustrates the distribution of substorms as a function of years, gives a strong support for the existence of geomagnetic activity increases which implies that as the sunspot number increases the base level of geomagnetic activity increases. In this study, we used the correlation coefficient and coefficient of determination. For the relation tested, these had values ranging from 0.8‐0.9 and 0.7‐0.9 for correlation coefficient and coefficient of determination respectively. Fig 2 revealed a positive linear relationship between monthly mean of dH/dt and aa index. The scatter plot plots of monthly mean of dH/dt and aa index yield linear slope of 1.104 (Eq. 1). The coefficient of determination of 0.8097 between dH/dt and aa index implies that 80.97% of dH/dt can be accounted for using aa index. Fig 4 also revealed a positive relationship between monthly mean of dH/dt and sunspot number (Rz) with linear slope of 1.1211 (Eq. 2). The coefficient of determination of 0.7411 between dH/dt and sunspot number implies that 74.11% of dH/dt can be accounted for using sunspot number (Rz).Equation (3) shows a positive linear relationship between monthly mean of dH/dt against aa index and sunspot number (Rz). The coefficient of determination are statistically very significant, with the stronger one being between the monthly mean of max dH/dt, sunspots number (Rz) and aa index. The trend line has a coefficient of determination R2 = 0.9265, implying that nearly 92.65% of the variance can be explained by the combination of sunspot number and aa index. The study compared the time derivative of the horizontal geomagnetic field with sunspot number and geomagnetic aa index. The occurrence of high geomagnetically induced electric fields and their coincidence with the phases of solar activity is less clear than that of maximum magnetic activity but it was shown that aa index and time derivative of horizontal geomagnetic field reflect essentially the same geoelectromagnetic activity which is, in turn, correlated well with the sunspot number (Figure 6). To get a good correspondence between observed and calculated time derivative of the horizontal geomagnetic field, the effective conductivity had to vary according to aa index. The classification according to time derivative of the horizontal geomagnetic field magnitude applied in the present paper seems remarkably. Linear regression dependencies between dH/dt, sunspots number and aa index show better correlation and more consistent coefficients for Eq. (3). This implies that a higher value of dH/dt may result to higher values of geoelectric field which may leads to geomagnetic field disturbance. Examining the correlation between time derivative of geomagnetic field and sunspot number we found a decrease in Eq. (2) in correlation compared to other Equations. Although sunspot numbers are quite suitable for characterizing solar activity, they may not always accurately reflect the overall intensity of solar eruptions, since not all sunspot groups are equally capable of producing powerful energetic events. Also not only solar eruptions are responsible for geomagnetic activity, particularly during the descending phase of the solar cycle when high speed streams are predominant.
4. Conclusions
- The sunspot number variation which reflects the changes in solar activity seems to have effect on the time derivatives of geomagnetic field, i.e. on the geoelectric activity. The occurrence of high geomagnetically induced electric fields and their coincidence with the phases of solar activity, dH/dt and aa index reflect essentially the same geoelectromagnetic activity which in turn correlated well with sunspot. The interrelationship between the monthly means of time derivatives of horizontal geomagnetic field (dH/dt), sunspot number (Rz) and aa index for period of substorms (-90nT-1800nT) during the years 1990-2009. 232 substorms were identified during the period of study. Time derivative of horizontal geomagnetic field (dH/dt) used as proxy for geomagnetic induced current (GIC), exhibited high positive correlation with sunspot number (0.86) and aa index (0.8998). 92.665% of the obtained geomagnetic activity is explicable by the combined effect of sunspot number aa index. The occurrence of severe storm intervals remains ever present, even during the solar minimum and ascending phases. This supports the known fact that significant geomagnetic storms capable of driving GIC can occur at any time during the solar cycle.
ACKNOWLEDGEMENTS
- The authors wish to acknowledge the British Geological Survey for geomagnetic field and aa index data, also World Data Center for Geomagnetism at Kyoto University for Dst data and international sunspot number (ISSN) data were taken from the National Geophysical Data Center.