Özlem Ege Oruç , Emel Kuruoglu, Aslı Gündüz
Department of Statistics, DEU. Faculty of Sciences, İzmir, 35160, Turkey
Correspondence to: Özlem Ege Oruç , Department of Statistics, DEU. Faculty of Sciences, İzmir, 35160, Turkey.
| Email: |  |
Copyright © 2012 Scientific & Academic Publishing. All Rights Reserved.
Abstract
This study shows an application of information theory in the field of survey scale. Based on customer satisfaction scale it is found out that according to the calculated entropy values, it is possible to reach the aimed information through fewer questions. In brief, the possibility of reaching the same information through fewer questions is shown.
Keywords:
Entropy, Relative Entropy (Kullback – Leibler Divergence), Joint Entropy, Conditional Entropy, Mutual Information, Survey, Scale, Customer Satisfaction
Cite this paper:
Özlem Ege Oruç , Emel Kuruoglu, Aslı Gündüz , "Entropy Applications for Customer Satisfaction Survey in Information Theory", Frontiers in Science, Vol. 1 No. 1, 2011, pp. 1-4. doi: 10.5923/j.fs.20110101.01.
1. Introduction
Information theory is the branch of mathematics that describes how uncertainty should be quantified, manipulated and represented. In information theory, entropy is a measure of the uncertainty associated with a random variable. The term by itself in this context usually refers to the Shannon entropy, which quantifies, in the sense of an expected value, the information contained in a message, usually in units such as bits. Equivalently, the Shannon entropy is a measure of the average information content one is missing when one does not know the value of the random variable. Ever since the fundamental premises of information theory were laid down by[1], it has had far reaching implications for almost every field of science and technology[2]. Information theory has also had an important role in survey scale studies[3].Surveys are used to collect quantitative information about items in a population. Developing a survey is as much an art as it is a science. In addition, just as an artist has a variety of different colors to choose from the palette, you have a variety of different question formats with which to question an accurate picture of your customers, clients and issues that are important to them. A good survey question should be short and straightforward[4]. Further it should not be too long. The scale used in survey is defined by a set of two or more survey items that cohere in terms of individual’s responses. A scale combines an individual’s responses to a number of survey items into one score.In this paper we apply information theoretic concept of entropy, to determine the number of questions in a selected scale. A scale that measures customer satisfaction is dealt with in this study[5,6]. By how many questions the intended information would be reached using this scale with the calculated entropy values was investigated.
2. Basic Concepts of Information Theory
Shannon entropy is a quantitative measure of uncertainty in a data set. This section briefly defines Shannon entropy, relative entropy (Kullback-Leibler Divergence), joint entropy and mutual information. Let X be a discrete random variable, taking a finite number of possible values x1, x2,…, xn with respective probabilities pi≥0 for i =1, 2…, n and  . The Shannon entropy H(X) is defined by
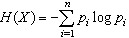 | (1) |
in the works[7], and[1]. The joint entropy measures how much entropy is contained in a joint system of two random variables. If the random variables are X and Y, the joint entropy H(X, Y ) given in[7] is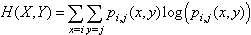 | (2) |
The mutual information of two random variables is a quantity that measures the mutual dependence of the two variables. The interpretation is that when mutual information is absent, marginal distributions are independent and their entropies add up to the total entropy. When mutual information is positive, marginal distributions are dependent as some combinations occur relatively more often than other combinations do, and marginal entropies exceed total entropy by an amount equal to the mutual information. Mutual information I is evaluated by the formula  | (3) |
The Kullback-Leibler divergence KL = D(p||q) is a non-commutative measure of the divergence between two probability distributions p and q. KL is also sometimes called the information gain about X if p is used instead of q. It is also called the relative entropy in using q in the place of p. The relative entropy is an appropriate measure of the similarity of the underlying distribution. It may be calculated from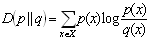 | (4) |
The properties of the relative entropy equation make it non-negative and it is zero if both distributions are equivalent namely p = q. The smaller the relative entropy is the more similar the distribution of the two variables and vice versa[8].
2.1. Application
A scale that measures customer satisfaction is dealt with in this study. The number of questions for intended information to be reached using this scale together with entropy values was investigated. The usual measures of customer satisfaction involve a survey with a set of statements using a likert technique or scale[10,11]. Scaling in this survey was examined under 4 subscales titles and the subscales were named “Marketing Services Assessment (MSA)”, “Operation Services Assessment (OSA)”, “Accounting Service Assessment (ASA)” and “General Assessment (GA)”[9]. First, the probability distribution tables were constructed by use of the answers given by the customers concerning the subscales of MSA, OSA, ASA and GA. By using these tables, the Shannon entropy, joint entropy, relative entropy and mutual information values were calculated.The survey was applied to 60 customers in order to measure customer satisfaction. It was composed of 18 questions and its Cronbach’s coefficient α was determined as α= 0.77 where n is the number of components,  is the variance of the observed total test scores and
  is the variance of component i. Each question was evaluated with 1 to 3 scores in such a way that it would be one of the scales of “bad, not bad – not good, good”. The attitude or information scores of the respondents of the survey was added separately and ordered. In addition, several subscales were determined for these 18 questions. The scaling included in the survey was examined under 4 subscale titles. The first subscale was mentioned in the literature as “Marketing Service Assessments” (MSA). The second is “Operation Service Assessments” (OSA), third is “Accounting Service Assessments” (ASA) and the final scale as “General Assessment” (GA). The subscale MSA was composed of a total of 5 questions, OSA was composed of a total of 7 questions whereas the subscale ASA had 3 questions and finally the subscale GA was composed of 3 questions.
3. Results and Discussion
The questions representing the subscales in the survey were determined separately and probability distribution tables were constructed separately for each subscale from the frequency values calculated considering the scores of the questions representing each subscale. Using these probability distribution tables, entropy values were computed for MSA, OSA, ASA and GA. With a view to examining what kind of entropy values the subscales of MSA, OSA, ASA and GA had with gender, joint probability distribution tables were constructed separately from the frequencies obtained from Gender – MSA, Gender – OSA, Gender – ASA and Gender – GA scores. The joint entropy values of all subscales and gender were calculated separately from the joint probability distribution tables constructed by means. Mutual information values were computed separately for all subscales and gender using the same joint probability distribution tables. 15 out of 60 customers undertaking the questionnaire were females and 45 of them were males. The subscales of MSA, OSA, ASA and GA were regarded as random variables in the study in order to compute the entropy values. The Shannon entropy values were calculated by using the probability distributions constructed for the random variables of MSA, OSA, ASA and GA. The frequencies, probabilities and entropy values of these random variables are given in Table 1. | Table 1. Frequency (f) and probability (P) table for the MSA, OSA, ASA and GA variables |
| | Score | MSA | OSA | ASA | GA | | f | P | f | P | f | P | f | P | | 1 | 17 | 0.06 | 39 | 0.10 | 5 | 0.03 | 16 | 0.09 | | 2 | 145 | 0.48 | 211 | 0.55 | 65 | 0.36 | 91 | 0.51 | | 3 | 138 | 0.46 | 132 | 0.35 | 110 | 0.61 | 73 | 0.41 | | Total | 300 | 1.00 | 382 | 1.00 | 180 | 1.00 | 180 | 1.00 | | Entropy | 1.26 | 1.34 | 1.11 | 1.34 |
|
|
| Table 2. Joint probability distribution of Gender – MSA, Gender – OSA Gender – ASA and Gender – GA |
| | Gender | MSA | | 1 | 2 | 3 | Total | | Male (0) | 0.043 | 0.360 | 0.347 | 0.750 | | Female (1) | 0.014 | 0.123 | 0.113 | 0.250 | | Total | 0.057 | 0.483 | 0.460 | 1.000 | | Gender | OSA | | 1 | 2 | 3 | Total | | Male (0) | 0.084 | 0.413 | 0.278 | 0.775 | | Female (1) | 0.010 | 0.115 | 0.100 | 0.225 | | Total | 0.094 | 0.528 | 0.378 | 1.000 | | Gender | ASA | | 1 | 2 | 3 | Total | | Male (0) | 0.022 | 0.283 | 0.444 | 0.749 | | Female (1) | 0.006 | 0.078 | 0.167 | 0.251 | | Total | 0.028 | 0.361 | 0.611 | 1.000 | | Gender | GA | | 1 | 2 | 3 | Total | | Male (0) | 0.083 | 0.372 | 0.295 | 0.750 | | Female (1) | 0.006 | 0.133 | 0.111 | 0.250 | | Total | 0.089 | 0.505 | 0.406 | 1.000 |
|
|
The entropy value 1.26 of MSA indicates that it is enough to ask two questions for MSA. Likewise, the entropy values found for OSA (1.34), ASA (1.11) and GA (1.31) also indicate that it would be sufficient to ask two questions in order to be informed to this end. In the scale applied, 5 questions were asked in order to be informed about MSA, 7 questions were asked in order to be informed about OSA, 3 questions were asked in order to be informed about ASA and 3 questions were asked in order to be informed about GA. As a consequence this part, it was sufficient to ask two questions so as to be informed about each of these variables.To investigate what kind of entropy values the variables of MSA, OSA, ASA and GA had with gender, joint probability distribution tables were constructed separately from the frequencies obtained from Gender – MSA, Gender-OSA, Gender – ASA and Gender – GA scores. Table 2 gives joint entropy values of all subscales and gender.Table 3 gives joint entropy values of all subscales and gender.| Table 3. Joint entropy for variables |
| | Variables | Joint Entropy | | MSA | 2.2529 | | OSA | 2.3274 | | ASA | 2.1077 | | GA | 2.3253 |
|
|
The result in the joint entropy H(X,Y) = 2.0644 with X = Gender and Y = MSA means that on average it would require two questions to guess the level of both variables. The same result is also valid for OSA, ASA and GA. | Table 4. Joint probability distribution for position and MSA, OSA, ASA and GA |
| | Position | MSA | | 1 | 2 | 3 | Total | | Management (0) | 0.037 | 0.227 | 0.220 | 0.484 | | Organisation (1) | 0.020 | 0.256 | 0.240 | 0.516 | | Total | 0.057 | 0.483 | 0.460 | 1.000 | | Position | OSA | | 1 | 2 | 3 | Total | | Management (0) | 0.038 | 0.267 | 0.179 | 0.484 | | Organisation (1) | 0.055 | 0.273 | 0.188 | 0.516 | | Total | 0.093 | 0.540 | 0.367 | 1.000 | | Position | ASA | | 1 | 2 | 3 | Total | | Management (0) | 0.011 | 0.172 | 0.300 | 0.483 | | Organisation (1) | 0.017 | 0.189 | 0.311 | 0.517 | | Total | 0.028 | 0.361 | 0.611 | 1.000 | | Position | GA | | 1 | 2 | 3 | Total | | Management (0) | 0.028 | 0.239 | 0.217 | 0.484 | | Organisation (1) | 0.061 | 0.267 | 0.188 | 0.516 | | Total | 0.089 | 0.506 | 0.405 | 1.000 |
|
|
29 out of 60 customers undertaking the questionnaire were working to management and 31 of them were working to organization. To investigate what kind of entropy values the variables of MSA, OSA, ASA and GA had with working position, joint probability distribution tables were constructed separately from the frequencies obtained from Position – MSA, Position – OSA, Position – ASA and Position – GA scores. Table 4 demonstrates Position– MSA joint probability distribution of Position– OSA, Position– ASA and Position– GA.| Table 5. Gives joint entropy values of all subscales and working position |
| | Variables | Joint Entropy | | MSA | 2.0644 | | OSA | 2.0998 | | ASA | 1.9192 | | GA | 2.1314 |
|
|
The result in the joint entropy H(X,Y) = 2.2529 with X = Position and Y = MSA means that on average it would require two questions to guess the level of both variables. The same result is also valid for OSA, ASA and GA.Mutual information values were computed gender -all subscales and position--all subscales. These values are given in Table 6.| Table 6. Mutual Information Values |
| | | PositionSubscales | GenderSubscales | | Variables | Mutual Information | Mutual Information | | MSA | 0.0063 | 0.0066 | | OSA | 0.0118 | 0.0512 | | ASA | 0.0015 | 0.0018 | | GA | 0.0739 | 0.0196 |
|
|
In probability theory and information theory, the mutual information or transformation, of two random variables is a quantity that measures the mutual dependence of the two variables. If X and Y are independent, then knowing X does not give any information about Y and vice versa, so their mutual information is zero. The mutual information value calculated for the MSA – Gender variables, which are not independent, can be interpreted as follows. The variables MSA and Gender seem not to have a lot of information in common, only 0.0066 bits of information. The mutual information values also found for OSA – Gender, ASA – Gender and GA – Gender are interpreted in the same way. Table 6 exhibits shared information between pairs of variables. The pair sharing the most information is OSA – Gender, while the least is ASA – Gender. The mutual information value calculated for the MSA – Position variables, which are not independent, can be interpreted as follows. The variables MSA and Gender seem not to have a lot of information in common, only 0.0063 bits of information. The mutual information values also found for OSA – Position, ASA – Position and GA – Position are interpreted in the same way. Table 6 exhibits shared information between pairs of variables. The pair sharing the most information is GA – Position, while the least is ASA – Position.The relative entropy is an appropriate measure of the similarity of the underlying distribution. If the distribution f and g are similar, the difference between D(f || g) and D(g || f) is small. In this study, the marginal probability distributions of both genders were found depending on each subscale. The marginal probability distribution of both genders for the subscale of MSA is given in Table 7.| Table 7. marginal probability distribution of male and female for MSA |
| | Organization (Y) | 1 | 2 | 3 | Total | | P(Y) | 0.039 | 0.496 | 0.465 | 1.000 | | Management (X) | 1 | 2 | 3 | Total | | P(X) | 0.076 | 0.469 | 0.455 | 1.000 | | Organization (Y) | 1 | 2 | 3 | Total | | P(Y) | 0.039 | 0.496 | 0.465 | 1.000 | | Management (X) | 1 | 2 | 3 | Total | | P(X) | 0.076 | 0.469 | 0.455 | 1.000 |
|
|
In order to investigate whether these distributions are similar or not, the relative entropy (Kullback – Liebler distance) values are computed. D(fM || fF) = 0.00065, D(fF || fM) = 0.00064The fact that these values are found to be close demonstrates that both genders show a similar distribution. Likewise, the relative entropy values found for genders according to OSA, ASA and GA are found.DOSA(fM || fF) = 0.0624, DOSA(fF || fM) = 0.0507DASA(fM || fF) = 0.0174, DASA(fF || fM) = 0.0169DGA(fM || fF) = 0.1362, DGA(fF || fM) = 0.0830The marginal probability distributions of both working position were found depending on each subscale. The marginal probability distribution of both position for the subscale of MSA is given in Table 8.| Table 8. Marginal probability distribution of organization and management for MSA |
| | Male (Y) | 1 | 2 | 3 | Total | | P(Y) | 0.058 | 0.480 | 0.462 | 1.000 | | Female (X) | 1 | 2 | 3 | Total | | P(X) | 0.053 | 0.493 | 0.454 | 1.000 |
|
|
In order to investigate whether these distributions are similar or not, the relative entropy (Kullback – Liebler distance) values are computed D(fM || fO) = 0.01733, D(fO || fM) = 0.02132The fact that these values are found to be close demonstrates that both working positions show a similar distribution. Likewise, the relative entropy values found for positions according to OSA, ASA and GA are found.DOSA(fM || fO) = 0.0068, DOSA(fO || fM) = 0.0062DASA(fM || fO) = 0.0029, DASA(fO || fM) = 0.0027DGA(fM || fO) = 0.0480, DGA(fO || fM) = 0.0411
4. Conclusions
The analyses performed in this study prove useful to find the degree of uncertainty and to determine the number of questions in a selected scale with entropy method. It was found out that if we only want to be informed about the level of customer satisfaction, the number of questions in the scale to be designed has to be fewer while the number of questions concerned has to be increased if it is desired to determine the level of customer satisfaction together with gender.For other studies, the survey can be reorganized by designing the scale with a new number of questions determined by the entropy method and reliability analyzes can be made again and information on customer satisfaction can be accessed in a shorter period of time.In addition to all these, the entropy values were interpreted within the scope of the information theory and various recommendations were made for the researchers, who may apply such a study in the future, pertaining to the number of questions of the new scales to be designed as to rapidly access information about customer satisfaction.
References
| [1] | Shannon, E. C.. A Mathematical Theory of Communication. The Bell System Technical Journal 27, (1948) 379 – 423 |
| [2] | Ege Oruç, Ö., Kuruoğlu, E., & Vupa, Ö. An application of entropy in survey scale. Entropy, 2009 11,(2009) ,598 – 605; DOİ: 10. 3990 / E11040598 |
| [3] | Von Baeyer, H. C. Information – The New Language of Science. Harvard University Press. (2004) |
| [4] | Rea, L. M., & Parker, R. A. (2005). Designing and Conducting Survey Research: A Comprehensive Guide (3rd ed.).John Wiley & Sons |
| [5] | Reh, J. F. (2009). Customer Satisfaction Survey. Retrieved January, 10, 2010, [Online]. Available: http://management.about.com/od/competitiveinfo/a/CustomerSatSurv.htm |
| [6] | Hill, N., Brierley, J., & Mac Dougall, R.. How to Measure Customer Satisfaction (2nd ed.). Gower Pub Co. (2003) |
| [7] | Cover, T. M., & Thomas, J. A. Elements of Information Theory (2nd ed.). New Jersey.John Wiley & Sons, (2006) |
| [8] | Kullback S.. The Kullback – Leibler distance. The American Statistician 41,( 1987),340 – 341 |
| [9] | Conklin, M. (2005). Measuring and Tracking Customer Satisfaction. Retrieved November 8, 2009, [Online]. Available: http://www.zoomerang.com/Whitepaper/Measuring-Tracking-Customer-Satisfaction/ |
| [10] | Wuensch, Karl L. What is a Likert Scale? and How Do You Pronounce 'Likert?'". East Carolina University. Retrieved April 30, (2009) |
| [11] | Burns, Alvin; Burns, Ronald. Basic Marketing Research (Second ed.). New Jersey: Pearson Education. pp. 245. (2008).ISBN 978-0-13-205958-9 |
 Abstract
 Reference
 Full-Text PDF
 Full-Text HTML